
ABSTRACT
Mounting evidence supports that CSCs (cancer stem cells) play a vital role in cancer recurrence. Therefore elimination of CSCs is currently considered to be an important therapeutic strategy for complete remission. A major obstacle in CSC research is the obtainment of sufficient numbers of functional CSC populations. Here, we established a method to induce bulk pancreatic cancer cells to CSCs via heterochromatin modulation. Two pancreatic cancer cell lines Panc1 and Bxpc3 were cultured for 4 days in inducing medium (mTeSR containing FBS, B27, MEK inhibitor, GSK3 inhibitor, and VPA), and another 2 days in sphere culture medium (mTeSR supplemented with B27). Then the induced cells were dissociated into single cells and cultured in suspension in sphere culture medium. It was found that the majority of induced cells formed spheres which could grow larger and be passaged serially. Characterization of Panc1 sphere cells demonstrated that the sphere cells expressed increased pancreatic cancer stem cell surface markers and stem cell genes, were more resistant to chemotherapy, and were more tumorigenic in vivo, indicating that the induced sphere cells acquired CSC properties. Thus, the inducing method we developed may be used to obtain a sufficient number of CSCs from cancer cells, and contribute to the research for CSC-targeting therapy.
Introduction
Pancreatic cancer is a highly lethal disease with an exceptionally high mortality rate. Resistance to conventional therapy and delayed diagnose are critical causes for the failure of pancreatic cancer treatment. Despite advances in medical and surgical therapy, pancreatic cancer remains a major cause of cancer-related death [Citation1,Citation2].
CSCs (cancer stem cells) are a small population of cancer cells which are capable of self-renewal, multipotent differentiation, tumorigenicity, and resistance to chemotherapy and radiation. Mounting evidence confirms that CSCs play a vital role in cancer recurrence. Therefore, elimination of CSCs is currently considered to be an important therapeutic strategy for permanent remission [Citation3].
Pancreatic CSCs were first isolated based on the cell surface marker CD24, CD44 and ESA from human pancreatic ductal adenocarcinoma (PDAC) in 2007 [Citation4]. Subsequently, other markers such as CD133 [Citation5], c-Met [Citation6], and ALDH [Citation7] have also been used in an attempt to identify and isolate CSCs. In spite of the growing list of CSC biomarkers, CSC research is hindered by a lack of specificity and consistency of these markers. Their expression is variably affected by isolation and culture conditions, and is not exclusively correlated with functional CSC features, such as tumorigenesis [Citation8,Citation9]. Thus, a robust and reliable marker-based method for CSC identification and characterization has seemed a great challenge. As a result, currently the greatest obstacle in CSC research is the isolation of sufficient numbers of functional CSC populations. At present, the most accepted strategies for the analysis of CSC are generally based on the detection of their basic functional features, such as serially transferable tumorigenic potential and anoikis resistance.
It has been observed that there is remarkable difference in global nuclear architecture between somatic cells and ES cells [Citation10–Citation13]. The predominant chromatin configuration in ES cells is more open and dispersed compared to the condensed chromatin in somatic cells. Furthermore, when ES cells differentiate to neural progenitor cells, some of the dispersed chromatin transitions to compact heterochromatin domains [Citation14]. Fussner et al. identified that constitutive heterochromatin was compacted in partial induced pluripotent stem (iPS) cells but reorganized into dispersed chromatin fibers as the fully reprogrammed iPS cell state was acquired [Citation15]. These findings suggest a strong correlation between heterochromatin structure and cell stemness state. Previous studies have shown that CSCs and bulk cancer cells may interconvert and transition to each other [Citation16–Citation18]. Therefore, it is reasonable to speculate that conversion of bulk cancer cells into CSCs could be achieved by modulating chromatin structure.
In the present study, we utilized small molecular compounds to decondense the heterochromatin of cancer cells. After induction for four days, the induced cells formed spheres in suspension culture. The tumorigenic and stem cell properties of these converted cells were also investigated
Results
Heterochromatin modulation with small molecular compounds
The association of heterochromatin structure with the cell stemness state has been noticed. Previous studies demonstrated that treatment with an MEK and GSK3 inhibitor cocktail (2i) led to conversion of partial iPS cells to full iPS cells [Citation15,Citation19] with dispersion of H3K9me3-enriched regions. The effects of valproic acid (VPA) on chromatin structure have also been reported. VPA treatment resulted in a prominent change in the distribution of heterochromatin [Citation20]. Based on these findings, we determined to combine VPA, MEK and GSK3 inhibitors together to modulate heterochromatin. As shown in , when Panc1 cells were cultured in inducing medium which included VPA, MEK and GSK3 inhibitors, heterochromatin markers H3K9me3 and HP1 were significantly reduced, suggestive of chromatin decondensation.
Cell sphere formation
To investigate whether the induced cancer cells could form tumorspheres, individual cell suspensions of Panc1 induced cells were plated in ultra-low attachment plates in sphere culture medium. The majority of cells formed spheres in suspension culture, and these spheres grew to become larger clusters within 3 days (-). Importantly, the spheres were able to be passaged serially. To determine whether the induction method applied to other cancer cell types, three cancer cell lines Bxpc3, H446 and Ecs9706 were induced in the same way, and all of them formed spheres ().
Figure 1. Induction of heterochromatin alteration. Panc1 cells were cultured in inducing medium (induction) or DMEM containing 10% FBS (control) for 48 hrs. Immunofluorescence images show a significant reduction of heterochromatin markers H3K9me3 and HP1 in induced cells. DNA was counterstained by DAPI. Scale bar is equal to 10 μm.
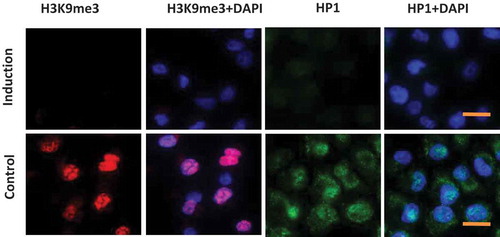
Figure 2. (A) Schematic diagram for the time line of CSCs induction. IM: Inducing medium; SM: Sphere culture medium. (B) Tumorsphere formation of different cancer cell lines. (a, b) Panc1 cells were induced with (a) or without (b) the small molecular compounds as described. In the presence of the compounds, cells formed typical tumorspheres (a); in contrast, in the absence of the compounds, only cell patches were observed (b). (c,d,e) Similarly, Bxpc3 (c), H446 (d), and Ecs9706 (e) cells also formed spheres in suspension culture after 4 days induction. Scale bars, 100 μm. (C) Differentiation of induced tumorsphere cells. Induced panc1 sphere cells were cultured in suspension for 5 days. Cells were then digested into single cells and cultured in DMEM containing 10% FBS for 3 days. These cells restored their original morphology (upper panel) as parental panc1 cells (lower panel).
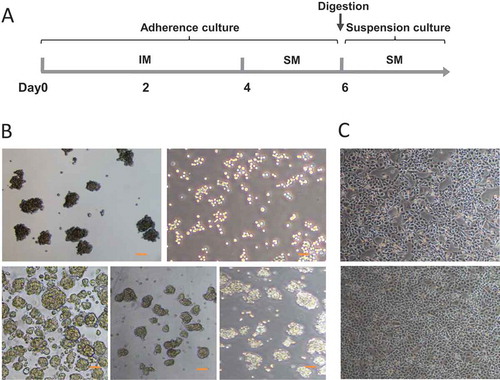
We then tested whether the induced sphere cells were able to differentiate to their original state. The Panc1 spheres were harvested after culture in suspension for 5 days. The spheres were digested to individual cells by accutase, and then were transferred to matrigel-coated dishes. Cells were cultured in DMEM containing 10% FBS for three days. These cells were attached and proliferated, and restored their original morphology as parental panc1 cells ().
Characterization of induced sphere cells
CD24, CD44, ESA and CD133 are considered as the major surface markers of pancreatic cancer stem cells [Citation3]. In the present study, we detected the expression of surface marker CD24, CD44, ESA and CD133 in panc1 adherent cells and induced sphere cells. Flow cytometry analysis revealed that CD133 expression was significantly upregulated in induced sphere cells. The expression of CD24, CD44 and ESA in sphere cells also increased to some degree ().
To investigate whether the sphere cells acquired stem cell properties, we then evaluated the levels of Oct4 and Nanog, two important markers of embryonic stem cells [Citation21]. The expression of Oct4 and Nanog in Panc1 sphere cells was significantly higher than that in adherent cells (), suggesting that the induced sphere cells had CSC features.
Figure 3. (A) Flow cytometry analysis of CD44, CD24, ESA and CD133 in Panc1 adherent cells and induced sphere cells. FSC vs SSC gating strategy was first used to exclude the dead cells and debris. The histogram displays the fluorescence intensity (MFI) of the live cells of different groups.* P < 0.05. (B) Increased expression of Oct4 and Nanog in Panc1 sphere cells compared to the adherent parental cells. Panc1 sphere cells were digested to individual cells and transferred to matrigel-coated dishes. 24 hrs later, cells were used for immunoflurescence staining. DNA was counterstained by DAPI. Scale bar, 10 μm. The histogram displays the percentage of positive cells. *: P < 0.05 (C) mRNA levels of indicated genes were evaluated by RT-PCR. A: Panc1 adherent cells; S: Panc1 induced sphere cells.
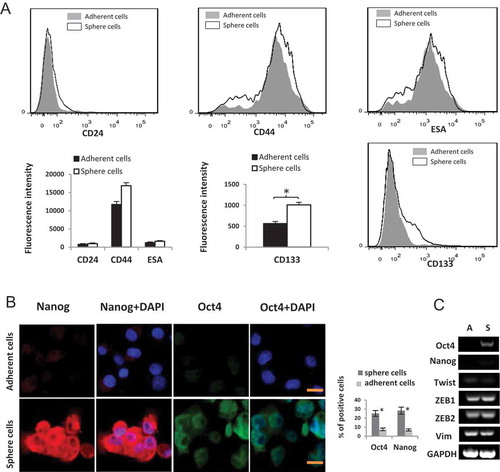
To examine whether EMT was involved in the induction process, the expression levels of mesenchymal genes such as VIM, Twist, ZEB1, and ZEB2 were analyzed by RT-PCR. No significant difference was detected between Panc1 sphere cells and adherent cells ().
Functional features of induced sphere cells
Chemotherapy resistance is considered a particular characteristic of cancer stem cells [Citation22]. To address whether Panc1 induced sphere cells resisted anti-neoplastic drugs more than adherent cells, we tested gemcitabine and 5-FU, which are usually used for the treatment of pancreatic cancers. Cells were incubated with gemcitabine and 5-FU for 3 days. The results showed that cell viability was significantly higher in Panc1sphere cells than that in adherent cells (), indicating that induced sphere cells were more resistant to chemotherapy than adherent cells.
Cells that exclude Hoechst 33342 are referred to as side population (SP) cells. It was confirmed that SP cells had an enhanced efflux capacity not only for Hoechst 33342 dyes but also for anti-cancer drugs [Citation23,Citation24]. To examine whether induced sphere cells expelled Hoechst 33342 more than panc1 adherent cells did, we stained single cells of Panc1 adherent cells and induced sphere cells with Hoechst 33342 and PI. The Hoechst 33342 staining of induced sphere cells was significantly weaker than that of Panc1 adherent cells ().
Figure 4. (A) Drug sensitivity. After exposure to gemcitabine and 5-FU (20, 100 μg/ml) for 3 days, cell viability was significantly higher in Panc1 induced sphere cells than in adherent cells. (B) Exclusion of Hoechst 33,342. Cells were incubated with Hoechst 33,342 (blue) and PI (red). The Hoechst 33,342 staining of Panc1 sphere cells was remarkably weaker than that of Panc1 adherent cells. PI staining labeled apoptotic cells. (C) Cell proliferation. The proliferation rate of Panc1 induced sphere cells was significantly lower than that of Panc1 adherent cells.
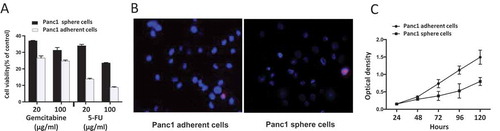
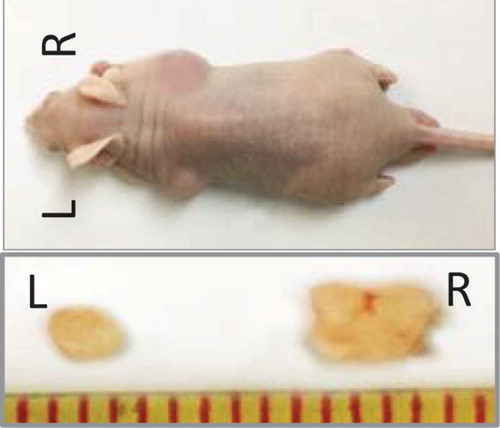
Figure 5. Tumorigenicity in vivo. 1 × 10³ cells were injected subcutaneously into both flanks of the nude mice (n = 5/group). Panc1 adherent cells were injected on the left (L), and the induced sphere cells were injected on the right (R). After 8 weeks, the mice were euthanized and the tumors were removed and measured.
Similar to previous studies, we found that the proliferation rate of Panc1 induced sphere cells was significantly lower than that of the adherent cells ().
Tumorigenicity in vivo
To evaluate the tumor-initiating capabilities of the induced sphere cells, Panc1 adherent and induced sphere cells were subcutaneously injected into nude mice at different numbers ranging from 101 to 106 cells. The Panc1 sphere cells gave rise to tumors when only 102 cells were injected. By contrast, no tumors formed when 102 Panc1 adherent cells were injected (),implying that Panc1 induced sphere cells had increased tumorigenicity in vivo than adherent cells. Consistently, the size of the tumor from Panc1 sphere cells was larger than that from Panc1 adherent cells ().
Table 1. Primers for RT-PCR.
Table 2. Tumorigenicity in vivo.
Discussion
In the present study, we reprogrammed cancer cells by modulating the chromatin structure with 3 small molecular compounds. The effects of GSK3 inhibitor, MEK inhibitor and VPA on chromatin structure have been validated [Citation15,Citation20]. We demonstrated that after two days treatment, the markers for heterochromatin, H3K9me3 and HP1, were dramatically reduced in the induced cells and the nuclear architecture of the resultant cells were characterized by dispersed chromatin ().
The correlation between heterochromatin organization in ES cells and their stemness state has been reported [Citation12,Citation14,Citation15,Citation19]. Consistent with these findings, we observed that with the alteration of heterochromatin structure, the induced cancer cells formed spheres, a specific characteristic of cancer stem cells. Moreover, the sphere cells expressed increased levels of stem cell gene Oct4 and Nanog. Importantly,their ability to exclude Hoechst 33342 dye and the resistance to 5-FU and gemcitabine were also enhanced. Furthermore, after injected into BALB/c nude mice, the induced sphere cells were more tumorigenic in vivo. These results corroborated that the induced sphere cells had acquired CSC properties.
Since CSCs are only small population in tumor cells, various methods have been developed to enrich CSCs. In previous studies, the culture medium used for pancreatic CSCs enrichment was serum-free DMEM/F-12 primarily containing EGF, bFGF, and B27 [Citation16,Citation25]. Given the fact that CSCs do not necessarily arise from tissue stem cells and have the potential to differentiate, it is necessary to culture them in medium that can prevent differentiation. To maintain the stem cell properties and viability of the induced sphere cells, we determined to culture them in mTeSR containing 20 µl/ml B27. Our data demonstrated that this medium allowed the spheres to grow larger and to be passaged serially.
The flow analysis revealed that the expression levels of CD24, CD44, ESA and CD133 were enhanced in Panc1 induced sphere cells compared to the adherent cells. While various markers of pancreatic CSCs such as ESA, CD44, CD24 and CD133 have been validated, they remain prone to artifacts [Citation3]. Due to the lack of consistency and correlation of established markers with functional CSC features [Citation8,Citation9], it is still very challenging to obtain sufficient numbers of CSCs with marker-based method for CSCs characterization. As CSCs bear the functional plasticity for transitioning between mesenchymal-like and epithelial-like states [Citation26,Citation27], we then investigated whether epithelial-to-mesenchymal transition (EMT) was involved in the conversion of bulk cancer cells into CSCs. The expression levels of EMT-related genes were examined. No significant changes of Vim, TWIST, ZEB1, and ZEB2 levels were detected, indicating that CSCs conversion via heterochromatin remodeling did not undergo EMT process.
Two tumor propagation models,namely,the cancer stem cell model and the stochastic model, have been put forward [Citation28]. Recent study suggests a model that combines aspects of both models. The combination model proposes that both cancer stem cell model and stochastic model contribute to the tumor heterogeneity [Citation29], which is supported by our data. 48 hrs after induction with the small molecular compounds, heterochromatin alteration occurred in most cancer cells, and a majority of them formed spheres. Importantly, when cultured in their regular medium (DMEM containing 10% FBS), the induced sphere cells differentiated back to their original morphology ().
CSCs are now considered to be a new therapeutic target, and it is believed that their eradication could lead to permanent remission. However, CSCs are not a homogeneous clonal population of cells, but undergo genetic or epigenetic evolution during tumor progression [Citation3,Citation30,Citation31]. The change in environment that occurs during cell culture may result in the alteration of CSC properties. As different CSC subclones have different characteristics, therapeutic approaches need to be designed to target diverse CSC subclones. Our result revealed that after 4 days induction, most cancer cells formed spheres in suspension. Furthermore, we found that with heterochromatin remodeling, cancer cells could be converted into different CSCs when cultured in different conditions. Therefore, the method we report here could be applied to preparation of diverse CSCs in an efficient way, and thereby contribute to the development of CSC-targeting therapies.
Conclusion
The importance of pancreatic CSCs for tumor progression and recurrence has been supported by an increasing body of evidence. The resistance of CSCs to conventional anticancer treatments represents a plausible explanation for the relapse of the disease. Currently, efforts are being made to establish CSC-targeting therapy. However, the low incidence of CSCs in tumors makes it very challenging to thoroughly understand the biology of CSCs. We found that bulk cancer cells could be efficiently converted into CSCs via heterochromatin modulation. The method we have developed can be applied to obtainment of sufficient numbers of CSCs for research, and may also contribute to the development of personalized therapeutic approaches based on the heterogeneity of CSCs.
Materials and methods
Cell culture
The human pancreatic cancer cell lines Panc1 and Bxpc3, the small cell lung cancer line H446 were provided by Dr. An Guangyu’s lab. The human esophageal cancer cell line Eca9706 was obtained from the Cell Bank of the Chinese Academy of Sciences (Shanghai, China).
Panc1 and H446 cells were cultured in DMEM (Gibco-life Technologies, USA) containing 10% fetal bovine serum (FBS) (Gibco/Invitrogen, Australia), 1% penicillin/streptomycin (PS) (Invitrogen). Bxpc3 and Eca9706 cells were cultured in RPMI-1640 (Gibco-life Technologies, USA) supplemented with 10% FBS and 1% PS. All the cells were incubated at 37℃ in a humidified incubator in the presence of 5% CO2.
Induction and culture of induced sphere cells
The inducing medium is based on mTeSR (Stemcell, Canada) containing 10% FBS (Gibco/Invitrogen, Australia), 20 µl/ml B27 supplement (Gibco,USA), 0.5 μM PD0325901 (MEK inhibitor, Selleck.cn), 3 μM CHIR99021 (GSK3 inhibitor, Selleck.cn), 1 μM Valproic Acid (Sigma-Aldrich), 1X anti-mycotic solution (Sigma-Aldrich), and 1% penicillin/streptomycin (Invitrogen). Cells were cultured in inducing medium for 4 days, and the medium was changed every other day. Then the cells were cultured in sphere culture medium for another two days. The sphere culture medium is mTeSR containing 20 µl/ml B27 supplement and 1% PS. On day 6, the induced cells were dissociated into single cells with accutase (Gibco, USA), and were plated in ultra-low attachment plates in sphere culture medium (). The medium was renewed every 3 days.
Flow cytometric analysis
Individual Panc1 adherent cells and sphere cells were resuspended in PBS and stained with the directly conjugated monoclonal antibodies BV421 anti-human CD133 antibody (1:20) (BD Biosciences, USA),APC anti-human CD24 antibody (1:20) (Biolegend, USA), FITC anti-human CD44 antibody (1:20) (Biolegend, USA) or PE anti-human CD326 antibody (ESA, 1:20) (Biolegend, USA) for 1h at 4℃, then the cells were washed with PBS for three times. Flow cytometry analysis was performed by using FACS-Canto II (BD Biosciences, USA).
Immunofluorescence assay
Cells were washed with PBS, fixed with 4% paraformaldehyde, permeabilized with 0.3% TritonX-100, blocked in PBS containing 5% bovine serum albumin (BSA) (Invitrogen, USA) for 1 hour and incubated with the primary antibodies overnight at 4℃. After being washed with PBS, the cells were incubated with the secondary antibody conjugated with TRITC or FITC at room temperature in the dark for 1 hour. DAPI was added for nuclear staining. After being washed with PBS, the cells were examined under a fluorescence microscope (IX71, Olympus, Japan). The following antibodies were used: primary antibodies to human OCT4 (Millipore), Nanog (Millipore), HP1 (Abcam), and H3K9me3 (Abcam). For quantitation, three distinct fields per slide were acquired on Mantra Quantitative Pathology Imaging System (Perkin Elmer) and the percent positivity was determined using Inform2.1 software (Caliper Life Sciences).
Analysis of gene expression
For each sample, total RNA from two samples was extracted with TRIzol (Gibco, USA). After which 1μg of RNA was reverse transcribed with the TransScript One-Step cDNA kit (TransGen Biotech, china). The sequence of gene-specific primers for human cDNA was shown in . Amplified products were separated by electrophoresis on 2% agarose gels, stained with ethidium bromide, detected by G:BOX (SYNGENE, USA) and quantitated with ImageQuant software. GAPDH gene served as reference gene.
Drug sensitivity assay
Panc1 adherent cells and induced sphere cells were plated at a density of 5 × 10³ cells/well in 96-well cell culture plates in 200 μl of DMEM containing 10% FBS. The cells were cultured for 24h and then treated with different concentrations (20 or 100 μg/ml) of gemcitabine (HANSOH PHARMA, China) and 5-fluorouracil (5-FU) (Sigma, USA). After incubation for 96h, the viability of the cells was assayed by CCK8 kit according to the manufacturer’s instructions. The final values were averaged from four independent experiments.
Hoechst 33342 efflux assay
Panc1 adherent cells and induced sphere cells were prepared to individual cell suspension in pre-warmed DMEM and incubated with Hoechst 33342 (Sigma, USA) at a final concentration 5 μg/mL at 37℃ for 30 min. After two washes in PBS, the cells were resuspended in 1 ml PBS. The cells were counterstained with 2 μg/ml PI (BD biosciences, USA) for 15 minutes. Finally, the cells were examined and photographed under a fluorescence microscope (Olympus, Orangeburg, NY).
Cell proliferation assay
Panc1 adherent cells and induced sphere cells were plated at a density of 5X10³ cells/well in 96-well plates and cultured in DMEM containing 10% FBS. Cellular proliferation was assessed at different time points (24, 48, 72, 96 and 120 hrs) by CCK-8 kit (Cell Counting Kit-8, KeyGEN BioTECH, China). According to the manufacturer’s protocol, 100 μl of fresh DMEM medium containing 10 μl of the CCK-8 solution was added to each well and incubated at 37℃ for 1 hr. Absorbance at 450 nm was measured by VARIOSKAN FLASH (Thermo scientific, USA). Four independent experiments were performed, and the average values of these four experiments generated cell growth curves.
Xenograft tumorigenicity assay
Four to six week old male BALB/c nude mice(Charles river, china)were purchased from and housed under standard conditions. For cell xenograft experiments, the cell suspension (100 μl) were mixed with matrigel (100 μl) (BD biosciences, USA), and 200 μl was injected subcutaneously into both flanks of the mice at the dose 1 × 10², 1 × 10³, 1 × 10⁴, 1 × 10⁵ or 1 × 10⁶ cells (n = 5/group). Panc1 adherent cells were injected on the left, and the induced sphere cells were injected on the right. Tumor formation was monitored every other day from 2 weeks after inoculation. After 8 weeks, the mice were euthanized under anesthesia and the tumors removed and measured.
Statistical analysis
For analysis, t-tests were used, and P<0.05 was considered significant. Statistical results were analyzed using the SPSS version 21.0.
Ethics statement
The animal experiments were approved by the Experimental Animal Center and by the Animal Ethics Committee of Beijing Chaoyang Hospital, Capital Medical University, Beijing, China.
Disclosure statement
No potential conflict of interest was reported by the authors.
Additional information
Funding
References
- Jemal A, Bray F, Center MM, et al. Global cancer statistics. CA Cancer J Clin. 2011;61:69–90.
- Ercan G, Karlitepe A, Ozpolat B. Pancreatic cancer stem cells and therapeutic approaches. Anticancer Res. 2017;37:2761–2775.
- Raj D, Aicher A, Heeschen C. Concise review: stem cells in pancreatic cancer: from concept to translation. Stem Cells. 2015;33:2893–2902.
- Li C, Heidt DG, Dalerba P, et al. Identification of pancreatic cancer stem cells. Cancer Res. 2007;67:1030–1037.
- Hermann PC, Huber SL, Herrler T, et al. Distinct populations of cancer stem cells determine tumor growth and metastatic activity in human pancreatic cancer. Cell Stem Cell. 2007;1:313–323.
- Li C, Wu JJ, Hynes M, et al. c-Met is a marker of pancreatic cancer stem cells and therapeutic target. Gastroenterology. 2011;141(6):2218–2227.e5.
- Kim MP, Fleming JB, Wang H, et al. ALDH activity selectively defines an enhanced tumor-initiating cell population relative to CD133 expression in human pancreatic adenocarcinoma. PloS One. 2011;6:e20636.
- Clarke MF, Dick JE, Dirks PB, et al. Cancer stem cells–perspectives on current status and future directions: AACR workshop on cancer stem cells. Cancer Res. 2006;66:9339–9344.
- Liu Y, Nenutil R, Appleyard MV, et al. Lack of correlation of stem cell markers in breast cancer stem cells. Br J Cancer. 2014;110:2063–2071.
- Efroni S, Duttagupta R, Cheng J, et al. Global transcription in pluripotent embryonic stem cells. Cell Stem Cell. 2008;2:437–447.
- Zaidan NZ, Walker KJ, Brown JE, et al. Compartmentalization of HP1 proteins in pluripotency acquisition and maintenance. Stem Cell Rep. 2018;10:627–641.
- Kidder BL, He R, Wangsa D, et al. SMYD5 controls heterochromatin and chromosome integrity during embryonic stem cell differentiation. Cancer Res. 2017;77:6729–6745.
- Christogianni A, Chatzantonaki E, Soupsana K, et al. Heterochromatin remodeling in embryonic stem cells proceeds through stochastic de-stabilization of regional steady-states. Biochim Biophys Acta. 2017;1860:661–673.
- Hiratani I, Ryba T, Itoh M, et al. Genome-wide dynamics of replication timing revealed by in vitro models of mouse embryogenesis. Genome Res. 2010;20:155–169.
- Fussner E, Djuric U, Strauss M, et al. Constitutive heterochromatin reorganization during somatic cell reprogramming. EMBO J. 2011;30:1778–1789.
- Ning X, Du Y, Ben Q, et al. Bulk pancreatic cancer cells can convert into cancer stem cells(CSCs) in vitro and 2 compounds can target these CSCs. Cell Cycle (Georgetown, Tex). 2016;15:403–412.
- Platet N, Mayol JF, Berger F, et al. Fluctuation of the SP/non-SP phenotype in the C6 glioma cell line. FEBS Lett. 2007;581:1435–1440.
- Mitsutake N, Iwao A, Nagai K, et al. Characterization of side population in thyroid cancer cell lines: cancer stem-like cells are enriched partly but not exclusively. Endocrinology. 2007;148:1797–1803.
- Silva J, Barrandon O, Nichols J, et al. Promotion of reprogramming to ground state pluripotency by signal inhibition. PLoS Biol. 2008;6:e253.
- Marchion DC, Bicaku E, Daud AI, et al. Valproic acid alters chromatin structure by regulation of chromatin modulation proteins. Cancer Res. 2005;65:3815–3822.
- Tay Y, Zhang J, Thomson AM, et al. MicroRNAs to Nanog, Oct4 and Sox2 coding regions modulate embryonic stem cell differentiation. Nature. 2008;455:1124–1128.
- Sergeant G, Vankelecom H, Gremeaux L, et al. Role of cancer stem cells in pancreatic ductal adenocarcinoma. Nat Reviews Clin Oncology. 2009;6:580–586.
- Bhagwandin VJ, Bishop JM, Wright WE, et al. The metastatic potential and chemoresistance of human pancreatic cancer stem cells. PloS One. 2016;11:e0148807.
- Zhou J, Wang CY, Liu T, et al. Persistence of side population cells with high drug efflux capacity in pancreatic cancer. World J Gastroenterol. 2008;14:925–930.
- Gaviraghi M, Tunici P, Valensin S, et al. Pancreatic cancer spheres are more than just aggregates of stem marker-positive cells. Biosci Rep. 2011;31:45–55.
- Nieto MA. Epithelial plasticity: a common theme in embryonic and cancer cells. Science (New York, NY). 2013;342:1234850.
- Liu S, Cong Y, Wang D, et al. Breast cancer stem cells transition between epithelial and mesenchymal states reflective of their normal counterparts. Stem Cell Rep. 2014;2:78–91.
- Cabrera MC, Hollingsworth RE, Hurt EM. Cancer stem cell plasticity and tumor hierarchy. World J Stem Cells. 2015;7:27–36.
- Wang W, Quan Y, Fu Q, et al. Dynamics between cancer cell subpopulations reveals a model coordinating with both hierarchical and stochastic concepts. PloS One. 2014;9:e84654.
- Heeschen C, Sancho P. More challenges ahead-metabolic heterogeneity of pancreatic cancer stem cells. Mol Cell Oncol. 2016;3:e1105353.
- Sancho P, Alcala S, Usachov V, et al. The ever-changing landscape of pancreatic cancer stem cells. Pancreatology. 2016;16:489–496.