
ABSTRACT
Organismal aging entails a gradual decline of normal physiological functions and a major contributor to this decline is withdrawal of the cell cycle, known as senescence. Senescence can result from telomere diminution leading to a finite number of population doublings, known as replicative senescence (RS), or from oncogene overexpression, as a protective mechanism against cancer. Senescence is associated with large-scale chromatin re-organization and changes in gene expression. Replication stress is a complex phenomenon, defined as the slowing or stalling of replication fork progression and/or DNA synthesis, which has serious implications for genome stability, and consequently in human diseases. Aberrant replication fork structures activate the replication stress response leading to the activation of dormant origins, which is thought to be a safeguard mechanism to complete DNA replication on time. However, the relationship between replicative stress and the changes in the spatiotemporal program of DNA replication in senescence progression remains unclear.
Here, we studied the DNA replication program during senescence progression in proliferative and pre-senescent cells from donors of various ages by single DNA fiber combing of replicated DNA, origin mapping by sequencing short nascent strands and genome-wide profiling of replication timing (TRT).
We demonstrate that, progression into RS leads to reduced replication fork rates and activation of dormant origins, which are the hallmarks of replication stress. However, with the exception of a delay in RT of the CREB5 gene in all pre-senescent cells, RT was globally unaffected by replication stress during entry into either oncogene-induced or RS. Consequently, we conclude that RT alterations associated with physiological and accelerated aging, do not result from senescence progression. Our results clarify the interplay between senescence, aging and replication programs and demonstrate that RT is largely resistant to replication stress.
Introduction
DNA is not randomly distributed in the nucleus, as sub-chromosomal domains occupy discrete nuclear regions. In general, gene-rich regions are preferentially located at the nuclear center while gene-poor segments are mostly at the periphery [Citation1,Citation2]. Correct nuclear organization is critical to maintain proper gene regulation and cell physiology [Citation3]. Increasing evidence suggests that genome architecture anomalies are linked to distinct diseases [Citation4–Citation8] and that chromatin organization changes globally during cellular senescence [Citation9–Citation11].
Organismal aging involves a stochastic progressive failure of cellular maintenance and repair, known as senescence [Citation12,Citation13]. Normal mammalian cells have a finite number of population doublings when cultured in vitro and when that limit is reached, they enter an irreversible cell cycle arrest termed senescence [Citation14,Citation15]. Senescence is a highly stable state that can be reached by exhaustion of proliferative potential (Replicative Senescence; RS) or by cellular insults such as oncogene hyper-activation (Oncogene Induced Senescence; OIS), reactive oxidative species and DNA damage [Citation16,Citation17]. Cellular senescence is a major mechanism in both health and disease and it has natural positive roles in embryonic development [Citation18], tumor suppression and wound healing. However, senescence has deleterious effects in age-related hyperplastic and degenerative diseases [Citation19]. Many extrinsic and intrinsic cellular insults, including genomic and epi-genomic damage, tumor suppressor inactivation and oncogene activation, induce cellular senescence [Citation16]. These cellular insults engage two major tumor suppressor pathways, p53/p21 and Rb/p16, which in large part control the senescence phenotype. This phenotype includes stable cell-cycle arrest and changes in chromatin organization and gene expression. p53/p21 and Rb/p16 activation leads to senescence-associated heterochromatic foci, increased senescence-associated-β-Gal activity, up-regulation of p16INK4A and p21CIP1 and other metabolic changes [Citation10,Citation20–Citation25]. Senescent cells also produce many pro-inflammatory cytokines, triggering profound changes in the extracellular matrix, known as the senescence associated secretory phenotype [Citation26].
The spatial organization of chromatin is closely aligned with the temporal order in which the genome is duplicated, known as the replication-timing program [Citation27]. Chromatin conformation methods that map long-range chromatin interactions [Citation28] have revealed that chromosomes consist of topologically associated domains that are replicated as units [Citation27,Citation29]. There are dynamic changes in the temporal order of replication during development, coordinated with transcriptional activity [Citation30,Citation31]. Moreover, clusters of genomic regions with unique replication timing (RT) programs can distinguish specific cell types [Citation7,Citation31] and define complex circuits of gene regulatory networks (Rivera-Mulia et al, 2017 doi: https://doi.org/10.1101/186866). Overall, RT is a very informative functional readout of large-scale chromatin organization.
It has previously been shown that oncogene over-expression causes replicative stress, which leads to slowing of fork rates and activation of dormant origins [Citation27,Citation32–Citation34] than can result in senescence [Citation18]. The global changes in genome organization described in premature aging syndrome [Citation35], might coincide with the chromatin re-modelling that is observed in oncogene-induced senescence (OIS) [Citation36]. Despite the general observations that replication stress might lead to DNA damage and cell cycle arrest it is not known how replication stress affects the RT program during senescence progression.
Here, we have measured replication fork rates, replication origin usage and finally genome-wide RT in proliferative and pre-senescent fibroblasts obtained from distinct-age donors and donors with accelerated aging syndrome. We demonstrate here that cells experience replicative stress upon entry into RS. Despite the fact that we identified RT signatures related to physiological and accelerated aging, the global RT program was globally preserved after induction of senescence by either oncogenes or when reaching RS. Our results thus uncouple the major characteristics of replicative stress (alterations in fork rates and dormant origin activation) from the RT program.
Results
Induction of replication stress upon entry into senescence
Aging stem cells stop dividing [Citation37,Citation38], but the stress they experience during senescence progression has not been precisely analyzed. Oncogene activation triggers cell cycle arrest and senescence within a few cell cycles[Citation16] and oncogenes also trigger replication stress in response to hyper-proliferation [Citation33]. However, it is not known if replicative stress precedes RS and decreased proliferation or comes after it. For these reasons, we analyzed whether induction of RS by serial passaging also triggers replication stress. Primary fetal fibroblasts (IMR90) were expanded until two passages before reaching RS cell cycle arrest ()).
Figure 1. Pre-senescent fibroblasts are under replication stress. (a) Scheme of induced cellular senescence by serial passaging. Pre-senescent cells (two passages before RS) were analyzed. B-C DNA combing from asynchronous cells successively labeled with IdU (red) and with CldU (green) of proliferative (b) and pre-senescent (c) IMR90 fibroblasts. DNA fibers are shown in blue. (d) Inter-Origin Distance and fork velocity are significantly decreased in pre-senescent IMR90 fibroblasts. (e-g) Mapping short nascent strands (SNSs) by DNA sequencing detected fewer origins peaks (e), a decreased size of initiation zones (f) and increased number of regions without detectable origins (g)
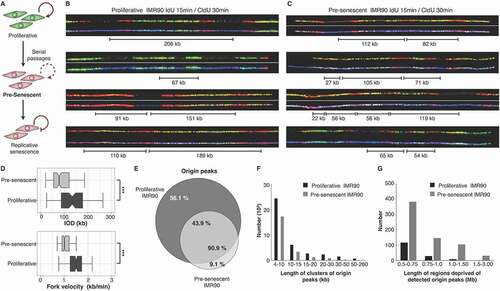
We then measured fork velocities and inter-origin distances on these pre-senescent cells by DNA fiber molecular combing of replicated DNA. Pre-RS fibroblasts had a decreased mean fork velocity and an increased density of origin firing compared to proliferative cells at early passages ( and Supplementary Figure 1(a) and 1(b)). These features define replication stress [Citation39,Citation40] therefore our experiment shows that fibroblasts experience replication stress before the onset of RS.
We also mapped replication initiation sites by short nascent strand sequencing [Citation41,Citation42] and found the pre-senescent cells had fewer origin peak ()), a decreased size of initiation zones ()) and an increased number of regions without detectable origins ()) in pre-senescent cells, compared to proliferative cells at early passages. The detection of an increased origin density by DNA fibers, and fewer detectable initiation sites, by mapping, are both consistent with the activation of many dormant origins, within different cells using different cohorts of origins [Citation34,Citation39,Citation40]. Many of these origins are undetectable by short nascent strand sequencing, as they are not supposed to be activated at identical positions in the whole cell population (Supplementary Figure 1(c) and 1(d)). Taken together, these results consistently and directly demonstrate that replication stress occurs prior to entry into RS.
The RT program is globally preserved upon entry into RS
It has been reported that OIS results in alterations in the RT program before senescence-like cell-cycle arrest [Citation36]. To determine whether the RT program is affected during RS progression, we performed genome-wide RT analyses as previously described [Citation43,Citation44] during induction of cellular senescence in fibroblasts from fetal, neonatal and a 74 year-old donors and their early passage proliferative counterparts (). Previously, we showed that replicative stress as well as changes in gene expression, nuclear morphology and ultimately in chromatin organization are observed in replicative senescent fibroblasts [Citation45]. However, we found the RT program was globally preserved upon entry into RS. Strong correlations (r > 0.95) of genome-wide RT between proliferative and pre-senescent cells were found for all fetal, neonatal and 74 year-old donor fibroblasts ()). The proliferative and pre-senescent cells had almost identical RT profiles (-e)). Very few regions (< 0.5% of the genome) differed significantly (Supplementary Figures 2–4).
Figure 2. The RT program is maintained upon entry to cellular senescence. (a) Scheme of the induced replicative senescence by serial passaging or oncogene hyper-activation (OIS). Pre-senescent cells (two passages before RSfor serial passaging or 48 hours after induction of Ras) were analyzed. (b) Correlation matrix of genome-wide RT program from proliferative and pre-senescent fibroblasts of distinct age donors (fetal IMR90, neonatal BJ and aged 74 yr). (c-f). RT profiles of representative chromosome segments of proliferative and pre-senescent cells from: fetal fibroblasts (c), neonatal cells (d) and fibroblasts of 74 yr old donor (e), and oncogene hyper-activated fibroblasts (f)
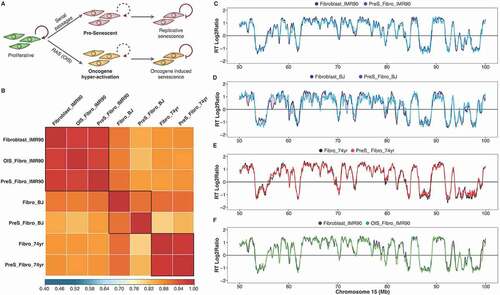
Figure 3. RT changes upon entry to cellular senescence. (a) Overlap analysis of significant RT variable regions identifying a unique region that changes upon entry to cellular senescence in all primary cells analyzed (OIS_IMR90 shown in red, PreS_IMR90 shown in yellow, PreS_BJ shown in green, PreS_Fibro74yrs shown in blue). (b) RT profiles of proliferative and pre-senescent cells from fetal fibroblasts (IMR90), from neonatal cells (BJ) and from fibroblasts of a 74 year-old donor, centered at the unique region that switches from early to late replication in pre-senescent cells. This locus is on chromosome 7 and contains the CREB5 gene. (c) Expression levels of CREB5 in normal (IMR90), senescent (OIS_ IMR90) and a senescence bypass model (IMR90_OIS_bypass). Transcription data are from [Citation46]
![Figure 3. RT changes upon entry to cellular senescence. (a) Overlap analysis of significant RT variable regions identifying a unique region that changes upon entry to cellular senescence in all primary cells analyzed (OIS_IMR90 shown in red, PreS_IMR90 shown in yellow, PreS_BJ shown in green, PreS_Fibro74yrs shown in blue). (b) RT profiles of proliferative and pre-senescent cells from fetal fibroblasts (IMR90), from neonatal cells (BJ) and from fibroblasts of a 74 year-old donor, centered at the unique region that switches from early to late replication in pre-senescent cells. This locus is on chromosome 7 and contains the CREB5 gene. (c) Expression levels of CREB5 in normal (IMR90), senescent (OIS_ IMR90) and a senescence bypass model (IMR90_OIS_bypass). Transcription data are from [Citation46]](/cms/asset/3115b0c6-b582-4532-9887-1263ef4a7b3d/kccy_a_1491235_f0003_oc.jpg)
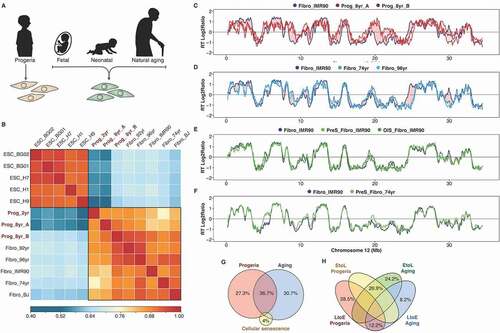
Figure 4. RT alterations in physiological and premature aging are not linked to cellular senescence. (a) Schematic depiction of the distinct cell samples analyzed: fibroblasts from distinct-age donors and from HGPS patients. (b) Correlation matrix of genome-wide RT programs from human ES cell lines (ESC_BG01, ESC_BG02, ESC_H1, ESC_H7, ESC_H9) and fibroblasts of distinct-age donors (Fibro IMR90, post-natal BJ, 74 yr, 92 yr and 96 yr) and HGPS patients (Prog_2yr, Prog_8yr_A and Prog_8yr_B). (c-f) RT profiles of a representative chromosome segment comparing normal IMR90 fibroblasts with HGPS cells (c); normal IMR90 fibroblasts with fibroblasts of distinct age donors (D); proliferative and pre-senescent cells from fetal fibroblasts (e); and proliferative and pre-senescent cells from fibroblasts of 74 yr old donor (f). (g) Overlap between the RT changes observed in HGPS, natural aging and cellular senescence. (h) Percentage of changes from early to late replication (EtoL) or late to early (LtoE) in HGPS and natural aging
The RT program is globally preserved after oncogene hyper-activation
Previous studies have reported a close relationship between RT changes and heterochromatic foci formation during OIS [Citation10]. Recently, a comparison of the RT programs between normal fibroblasts and oncogene hyper-activated fibroblasts detected earlier replication in regions associated with the nuclear lamina in pre-senescent fibroblasts during OIS. This suggested that changes in RT might precede senescence-associated heterochromatic foci formation and cellular senescence [Citation36]. However, their analysis ranked small differences in RT before and after OIS and compared the changes to nuclear lamina association and differences in histone marks. As we did not detect significant differences in RT during RS, we reanalyzed the same data from fibroblasts before and after Ras hyper-activation with the same parameters that we used before in previous studies and we applied for pre-replicative senescent cells and all other samples of our study ()). In contrast with the previous study [Citation36], our reanalysis revealed very strong correlations between fibroblasts after oncogene hyper-activation and normal proliferating fibroblasts (r > 0.95, )). Furthermore, RT profiles of oncogene-induced fibroblasts were almost indistinguishable from normal cells, with less than 0.10% of the genome slightly modified in replication () and Supplementary Figure 5). These results show that RT is largely unaffected by the onset of senescence, whether it is replicative or oncogene-induced.
Figure 5. RT signatures of aging and HGPS. (a) Hierarchical and k-means clustering of RT variable regions between proliferative fibroblasts from distinct age donors (Fibro IMR90, post-natal BJ, 74 yr, 92yr and 96 yr), pre-senescent fibroblasts (preS IMR90, OIS IMR90, pre-senescent BJ, preS 74 yr) and HGPS fibroblasts (Prog_2yr, Prog_8yr_A and Prog_8yr_(b). The heat map shows the RT ratios [= log2(Early/Late)]. Branches of the dendrogram were constructed based on the correlation values between distinct samples (distance = correlation value – 1). k-means clustering of switching segments define RT signatures of segments that were replicated differentially among the samples (labelled in grey boxes). Sex chromosomes were removed from the analysis to discard gender differences. B) RT values of the distinct genomic regions of each RT signature and significant differences are shown (*p-value < 2 x 10⁻¹⁶). (c) RT profiles at representative genomic regions of each RT signature. Significant changes are highlighted by grey boxes. (d) Ontology analysis of the distinct RT signatures. Analysis was performed with the Genomic Regions Enrichment of Annotations Tool [Citation74]. Statistical significance is shown at the bottom (p values measured by binomial test)
![Figure 5. RT signatures of aging and HGPS. (a) Hierarchical and k-means clustering of RT variable regions between proliferative fibroblasts from distinct age donors (Fibro IMR90, post-natal BJ, 74 yr, 92yr and 96 yr), pre-senescent fibroblasts (preS IMR90, OIS IMR90, pre-senescent BJ, preS 74 yr) and HGPS fibroblasts (Prog_2yr, Prog_8yr_A and Prog_8yr_(b). The heat map shows the RT ratios [= log2(Early/Late)]. Branches of the dendrogram were constructed based on the correlation values between distinct samples (distance = correlation value – 1). k-means clustering of switching segments define RT signatures of segments that were replicated differentially among the samples (labelled in grey boxes). Sex chromosomes were removed from the analysis to discard gender differences. B) RT values of the distinct genomic regions of each RT signature and significant differences are shown (*p-value < 2 x 10⁻¹⁶). (c) RT profiles at representative genomic regions of each RT signature. Significant changes are highlighted by grey boxes. (d) Ontology analysis of the distinct RT signatures. Analysis was performed with the Genomic Regions Enrichment of Annotations Tool [Citation74]. Statistical significance is shown at the bottom (p values measured by binomial test)](/cms/asset/9a467ab3-df2e-4cfd-9db3-a4e530978cf8/kccy_a_1491235_f0005_oc.jpg)
RT alterations in CREB5 during senescence progression
Although RT remains almost completely unaltered upon entry to cellular senescence, very few genomic regions change RT between proliferative and pre-senescent cells, irrespective of whether senescence is induced by serial passaging or oncogene hyper-activation ()). However, a unique genomic locus changed from early to late replication in all pre-senescent cells ()), namely a region on chromosome 7 containing the CREB5 gene ()). CREB5 codes for a protein that binds cAMP response elements. Interestingly, a slight down-regulation of CREB5 is observed during OIS and increased expression in a model of senescence bypass ())46.
RTalterations in physiological and premature aging are not linked to cellular senescence
Recently, we identified a progeroid-specific RT signature that distinguishes cells derived from patients with premature aging syndromes from those derived from healthy donors [Citation7]. Here, we investigated whether there is link between the RT alterations observed in natural aging and progeroid diseases with the small number of changes detected upon senescence induction. First, we compared the RT program from fibroblasts of distinct age donors and from patients with Hutchinson-Gilford progeria syndrome – HGPS ()). Human embryonic stem cells (hESCs) were used as a control of a distinct cell type with a different RT program. As expected from previous studies [Citation30,Citation31], we found significant changes in RT between hESCs and fibroblasts across 18% of the genome and correlation analysis of genome-wide RT distinguishes fibroblasts from pluripotent cells ()). Specific age-dependent gene expression patterns have been found in fibroblasts [Citation45]. However, we observed very strong genome-wide correlations of RT profiles between all fibroblasts from distinct age donors ()). Nevertheless, we found specific RT changes associated with the HGPS disease and with natural aging ().
Previous studies suggest that the global changes in chromatin organization observed in HGPS are coincident with the genome repositioning after in vitro induction of cellular senescence [Citation36]. However, we found that the alterations observed in HGPS ()), as well as those linked to natural aging ()), are not associated with changes upon senescence induction (). Overall, the RT changes in HGPS, natural aging and cellular senescence comprise < 5% of the genome. Overlap analysis suggests that although some RT alterations are common between HGPS and natural aging, specific genomic regions are replicated abnormally only in HGPS patients and none of the RT alterations observed in natural aging or HGPS overlapped with the changes detected upon induction of senescence ().
To further characterize the changes that occur during natural aging and in HGPS we expressed RT profiles as numeric vectors of 13,305 average RT ratios for non-overlapping 200 kb windows across the genome and variable regions were identified based on the RT log2 ratio changes across the samples. Then RT-variable regions were identified and clustered by unsupervised analysis [Citation31]. We identified specific age-related RT signatures, as well as a HGPS-specific signature (), confirming the observations of altered RT in cells derived from patients with progeroid syndromes [Citation7]. The RT signature “E–Progeria” contains regions that replicate early only in HGPS fibroblasts but later in cells from all healthy donors (). Additionally, we identified two RT signatures distinguishing the commonalities between cells of aged donors and HGPS fibroblasts (L–Aging&Prog and E–Aging&Prog), two signatures of genomic segments with altered RT in cells derived from aged donors (E-Aging and L-Aging) and signatures that distinguish postnatal fibroblasts from donors from fetal cells (E-Postnatal, L-Postnatal and L-Postnatal2). Exemplary RT profiles of each RT signature are shown in ). As previously described [Citation7], ontology analysis of regions that replicate early only in fibroblasts from HGPS patients revealed significant enrichment of genes whose abnormalities are associated with the main phenotypic characteristics of progeroid diseases ()).
Regions from the L–Aging RT signature replicated later in the cells from old donors (). These genomic segments were enriched for genes associated with cell differentiation and the BMP/TGF-ß pathway ()), suggesting down-regulation of genes required for the proliferation, differentiation, apoptosis regulation, cell migration and extracellular matrix remodeling [Citation47–Citation50]. The E–Aging RT signature includes regions that replicated earlier in the cells extracted from old donors () and is enriched in genes whose de-regulation is associated with cancer ()). All these alterations in RT linked to natural aging are not observed in pre-senescent cells, induced either by serial passaging or by OIS (). These results suggest that, although the cellular proliferative capacity might be relevant to the aging process due to its relation to tissue repair and maintenance, cellular senescence is distinct from the cellular phenotype observed in natural aging as previously suggested [Citation12,Citation51,Citation52] and can be distinguished by RT.
Regions from the E–Postnatal RT signature replicated early in all post-natal cells but late in fetal fibroblasts (), suggesting up-regulation of the genes associated with those genomic segments. Consistently, these regions were enriched for genes involved in the regulation of mesenchymal cell proliferation and cell motility, suggesting a necessary role in the proper function of mature fibroblasts ()).
Ontology analysis of the genomic regions that replicate late in aged and HGPS cells contain regulatory genes of muscle and epithelial cell differentiation. This is consistent with earlier observations of potential myogenic conversion of fibroblasts [Citation53–Citation55] and the regulatory role of fibroblasts cells in myoblast differentiation [Citation56]. Additionally, these genomic regions include genes required for the proper organization of the Golgi apparatus ()), consistent with the altered Golgi morphology observed in senescent cells and HGPS fibroblasts [Citation57–Citation59]. In contrast, the regions from the E-Aging&Progeria RT signature include genes required for mitochondrial import of proteins ()), which is critical to normal regulation of the translocation of nuclear-encoded mitochondrial proteins [Citation60,Citation61], which has been associated with the mitochondrial dysfunction observed in senescent cells [Citation16,Citation62,Citation63]. Indeed, impaired mitochondrial import has been observed after overexpression of these genes [Citation64] and distinct components of the mitochondrial import machinery are increased in a mouse model of premature aging [Citation65].
Whereas we identified RT signatures that distinguish different types of fibroblasts from fetal, postnatal and physiological and pathological aging, according to their changes in RT from Early to Late or Late to Early, these RT signatures could not distinguish between proliferative and pre-senescent cells. This is likely due to the very few domains changing in RT between proliferative to pre-senescent cells (). In addition, there is no change in RT at the CREB 5 gene domain in the physiological of accelerated aging signature.
Late to early RT changes in natural aging and HGPS occur at lamin associated domains (LADs)
The nuclear lamina plays an important role in senescence and senescence-associated heterochromatic foci formation, and the altered chromatin organization and genomic instability observed in HGPS cells have been linked to the abnormal nuclear lamina organization [Citation66,Citation67]. Hence, we analyzed whether the RT alterations detected in natural aging and HGPS occurs at regions normally associated with the nuclear lamina. First, we mapped the lamin-B associated domains (LADs) identified by different techniques in normal fetal fibroblasts [Citation68,Citation69] and observed a high overlap (> 80%, Supplementary Figure 6), suggesting a specific organization of chromatin interactions to the nuclear lamina in normal cells. Next we analyzed the relationship between RT and proximity to the LADs and observed that early replication was enriched in regions distant to LADs ()). Then, we mapped the proximity to the LADs for the regions within each of the RT signatures. Strikingly, all changes to early replication in postnatal, aging and HGPS cells were significantly enriched in regions in close proximity or within the LADs found in fetal fibroblasts (). These results are consistent with previous studies that show a decrease in chromatin interactions with the nuclear lamina both in cellular senescence and HGPS cells [Citation35,Citation36,Citation69]. Moreover, these results suggest that some late-replicating LADs in fetal fibroblasts detach from the nuclear envelope in postnatal fibroblasts.
Figure 6. Early to late RT changes occur at lamin-associated domains (LADs). (a) Scatterplot of RT and distance to IMR90 LADs. (b) Distribution of genomic regions with respect to IMR90 LADs. (c) Histogram of distances to the nearest LADs of regions from distinct RT signatures. The Sequential Monte Carlo multiple testing (MCFDR) algorithm [Citation75] was applied to test whether the regions from each RT signature are closer than expected by chance to the LADs (p-values are shown). IMR90 LADs were obtained from [Citation69]
![Figure 6. Early to late RT changes occur at lamin-associated domains (LADs). (a) Scatterplot of RT and distance to IMR90 LADs. (b) Distribution of genomic regions with respect to IMR90 LADs. (c) Histogram of distances to the nearest LADs of regions from distinct RT signatures. The Sequential Monte Carlo multiple testing (MCFDR) algorithm [Citation75] was applied to test whether the regions from each RT signature are closer than expected by chance to the LADs (p-values are shown). IMR90 LADs were obtained from [Citation69]](/cms/asset/72a8fc49-ca44-4a99-96ed-698ff4c9d745/kccy_a_1491235_f0006_oc.jpg)
Discussion
Here, we have investigated the effects of RS, OIS, accelerated and natural aging on the regulation of DNA replication. We found that entry into RS leads to lower replication fork elongation and dormant origin activation, both of which are hallmarks of replication stress. Although it was known that oncogene activation can lead to replication stress and senescence, our results demonstrate that replication stress in cells progressing into replicative pre-senescence is a characteristic of pre-senescent state rather than a consequence of oncogene activation.
This study also is the first to compare RT programs during cellular senescence induction, either by serial passaging or oncogene hyper-activation, with normal aging and surprisingly we found that the RT program is globally preserved during senescence-associated replicative stress. Dormant origin activation may be the mechanism that preserves the RT program when fork rates become reduced during replication stress.
Interestingly, we identified a unique genomic region with altered RT at the onset of senescence, containing the CREB5 gene (). CREB5 was previously identified as upregulated in a model of senescence bypass [Citation46,Citation70]. Moreover, CREB5 is part of a network of inflammatory response genes in nonagenarian and associated with a pro-inflammatory state [Citation70]. These observations suggest that CREB5 might be induced as response to stress in senescent cells.
Our findings also contradict the conclusions of a recent study suggesting that specific LADs change from late to early replication prior to chromatin repositioning during oncogene-induced cellular senescence [Citation36]. In our hands, progression into oncogene- and replicative senescence were actually associated with very few differences in RT, even using the same datasets and despite direct demonstration of replication stress ( and Supplementary Figure 1–4). This discrepancy is likely due to the fact that all the changes in RT detected by Chandra et al. that they used to reach their conclusions were below our threshold of significance relative to noise between replicate datasets. However, we cannot rule out that the small RT differences observed by Chandra et al. might have biological implications.
Among a select group of RT signatures corresponding to a small fraction of the genome (< 5%) that can distinguish fetal, post-natal, aged and HGPS fibroblasts, the genomic regions that replicated later in the cells from old donors contain downstream gene targets of the BMP/TGF-β pathway, while regions that replicated earlier are enriched in genes associated with cancer. The unique CREB5 locus changing with altered RT senescence does not change in RT during natural aging or in premature aging syndrome HGPS, which is consistent with the notion that cellular senescence and cellular aging are separate processes almost due to a non-cell autonomous process related to the deleterious effect of the senescence associated secretory phenotype on tissue microenvironment.
Experimental procedures
Cell culture
Human primary fibroblasts were maintained in Dulbecco’s Modified Eagle Medium (DMEM, Invitrogen) containing 10% heat-inactivated Fetal Bovine Serum (FBS, PAA), 2 mM L-Glutamine, 1% penicillin and streptomycin (all from Invitrogen). Cells from aged donor (74 yrs) were obtained from the Coriell Institute for Medical Research (NJ, USA) [Citation45]. H9 and H1 human embryonic stem cells were obtained from the WiCell Research Institute (WI, USA). Human ES cells were maintained on feeder-free culture on matrigel (BD Biosciences) with chemically defined mTeSR (Stemcell technologies) medium.
DNA combing
Asynchronous cells populations were labeled for 15 min with 20 µM IdU and for 30 min with 100 µM CldU and collected for DNA combing. DNA combing was performed as previously described [Citation71]. Briefly, cells were collected after CldU labelling and embedded in agarose plugs (about 1.5 × 10^5 cells/plugs). DNA was stained with YOYO-1 (Invitrogen), and resuspended in 50 mM MES (pH 5.7) after digestion of the plugs with agarose (Biolabs). DNA fibers were stretched on silanized coverslips. Combed DNA fibers were denatured for 30 min with 0.5N NaOH. IdU was detected with a mouse monoclonal antibody (BD44 Becton Dickinson; 1:20 dilution) and a secondary antibody coupled to Alexa 546 (A21123, Invitrogen, 1:50 dilution). CldU was detected with a rat monoclonal antibody (BU1/75, AbCys; 1:20 dilution) and a secondary antibody coupled to Alexa 488 (A11006, Invitrogen; 1:50 dilution). DNA was detected with an anti-ssDNA anti- body (MAB3034, Euromedex; 1:100 dilution) and anti-mouse IgG2a coupled to Alexa 647 (A21241, Invitrogen, 1:50 dilution). Then immunodetection of DNA fibers were analyzed on a Leica DM6000B microscope equipped with a CoolSNAP HQ CCD camera (Roper Scientifics). Data acquisition was performed with Meta-Morph (Universal Imaging). Statistical analysis was performed in Prism v5.0 (GraphPad) by unpaired t test. Inter-Origin Distance was measured as the distance between the centers of two consecutive origins and fork velocity was measured as, the distance of IdU per min, from IdU tracks that were flanked by DNA and CldU signals.
Isolation of short nascent strands at replication origins
We isolated short nascent strands at replication origins of asynchronous human cells as previously described [Citation41,Citation42]. For each cell type, we purified the short nascent strands of two biological replicates. For each sample, DNAzol (Invitrogen) was used to extract DNA of 100 × 10^6 asynchronous cells. Then DNA fragments of 1–2 kb were isolated after sucrose gradient separation (Sigma). Polynucleotide kinase (Biolabs) was used to phosphorylate the ends of the DNA fragments. After two treatments with lambda exonuclease (Fermentas), the quality of each purified short nascent strand preparation was tested by measuring enrichment of the Myc locus origin by real-time qPCR. Synthesis of second strands was performed with a bioprime DNA labeling system kit (Invitrogen) with standard dNTPs (Promega). For each biological sample, we performed this synthesis with the same amount of background DNA, which was calculated based on background around the replication origin at the Myc locus. Double-stranded short nascent strands were purified with QIAquick PCR Purification (Qiagen). To compare replication origins between different cells, samples with the same amount of background DNA were sequenced.
Short nascent strands sequencing
Next-generation sequencing of purified and sonicated short nascent strands was performed using Illumina sequencing-by-synthesis technology and instructions. Sequenced reads (36 bp) were obtained by single-end pairing aligned to the NCBI reference human genome (hg18).
Identification of short nascent strand–enriched peaks
We used the Sole-Search software (http://havoc.genomecenter.ucdavis.edu/cgi-bin/chipseq.cgi) to find positions of significant short nascent strand enrichment over the generic genomic reference provided by the software. We used the following parameters: chromatin fragment size of 200 bp, false discovery rate of 1 per 10,000, α of 0.001% and number of iterations = 5. We analyzed short nascent strand enrichment on the union set of sequenced reads for a given cell type for further analyses. The score associated with each identified origin peak showed the short nascent strand enrichment and may reflect the origin peaks’ efficiency.
Distribution of origin peaks
To identify clusters of origins, an origin peak was considered as a segment of 4 kb (2 times the largest length of purified short nascent strands), except the origin segments longer than 4 kb which were kept as long as they are. We used the tool cluster of the Galaxy platform to gather all the origin regions that overlapped. Then clusters were defined as zones containing origins whose centers are located at less than 4 kb. The length of a cluster corresponds to the distance between the edges of their extreme origin segments. To identify the regions deprived of identified origin peaks, we subtracted from the genome (non-annotated regions and deleted regions measured on the generic genome by Sole-Search were retrieved) the origin peaks identified with Sole-Search (total length) and retrieved the non-overlapping pieces of intervals in Galaxy platform. Finally, we calculated the length of these obtained regions and counted the number of regions with respect to their length, considering the regions with a length superior to 500 kb.
Genome-wide RT profiling
Genome-wide RT profiles were constructed as previously described [Citation43,Citation44]. Briefly, cells were pulse labeled with BrdU and separated into early and late S-phase fractions by flow cytometry and processed either by Repli-Chip or Repli-Seq. For Repli-Chip, BrdU-substituted DNA from early and late S-phase populations was immunoprecipitated, differentially labeled, and co-hybridized to a whole-genome oligonucleotide microarray. Microarray hybridization and data extraction were performed according to standard procedures recommended by NimbleGen. For Repli-Seq, sequencing libraries of BrdU-substituted DNA from early and late fractions were prepared by NEBNext Ultra DNA Library Prep Kit for Illumina (E7370). 50bp single end sequencing was performed on an Illumina-HiSeq 2500. Reads with quality scores above 30 were mapped to the Hg19 reference genome using Bowtie2. Approximately 7 million uniquely mapped reads were obtained from each library. Read counts were binned into 5kb non-overlapping windows, and log2 ratios of read-counts between early and late fractions were calculated. RT datasets were normalized using the limma package in R and re-scaled to equivalent ranges by quantile normalization. Correlation analysis was performed using the corrplot package in R.
Clustering analysis
Early and late replication was defined as when the RT log2 ratio change ≥ + 0.5 or ≤ – 0.5, respectively. Regions (and genes) were defined as being variable if they were replicated early in at least one sample and late in at least one other sample. Hierarchical and K-means clustering analysis were performed using Cluster 3.0 [Citation72]. Un-centered correlation metrics and average linkage were used for clustering. Heatmaps and dendrograms were generated in JavaTreeView [Citation73].
Supplemental Material
Download Zip (4.2 MB)Acknowledgments
We thank Ruth A. Didier for assistance with flow cytometry and Julian Venables and Armando Aranda-Anzaldo for critical reading of the manuscript. This work has been supported by French Ministery of Research, the CNRS, the “Région Languedoc Roussillon” la Ligue Nationale Contre le Cancer Grant “Programme Labellisation Equipe 2015 (EL2015.LNCC/JML) and for Ph.D. student Fellowship for EB and HS (to JML). This work was also supported by NIH Grants GM083337 and GM085354 (to D.M.G.). We acknowledge the French National infrastructure on Pluripotent Stem Cell INGESTEM National Infrastructure in Biology and Health and the SAFE-iPSC stem cell core Facility of IRMB and CHU of Montpellier.
Disclosure statement
No potential conflict of interest was reported by the authors.
Supplementary material
Supplemental data for this article can be accessed here.
Additional information
Notes on contributors
David M. Gilbert
Conception and design: JML and JCRM; cell culture:, HS, JCRM, RD and CTG; DNA combing and short nascent strand sequencing: EB; RT datasets: JCRM, CTG and JS; data analysis and interpretation: JCRM, RD, PB, AZ and JML; manuscript writing: JCRM, JML and DMG
Related Research Data
References
- Bolzer A, Kreth G, Solovei I, et al. Three-dimensional maps of all chromosomes in human male fibroblast nuclei and prometaphase rosettes. PLoS Biol. 2005;3:e157.
- Cremer T, Cremer M, Dietzel S, et al. Chromosome territories–a functional nuclear landscape. Curr Opin Cell Biol. 2006;18:307–316.
- Schoenfelder S, Sexton T, Chakalova L, et al. Preferential associations between co-regulated genes reveal a transcriptional interactome in erythroid cells. Nat Genet. 2010;42:53–61.
- Fritz AJ, Stojkovic B, Ding H, et al. Cell type specific alterations in interchromosomal networks across the cell cycle. PLoS Comput Biol. 2014;10:e1003857.
- Fudenberg G, Getz G, Meyerson M, et al. High order chromatin architecture shapes the landscape of chromosomal alterations in cancer. Nat Biotechnol. 2011;29:1109–1113.
- Ryba T, Battaglia D, Chang BH, et al. Abnormal developmental control of replication-timing domains in pediatric acute lymphoblastic leukemia. Genome Res. 2012;22:1833–1844.
- Rivera-Mulia JC, Desprat R, Trevilla-Garcia C, et al. DNA replication timing alterations identify common markers between distinct progeroid diseases. Proc Natl Acad Sci U S A. 2017;114:E10972–E80.
- Sasaki T, Rivera-Mulia JC, Vera D, et al. Stability of patient-specific features of altered DNA replication timing in xenografts of primary human acute lymphoblastic leukemia. Exp Hematol. 2017;51:71–82 e3.
- Adams PD. Remodeling of chromatin structure in senescent cells and its potential impact on tumor suppression and aging. Gene. 2007;397:84–93.
- Chandra T, Kirschner K, Thuret JY, et al. Independence of repressive histone marks and chromatin compaction during senescent heterochromatic layer formation. Mol Cell. 2012;47:203–214.
- Scaffidi P, Misteli T. Lamin A-dependent nuclear defects in human aging. Science. 2006;312:1059–1063.
- Aranda-Anzaldo A. A structural basis for cellular senescence. Aging. 2009;1:598–607.
- Dimri GP, Lee X, Basile G, et al. A biomarker that identifies senescent human cells in culture and in aging skin in vivo. Proc Natl Acad Sci U S A. 1995;92:9363–9367.
- Hayflick L. The limited in vitro lifetime of human diploid cell strains. Exp Cell Res. 1965;37:614–636.
- Hayflick L, Moorhead PS. The serial cultivation of human diploid cell strains. Exp Cell Res. 1961;25:585–621.
- Campisi J, d’Adda di Fagagna F. Cellular senescence: when bad things happen to good cells. Nat Rev Mol Cell Biol. 2007;8:729–740.
- Hayflick L. The illusion of cell immortality. Br J Cancer. 2000;83:841–846.
- Serrano M, Lin AW, McCurrach ME, et al. Oncogenic ras provokes premature cell senescence associated with accumulation of p53 and p16INK4a. Cell. 1997;88:593–602.
- Childs BG, Durik M, Baker DJ, et al. Cellular senescence in aging and age-related disease: from mechanisms to therapy. Nat Med. 2015;21:1424–1435.
- Krishnamurthy J, Torrice C, Ramsey MR, et al. Ink4a/Arf expression is a biomarker of aging. J Clin Invest. 2004;114:1299–1307.
- Lee BY, Han JA, Im JS, et al. Senescence-associated beta-galactosidase is lysosomal beta-galactosidase. Aging Cell. 2006;5:187–195.
- Lin AW, Barradas M, Stone JC, et al. Premature senescence involving p53 and p16 is activated in response to constitutive MEK/MAPK mitogenic signaling. Genes Dev. 1998;12:3008–3019.
- Narita M, Nunez S, Heard E, et al. Rb-mediated heterochromatin formation and silencing of E2F target genes during cellular senescence. Cell. 2003;113:703–716.
- Sherwood SW, Rush D, Ellsworth JL, et al. Defining cellular senescence in IMR-90 cells: a flow cytometric analysis. Proc Natl Acad Sci U S A. 1988;85:9086–9090.
- Zhou R, Han L, Li G, et al. Senescence delay and repression of p16INK4a by Lsh via recruitment of histone deacetylases in human diploid fibroblasts. Nucleic Acids Res. 2009;37:5183–5196.
- Coppe JP, Desprez PY, Krtolica A, et al. The senescence-associated secretory phenotype: the dark side of tumor suppression. Annu Rev Pathol. 2010;5:99–118.
- Rivera-Mulia JC, Gilbert DM. Replication timing and transcriptional control: beyond cause and effect-part III. Curr Opin Cell Biol. 2016;40:168–178.
- Lieberman-Aiden E, van Berkum NL, Williams L, et al. Comprehensive mapping of long-range interactions reveals folding principles of the human genome. Science. 2009;326:289–293.
- Pope BD, Ryba T, Dileep V, et al. Topologically associating domains are stable units of replication-timing regulation. Nature. 2014;515:402–405.
- Hiratani I, Ryba T, Itoh M, et al. Genome-wide dynamics of replication timing revealed by in vitro models of mouse embryogenesis. Genome Res. 2010;20:155–169.
- Rivera-Mulia JC, Buckley Q, Sasaki T, et al. Dynamic changes in replication timing and gene expression during lineage specification of human pluripotent stem cells. Genome Res. 2015;25:1091–1103.
- Bester AC, Roniger M, Oren YS, et al. Nucleotide deficiency promotes genomic instability in early stages of cancer development. Cell. 2011;145:435–446.
- Di Micco R, Fumagalli M, Cicalese A, et al. Oncogene-induced senescence is a DNA damage response triggered by DNA hyper-replication. Nature. 2006;444:638–642.
- Rivera-Mulia JC, Gilbert DM. Replicating large genomes: divide and conquer. Mol Cell. 2016;62:756–765.
- McCord RP, Nazario-Toole A, Zhang H, et al. Correlated alterations in genome organization, histone methylation, and DNA-lamin A/C interactions in Hutchinson-Gilford progeria syndrome. Genome Res. 2013;23:260–269.
- Chandra T, Ewels PA, Schoenfelder S, et al. Global reorganization of the nuclear landscape in senescent cells. Cell Rep. 2015;10:471–483.
- Flach J, Bakker ST, Mohrin M, et al. Replication stress is a potent driver of functional decline in ageing haematopoietic stem cells. Nature. 2014;512:198–202.
- Alvarez S, Diaz M, Flach J, et al. Replication stress caused by low MCM expression limits fetal erythropoiesis and hematopoietic stem cell functionality. Nat Commun. 2015;6:8548.
- Alver RC, Chadha GS, Blow JJ. The contribution of dormant origins to genome stability: from cell biology to human genetics. DNA Repair. 2014;19:182–189.
- McIntosh D, Blow JJ. Dormant origins, the licensing checkpoint, and the response to replicative stresses. Cold Spring Harb Perspect Biol. 2012;4:a012955-a012955.
- Besnard E, Babled A, Lapasset L, et al. Unraveling cell type-specific and reprogrammable human replication origin signatures associated with G-quadruplex consensus motifs. Nat Struct Mol Biol. 2012;19:837–844.
- Besnard E, Desprat R, Ryan M, et al. Best practices for mapping replication origins in eukaryotic chromosomes. Curr Protoc Cell Biol. 2014;64:22 18 1–3.
- Hiratani I, Ryba T, Itoh M, et al. Global reorganization of replication domains during embryonic stem cell differentiation. PLoS Biol. 2008;6:e245.
- Ryba T, Battaglia D, Pope BD, et al. Genome-scale analysis of replication timing: from bench to bioinformatics. Nat Protoc. 2011;6:870–895.
- Lapasset L, Milhavet O, Prieur A, et al. Rejuvenating senescent and centenarian human cells by reprogramming through the pluripotent state. Genes Dev. 2011;25:2248–2253.
- Collado M, Gil J, Efeyan A, et al. Tumour biology: senescence in premalignant tumours. Nature. 2005;436:642.
- Wilkes MC, Murphy SJ, Garamszegi N, et al. Cell-type-specific activation of PAK2 by transforming growth factor beta independent of Smad2 and Smad3. Mol Cell Biol. 2003;23:8878–8889.
- Siegel PM, Massague J. Cytostatic and apoptotic actions of TGF-beta in homeostasis and cancer. Nat Rev Cancer. 2003;3:807–821.
- Horowitz JC, Lee DY, Waghray M, et al. Activation of the pro-survival phosphatidylinositol 3-kinase/AKT pathway by transforming growth factor-beta1 in mesenchymal cells is mediated by p38 MAPK-dependent induction of an autocrine growth factor. J Biol Chem. 2004;279:1359–1367.
- Gordon KJ, Blobe GC. Role of transforming growth factor-beta superfamily signaling pathways in human disease. Biochim Biophys Acta. 2008;1782:197–228.
- Lorenzini A, Tresini M, Austad SN, et al. Cellular replicative capacity correlates primarily with species body mass not longevity. Mech Ageing Dev. 2005;126:1130–1133.
- Patil CK, Mian IS, Campisi J. The thorny path linking cellular senescence to organismal aging. Mech Ageing Dev. 2005;126:1040–1045.
- Choi J, Costa ML, Mermelstein CS, et al. MyoD converts primary dermal fibroblasts, chondroblasts, smooth muscle, and retinal pigmented epithelial cells into striated mononucleated myoblasts and multinucleated myotubes. Proc Natl Acad Sci U S A. 1990;87:7988–7992.
- Salvatori G, Lattanzi L, Coletta M, et al. Myogenic conversion of mammalian fibroblasts induced by differentiating muscle cells. J Cell Sci. 1995;108(Pt 8):2733–2739.
- Wise CJ, Watt DJ, Jones GE. Conversion of dermal fibroblasts to a myogenic lineage is induced by a soluble factor derived from myoblasts. J Cell Biochem. 1996;61:363–374.
- Rao N, Evans S, Stewart D, et al. Fibroblasts influence muscle progenitor differentiation and alignment in contact independent and dependent manners in organized co-culture devices. Biomed Microdevices. 2013;15:161–169.
- Cho JH, Saini DK, Karunarathne WK, et al. Alteration of Golgi structure in senescent cells and its regulation by a G protein gamma subunit. Cell Signal. 2011;23:785–793.
- Chen CY, Chi YH, Mutalif RA, et al. Accumulation of the inner nuclear envelope protein Sun1 is pathogenic in progeric and dystrophic laminopathies. Cell. 2012;149:565–577.
- Chen ZJ, Wang WP, Chen YC, et al. Dysregulated interactions between lamin A and SUN1 induce abnormalities in the nuclear envelope and endoplasmic reticulum in progeric laminopathies. J Cell Sci. 2014;127:1792–1804.
- Armstrong LC, Saenz AJ, Bornstein P. Metaxin 1 interacts with metaxin 2, a novel related protein associated with the mammalian mitochondrial outer membrane. J Cell Biochem. 1999;74:11–22.
- Hoogenraad NJ, Ward LA, Ryan MT. Import and assembly of proteins into mitochondria of mammalian cells. Biochim Biophys Acta. 2002;1592:97–105.
- Passos JF, Saretzki G, Ahmed S, et al. Mitochondrial dysfunction accounts for the stochastic heterogeneity in telomere-dependent senescence. PLoS Biol. 2007;5:e110.
- Moiseeva O, Bourdeau V, Roux A, et al. Mitochondrial dysfunction contributes to oncogene-induced senescence. Mol Cell Biol. 2009;29:4495–4507.
- Abdul KM, Terada K, Yano M, et al. Functional analysis of human metaxin in mitochondrial protein import in cultured cells and its relationship with the Tom complex. Biochem Biophys Res Commun. 2000;276:1028–1034.
- Joseph AM, Adhihetty PJ, Wawrzyniak NR, et al. Dysregulation of mitochondrial quality control processes contribute to sarcopenia in a mouse model of premature aging. PLoS One. 2013;8:e69327.
- Bridger JM, Foeger N, Kill IR, et al. The nuclear lamina. Both a structural framework and a platform for genome organization. FEBS J. 2007;274:1354–1361.
- Goldman RD, Shumaker DK, Erdos MR, et al. Accumulation of mutant lamin A causes progressive changes in nuclear architecture in Hutchinson-Gilford progeria syndrome. Proc Natl Acad Sci U S A. 2004;101:8963–8968.
- Guelen L, Pagie L, Brasset E, et al. Domain organization of human chromosomes revealed by mapping of nuclear lamina interactions. Nature. 2008;453:948–951.
- Sadaie M, Salama R, Carroll T, et al. Redistribution of the Lamin B1 genomic binding profile affects rearrangement of heterochromatic domains and SAHF formation during senescence. Genes Dev. 2013;27:1800–1808.
- Nevalainen T, Kananen L, Marttila S, et al. Transcriptomic and epigenetic analyses reveal a gender difference in aging-associated inflammation: the Vitality 90+ study. Age. 2015;37:9814.
- Prieur A, Besnard E, Babled A, et al. p53 and p16(INK4A) independent induction of senescence by chromatin-dependent alteration of S-phase progression. Nat Commun. 2011;2:473.
- de Hoon MJ, Imoto S, Nolan J, et al. Open source clustering software. Bioinformatics. 2004;20:1453–1454.
- Saldanha AJ. Java Treeview–extensible visualization of microarray data. Bioinformatics. 2004;20:3246–3248.
- McLean CY, Bristor D, Hiller M, et al. GREAT improves functional interpretation of cis-regulatory regions. Nat Biotechnol. 2010;28:495–501.
- Sandve GK, Gundersen S, Rydbeck H, et al. The genomic hyperbrowser: inferential genomics at the sequence level. Genome Biol. 2010;11:R121.