
ABSTRACT
Human pluripotent stem cells (hPSCs), including embryonic and induced pluripotent stem cells (hESCs and hiPSCs) show unique cell cycle characteristics, such as a short doubling time due to an abbreviated G1 phase. Whether or not the core cell cycle machinery directly regulates the stemness and/or the differentiation potential of hPSCs remains to be determined. To date, several scenarios describing the atypical cell cycle of hPSCs have been suggested, and therefore there is still controversy over how cyclins, master regulators of the cell cycle, are expressed and regulated. Furthermore, the cell cycle profile and the expression pattern of major cyclins in hESCs-derived neuroprogenitors (NP) have not been studied yet. Therefore, herein we characterized the expression pattern of major cyclins in hPSCs and NP. We determined that all studied cyclins mRNA expression levels fluctuate along cell cycle. Particularly, after a thorough analysis of synchronized cell populations, we observed that cyclin E1 mRNA levels increased sharply in G1/S concomitantly with cyclin E1 protein accumulation in hPSCs and NP. Additionally, we demonstrated that cyclin E1 mRNA expression levels involves the activation of MEK/ERK pathway and the transcription factors c-Myc and E2Fs in hPSCs. Lastly, our results reveal that proteasome mediates the marked down-regulation (degradation) of cyclin E1 protein observed in G2/M by a mechanism that requires a functional CDK2 but not GSK3β activity.
Abbreviations: hPSCs: human pluripotent stem cells; hESCs: human embryonic stem cells; hiPSCs: human induced pluripotent stem cells; NP: neuroprogenitors; HF: human foreskin fibroblasts; MEFs: mouse embryonic fibroblasts; iMEFs: irradiated mouse embryonic fibroblasts; CDKs: cyclindependent kinases; CKIs: CDK inhibitors; CNS: central nervous system; Oct-4: Octamer-4; EB: embryoid body; AFP: Alpha-fetoprotein; cTnT: Cardiac Troponin T; MAP-2: microtubule-associated protein; TUJ-1: neuron-specific class III β-tubulin; bFGF: basic fibroblastic growth factor; PI3K: Phosphoinositide 3-kinase; KSR: knock out serum replacement; CM: iMEF conditioned medium; E8: Essential E8 medium
Introduction
Human pluripotent stem cells (hPSCs), generated from embryo at the blastocyst stage (embryonic stem cells or hESCs) or from reprogrammed somatic cells (induced pluripotent stem cells or hiPSCs), are self-renewing cells that can potentially be a source for regenerative medicine as they can be differentiated into a wide range of specialized cells. Currently, they are being increasingly used as in vitro models for human development studies, disease modeling and drug discovery [Citation1,Citation2].
The ability of hPSCs to maintain their self-renewal and pluripotency is associated with their capacity to remain in a proliferative condition [Citation3,Citation4]. To achieve this, hPSCs are endowed with an atypical cell cycle which lacks fully formed G1 and G2 gap phases and in which a high proportion of time (60%) is devoted to DNA replication (S phase). While there are exceptions, hPSCs generally have short generation times of 8–16 hours [Citation5–Citation7]. Importantly, when hESCs initiate a differentiation process, cells accumulate in the G1 phase and lengthen their cell cycle (more than 16 hours) [Citation8]. A short G1 phase limits the time in which hPSCs can be influenced by external differentiation signals, as this phase represents the time with increased sensitivity to differentiation cues [Citation9,Citation10]. Moreover, it has been demonstrated that inhibiting progression of the G1 phase commits hESCs differentiation [Citation11,Citation12].
The transition from one cell cycle phase to another is governed by key regulators called cyclin-dependent kinases (CDKs), a family of serine/threonine protein kinases which are activated at specific points during cell cycle and whose actions are dependent on their associations with regulatory subunits, named cyclins [Citation13,Citation14]. The levels of cyclins in different stages of the cell cycle differ, whereas the CDK protein levels remain stable [Citation14]. In particular, somatic cells cycle progression from G1 to S phases depends in part of the fine regulation of the activity of the complexes formed by the catalytic subunits CDK2, CDK4 and CDK6, whose expression levels remain constant, and the regulatory subunits, D-type (D1, D2 and D3) and E cyclins, whose expression levels oscillate during the cell cycle [Citation15]. The activities of the cyclin/CDK complexes are counteracted by the action of small polypeptides, the CDK inhibitors (CKIs) [Citation16,Citation17]. However, in murine embryonic stem cells (mESCs) most cyclins and CDKs are expressed throughout the cell cycle. High levels of CDKs activities in mESCs are due in part to the absence or low expression of CKIs, which in turn are linked to the high levels of cyclins that remain present during the cell cycle [Citation18].
At present, to the best of our knowledge there is only a limited amount of information referred to cell cycle regulation in hPSCs and most of it relies on hESCs. Although, under certain circumstances, these cells exhibit a cell cycle similar to mESCs [Citation18], differences in cell cycle control between hESCs and mESCs are evident, and have encouraged several groups to study the expression profiles of key cell cycle regulators in hESCs [Citation19]. In particular, and in contrast to mESCs, most cell cycle regulators in hESCs exhibit a phase-specific expression [Citation20]. However, there are discrepancies between results from different research groups regarding the abundance and periodic or constitutive expression of some cyclins during hESCs cell cycle [Citation3,Citation5,Citation9,Citation20–Citation23]. Besides, there is not much knowledge about how cyclins are expressed or regulated in hiPSCs [Citation6].
In addition, studies related to the development of the central nervous system (CNS) were until recently limited by the lack of experimental models capable of accurately reproducing the sequence of molecular and cellular events that are triggered along it. In this sense, the generation of neuroprogenitors (NP) from hPSCs allowed us to count on very valuable tools for the study of the biological processes underlying CNS development.
Throughout embryonic development cells must proliferate until reaching an appropriate number, and then they initiate differentiation with a concomitant change in cell cycle. The precise moment in which a cell changes the cell cycle pattern and initiates its differentiation is critical, since it directly impacts both the total number and the type of cell that is generated. To date, the way in which proliferation and differentiation processes are coordinated during the early stages of CNS development has not been fully elucidated. On this sense, little is still known about how cyclins are expressed or regulated in hPSCs-derived NP, and whether they show specific regulation or are regulated as in somatic cells or as in hPSCs.
Taking these considerations into account, the present work was undertaken to evaluate the expression of cyclins in hESCs, hiPSCs and in hESC-derived neural progeny. Interestingly, we found that D-type cyclins are expressed in higher levels in NP and human foreskin fibroblasts (HF) than in hPSCs and that cyclins E1, A2 and B1 are highly expressed in hPSCs. Besides, we determined that all cyclins mRNAs were periodically expressed. In particular, cyclin E1 mRNA and protein expression levels peaked in G1/S in hPSCs and NP and its protein levels were down-regulated in G2/M. Moreover, we observed that MEK/ERK1/2 signaling, c-Myc and E2Fs may be involved, at least in part, in the regulation of cyclin E1 mRNA expression levels in hPSCs. Finally, we demonstrated that proteasome-mediated degradation of cyclin E1 in G2/M in hPSCs and NP requires CDK2 activity but not GSK3β signaling.
Results
Comparison of mRNAs and protein expression levels of cyclins in hPSCs, NP and HF
We first validated the pluripotent nature of hPSCs [WA09 (H9) hESCs and FN2.1 hiPSCs] grown on Geltrex coated culture dishes with CM. H9 and FN2.1 cells exhibited robust expression of stem cells associated markers, such as nuclear located transcription factors Octamer 4 (Oct-4) and Nanog, and no expression of the mesenchymal associated marker Vimentin (Supplementary Figure 1a). No areas of lack of expression of stemness markers were detected. In contrast, HF did not express Oct-4 and Nanog but were positive for Vimentin (Supplementary Figure 1a). Moreover, tested cell lines also expressed significant high levels of stemness associated transcripts, quantified by RT-Real time PCR, such as oct-4 and nanog, compared to HF (Supplementary Figure 1b). Besides, hPSCs responded to an embryoid body (EB)-based differentiation protocol. In fact, on day 14 of the differentiation protocol we observed formation of neuroectoderm, endoderm and mesoderm (cardiac contractile regions), positively stained for Nestin, Alpha-fetoprotein (AFP) and cardiac Troponin T (cTnT), respectively (Supplementary Figure 1d). These results confirm the maintenance of hPSCs pluripotent characteristics under the experimental conditions used. Next, we determined that H9 hESCs-derived NP expressed the neural progenitor marker Nestin and did not express Oct-4 and Nanog (Supplementary Figure 1c). These NP further differentiate into process-bearing neuronal-like cells that stain positively for microtubule-associated protein MAP-2 and neuron-specific class Ⅲ β-tubulin (TUJ-1) (Supplementary Figure 1e).
As previously mentioned hPSCs present an atypical cell cycle regulation which differs from the canonical one exhibited by somatic cells. hPSCs cell cycle is characterized mainly by cells residing mostly in S phase, a shortened G1 phase and absence of G1/S checkpoints. In this sense, there are still controversies regarding the expression pattern of key cell cycle regulators like cyclins in human pluripotent cells.
Given the differences between the percentages of cells residing in each cell cycle phase at any given time, and because in somatic cells like HF cyclins are periodically expressed, herein we performed experiments with both asynchronously proliferating and pharmacologically arrested cells.
To accomplish this, we first arrested H9 hESCs, FN2.1 hiPSCs (both grown on Geltrex coated dishes with CM), hESCs-derived NP and HF cells in G1 and G2/M phases using two pharmacological inhibitors: PD0332991 (PD) to arrest cells in early G1 phase and Nocodazole (NOCO) to arrest cells in G2/M phase. To determine the drugs effect on the cell cycle we quantified DNA content by PI staining followed by flow cytometry analysis. As expected, we observed that asynchronously growing hESCs and hiPSCs contain a higher percentage of cells in the S phase (41.73 ± 8.3% and 34.03 ± 5.71, respectively) than NP and HF (13.6 ± 7.1% and 12.1 ± 2.6%, respectively) (). The strong resemblance between the cell cycle profiles of NP and HF suggests that as hPSCs undergo lineage commitment, proliferation rates decreases and organization of the cell cycle changes by extending the length of G1.
Next, we analyzed the effect of PD and NOCO on the distribution of cells within the different cell cycle phases in hESCs, hiPSCs, NP and HF cells, which possess different cell cycle profiles. In all tested cell types, PD treatment led to a marked increase in the number of cells in the G1 phase and caused a decrease of cells in G2 phase. On the other hand, after NOCO exposure, most of the cells were in the G2/M phase ()).
Figure 1. Comparison of mRNAs expression levels for cyclins in synchronous hPSCs, NP and HF. (a) Human fibroblasts (HF), hiPSCs (FN2.1), hESCs (H9) and NP derived from H9 cells were arrested in G1 with PD0332991 (PD) (48 h 1 μM for HF, 30 h 5 μM for hPSC and 24 h 1 μM for NP) and in G2/M with Nocodazole (NOCO) (72 h 200 ng/ml for HF, 24 h 100 ng/ml for hPSC and 54 h 200 ng/ml for NP). Cell cycle profile of asynchronous and pharmacologically arrested cells was analyzed after cells were fixed with cold 70% ethanol. DNA content was measured with propidium iodide (PI) and its fluorescence was determined with a flow cytometer. A representative DNA content frequency histogram plot is shown for each condition. The percentage of cells in each cell cycle phase was calculated by the FlowJo v10.0.7’s univariate platform. N = 3. (b) Heat maps representing mRNA expression levels quantified by RT-qPCR of cyclins D1, D2, D3, E1, A2 and B1 in HF, FN2.1, H9 and NP cells arrested with in G1 with PD or in G2/M with NOCO following the same experimental conditions described in (a). rpl7 expression was used as normalizer. The mRNA fold induction is relative to HF control cells (synchronous cells) arbitrarily set as 1. N = 5. Results are shown as a heat map generated with the software CIMminer.
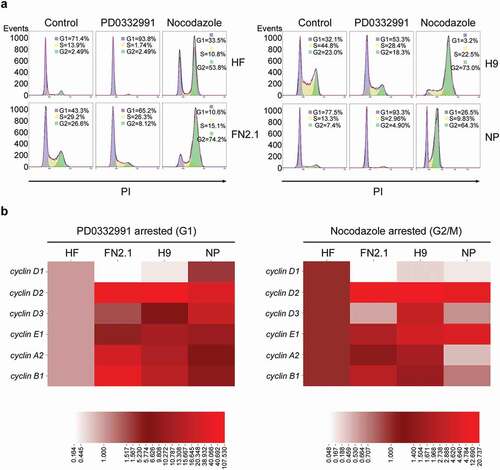
Once established the experimental conditions, we sought to accurately determine the relative abundance of cyclins mRNAs in the different cell types, ensuring that the observed results were not due to the existing differences between the percentages of cells residing in the different phases of the cell cycle in each cell type. To this end, we analyzed the mRNAs expression levels of the most relevant cyclins (A2, B1, D1, D2, D3 and E1) by RT-qPCR in PD- and NOCO-treated cell types (hESCs, hiPSCs, NP and HF). Next, we compared individual cyclin mRNA expression levels among cell types arrested either with PD or with NOCO and expressed the values relative to those of HF to have as reference a somatic cell type (), heat map). Importantly, we found that most cyclins mRNAs expression levels were higher in hPSCs arrested both in G1 and in G2/M than in HF. However, a remarkable exception to this was cyclin D1 whose expression levels were significantly much lower in hPSCs. In contrast, in NP we observed a cyclins mRNA expression profile which in general terms results intermediate between HF and the hESCs line (H9) from which they were derived. Nevertheless, it is worth noting that in the case of NP cyclin D1 mRNA expression levels were nearer to the ones displayed by HF in G1 arrested cells, and that cyclin E1 transcripts were expressed to a similar extent in NP and in H9, being much higher than those determined in HF (heat map on ) and Supplementary Figure 2).
We next studied if there was a correlation between cyclins mRNA and protein expression levels among the different cell types. To this end, we analyzed the protein expression levels of the most relevant cyclins A, B1, D1, D2 and E1 by Western blot both in asynchronously proliferating hESCs, hiPSCs, NP and HF and in PD-arrested cells (). Comparison of cyclins expression levels under each experimental condition (asynchronously growing or PD-arrested) revealed that in both conditions cyclins E1, A and B1 showed a significantly higher expression in hPSCs (H9 and FN2.1) than in HF and NP. Again, protein expression levels of these cyclins in NP resulted intermediate between HF and the hESCs (H9) from which they were derived ()). However, D-type cyclins protein products were, with the exception of cyclin D2 in asynchronous NP, significantly higher in HF and NP than in hPSCs as previously observed in the case of cyclin D1 mRNA ( and )). Interestingly, NP presented a significantly higher cyclin D1 and D2 protein expression levels than HF in PD-arrested cells ()).
Figure 2. Comparison of protein expression levels for cyclins in asynchronously proliferating and G1 arrested hPSCs, NP and HF cells. Expression levels of cyclins D1, D2, E1, A and B1 were analyzed by Western blot in HF, FN2.1 (hiPSCs), H9 (hESCs) and NP cells asynchronously growing (Asynchronous) (a) or arrested in G1 with PD0332991 (PD) (1 µΜ for 48 h for HF, 5 μM for 30h for hPSCs and 1 μM for 24h for NP) (b). Actin was used as loading control. Mean + SEM fold induction relative to HF and representative blots of three independent experiments are shown. (*) p < 0.05, (**) p < 0.01 and (***) p < 0.001 vs. HF; (&) p < 0.05, (&&) p < 0.01 and (&&&) p < 0.001 vs. H9.
Changes in cyclins mRNA expression levels throughout hPSCs, NP and HF cell cycle progression
Next, in order to determine whether the aforementioned cyclins mRNAs (A2, B1, D1, D2, D3 and E1) are periodically or constitutively expressed throughout the different stages of the cell cycle, we analyzed and compared their expression levels by RT-qPCR in hESCs, hiPSCs, NP and HF asynchronously growing or arrested in G1 or G2/M phases owing to the presence of PD or NOCO, respectively ().
In the case of hPSCs (hESCs and hiPSCs) we observed that the expression levels of cyclins A2 and B1 transcripts were lower in G1-arrested cells and similar (cyclin A2) or higher (cyclin B1) in G2/M-arrested cells when compared to asynchronously proliferating cells (). Thus, we determined that mRNA expression levels of cyclins A2 and B1 were significantly higher in G2/M than in G1 stage. On the other hand, a different behavior was observed in D-type cyclins (D1, D2 and D3) mRNAs expression levels, which in general were higher in G1-arrested cells than in G2/M-arrested counterparts. Interestingly, we found no significant differences in cyclin E1 mRNA expression levels among asynchronous or early G1 or G2/M-arrested cells. Besides, hESC-derived-NP () exhibited a similar temporal expression profile to that of parental H9 cells for the case of cyclins A2, B1, D2, D3 (same pattern but more abundant expression in PD-arrested NP) and E1; not being the case for cyclin D1 mRNA expression levels which markedly diminished in G2/M. Finally, as expected we determined that cyclins mRNAs were periodically expressed in HF.
Figure 3. Changes in cyclins mRNA expression levels throughout hPSCs, NP and HF cell cycle progression. Analysis of mRNA expression level changes of cyclins A2, B1, D1, D2, D3 and E1 quantified by RT-qPCR in asynchronous or synchronous G1 (PD arrested) or G2/M (NOCO arrested) HF, FN2.1, H9 and NP cells. rpl7 expression was used as normalizer. Graphs show mean + SEM mRNA fold induction relative to asynchronous control cells, arbitrarily set as 1. N = 5, (*) p < 0.05, (**) p < 0.01 and (***) p < 0.001 vs. Control (asynchronous cells).
At this point of our investigation, experiments allowed us to conclude that even though the relative expression levels of the vast majority of cyclins mRNAs in pluripotent and progenitor cells significantly differ among cell types, they are periodically expressed except for cyclin E1 mRNA whose expression seems to be constitutive.
Regulation of cyclin E1 mRNA expression levels throughout cell cycle progression in hPSCs cultured with a fully defined medium
We next studied if cyclin E1 mRNA regulation throughout hPSCs cell cycle relies on cell culture conditions. As iMEF-CM and Geltrex contain multiple components that are not completely defined, including Knockout Serum Replacement and factors released by MEFs, we decided to culture hPSCs with a fully defined medium like Essential 8 (E8) on Vitronectin coated dishes. First we determined under these experimental conditions, by immunofluorescence, RT-qPCR and flow cytometry, a robust expression of stem cells associated markers Oct-4 and Nanog in hPSCs (Supplementary figure 3a, b and c). Moreover, hPSCs grown on Vitronectin coated dishes with E8 medium were effectively arrested in G1 and G2/M with PD and NOCO, respectively (Supplementary Figure 3c). Importantly, differentiation of PD-arrested cells was not induced under this experimental condition according to pluripotency (oct-4 and nanog) and early differentiation (brachyury, alpha-fetoprotein and nestin) markers mRNA expression levels quantified by RT-qPCR (Supplementary figure 4a and b). Then, in order to determine whether cyclin E1 mRNA is periodically or constitutively expressed throughout the different stages of the cell cycle when hPSCs are grown and maintained in E8 medium, we analyzed its expression levels by RT-qPCR in hESCs and hiPSCs asynchronously growing or arrested in G1 or G2/M phases owing to the presence of PD or NOCO, respectively. Again, we found no significant differences in cyclin E1 mRNA expression levels among asynchronous or early G1 or G2/M-arrested cells ().
Cyclin E1 mRNA expression levels are regulated by MEK/ERK, c-Myc and E2Fs in hPSCs
Basic Fibroblastic Growth Factor (bFGF) is a key component of all hPSCs cell culture media, including E8, as it is essential for the maintenance of hPSC stemness, self-renewal, viability and proliferation [Citation24,Citation25]. Interaction of bFGF with their signaling receptors causes the phosphorylation of specific tyrosine residues that mediate interaction with cytosolic adaptor proteins and activation of the Phosphoinositide 3-kinase (PI3K)/AKT and MEK/ERK1/2 signaling cascades, among others. In particular, PI3K/AKT and MEK/ERK1/2 transduction pathways are known to be activated by bFGF in hPSCs and have been shown to be important in cell-cycle, survival, proliferation and pluripotency regulation of these cells [Citation26–Citation28]. In order to test whether PI3K/AKT and/or MEK/ERK1/2 might be involved in cyclin E1 mRNA regulation in hPSCs, we analyzed cyclin E1 mRNA levels by RT-qPCR in asynchronous hESCs (H9) and hiPSCs (FN2.1) maintained in E8 medium after pharmacological inhibition of AKT (GSK690693, 10µM) or MEK (U0126, 20µM) for 24 hours. We observed a significant decrease in cyclin E1 mRNA levels, in both H9 and FN2.1 cells, only when MEK/ERK signaling pathway was inhibited with U0126 (0.74 ± 0.04 and 0.30 ± 0.02 fold induction vs. Vehicle for H9 and FN2.1, respectively) ()). Importantly, the efficacy of AKT inhibition by GSK690693 in hPSCs was recently confirmed in our lab [Citation28].
Figure 4. Changes in cyclin E1 mRNA expression level throughout hPSCs (grown in defined medium) cell cycle progression and in asynchronous cells after PI3K/AKT, MEK/ERK, c-Myc and E2Fs inhibition. Analysis of mRNA expression levels of cyclin E1 quantified by RT-qPCR in: (a) asynchronous or synchronous G1 (PD arrested, 5μM for 30h) or G2/M (NOCO arrested, 100 ng/ml for 24 h) FN2.1 and H9 hPSCs grown and maintained in fully defined conditions (Vitronectin coated dishes and E8 medium); (b) asynchronous FN2.1 and H9 hPSCs grown with E8 medium at 24 hours post AKT, MEK1/2 and c-Myc inhibition with GSK690693 (10 µM), U0126 (20 µM) and 10,058-F4 (100 µM), respectively; and (c) asynchronous FN2.1 and H9 hPSCs grown with E8 medium during 7 days in the presence of the pan-E2Fs inhibitor HLM006474 (40 µM). rpl7 expression was used as normalizer in all cases. Graphs show mean + SEM mRNA fold induction relative to asynchronous or Vehicle (DMSO treated) control cells (arbitrarily set as 1) of at least three independent experiments. (*) p < 0.05, (**) p < 0.01 and (***) p < 0.001 vs. Control or Vehicle.
Besides, c-Myc transcription factor has been reported as an enhancer for reprogramming and also as having an important role in stemness regulation [Citation29–Citation32]. Moreover, cyclin E1 has been identified as a transcriptional target of c-Myc in pluripotent stem cells and other cell types [Citation33,Citation34]. Therefore, we tested if pharmacological inhibition of c-Myc with 10,058-F4 (100µM for 24 hours) affects cyclin E1 mRNA expression levels. Indeed, a significant decrease in cyclin E1 mRNA levels, in both H9 and FN2.1 cells, was found upon c-Myc inhibition (0.77 ± 0.02 and 0.28 ± 0.03 fold induction vs. Vehicle for H9 and FN2.1, respectively) ()).
On other hand, as occurs in many other cell types, we wondered whether cyclin E1 mRNA levels may be induced by E2F family of transcription factors, particularly E2F1, in hPSCs [Citation35,Citation36]. Thus, in order to test if E2Fs are mediating cyclin E1 mRNA expression levels, we quantified cyclin E1 mRNA levels by RT-qPCR in asynchronous hESCs (H9) and hiPSCs (FN2.1) maintained in E8 medium after 7 days treatment with the pan-E2Fs inhibitor HLM006474 (40µM). Notably, under these experimental conditions, we found a significant decrease in cyclin E1 mRNA levels in both H9 and FN2.1 cells (0.62 ± 0.05 and 0.64 ± 0.04 fold induction vs. Vehicle for H9 and FN2.1, respectively) ()).
Taken together, the above results suggest that MEK/ERK, c-Myc and E2Fs may modulate cyclin E1 mRNA expression levels in hPSCs. Importantly, hPSCs stemness was not affected upon pharmacological inhibitors treatment (GSK690693, U0126, 10,058-F4 and HLM006474) as no significant change in stemness markers (oct-4 and nanog) mRNA expression levels (quantified by RT-qPCR) was observed (Supplementary figure 4c). Moreover, we confirmed that differentiation of hPSCs treated with U0126, 10,058-F4 and HLM006474 inhibitors was not induced as judged by early differentiation (brachyury, alpha-fetoprotein and nestin) markers mRNA expression levels quantified by RT-qPCR (Supplementary Figure 4b).
Cyclin E1 mRNA expression levels peak in G1/S boundary
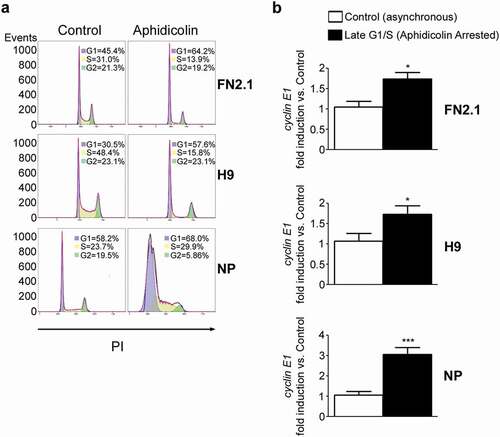
It is well established that in somatic cells cyclin E1 expression increases through the G1 phase of the cell cycle and peaks near the G1/S boundary. Taken this into account, and considering that PD causes cell cycle arrest in early G1 stage, we asked whether in our experiments we were omitting the time window in which cyclin E reaches its highest expression level. To find the answer, we use a different inhibitor to arrest cells in late G1 or G1/S boundary. Thus, we arrested H9 hESCs, FN2.1 hiPSCs (both grown on Vitronectin coated dishes with E8) and NP in G1/S boundary with Aphidicolin (). After establishing the optimal experimental conditions, we analyzed cyclin E1 mRNA expression levels by RT-qPCR in hESCs, hiPSCs and NP asynchronously growing or arrested in G1/S boundary owing to the presence of Aphidicolin. Notably, we observed a significant up-regulation in cyclin E1 mRNA expression levels in G1/S boundary-arrested cells (1.73 ± 0.16; 1.72 ± 0.20 and 3.05 ± 0.34 fold induction vs. Vehicle for FN2.1, H9 and NP, respectively) ()). Besides, differentiation of Aphidicolin-arrested (G1/S boundary) cells was not induced (Supplementary figure 4a and b). Importantly, using this experimental approach we determined that cyclin E1 mRNA is also periodically expressed along hPSCs and NP cell cycle.
Figure 5. Regulation of cyclin E1 mRNA expression levels in G1/S boundary. (a) hiPSCs (FN2.1), hESCs (H9) (both grown with E8 medium) and NP derived from H9 cells were arrested in G1/S boundary with Aphidicolin (10 μg/ml for 20 h hPSCs and 10μg/ml for 48h for NP). Cell cycle profile of asynchronous and pharmacologically arrested cells was analyzed after cells were fixed with cold 70% ethanol. DNA content was measured with propidium iodide (PI) and its fluorescence was determined with a flow cytometer. A representative DNA content frequency histogram plot is shown for each condition. The percentage of cells in each cell cycle phase was calculated by the FlowJo v10.0.7’s univariate platform. N = 3. (b) Analysis of mRNA expression levels of cyclin E1 quantified by RT-qPCR in asynchronous or synchronous G1/S (Aphidicolin) FN2.1 and H9 hPSCs (both grown and maintained in Vitronectin coated dishes and E8 medium) and NP. rpl7 expression was used as normalizer. Graphs show mean + SEM mRNA fold induction relative to asynchronous control cells (arbitrarily set as 1) of at least three independent experiments. (*) p < 0.05 and (***) p < 0.001 vs. Control (asynchronous cells).
Changes in cyclin E1 protein expression levels throughout hPSCs and NP cell cycle progression
In view of the previously described cyclin E1 mRNA regulation in hPSCs and NP, we wondered whether the corresponding protein levels also fluctuate throughout the cell cycle. To this end, cyclin E1 protein levels were quantified by Western blot in asynchronous, G1- (PD treatment) and G2/M- (NOCO treatment) arrested H9 hESCs, FN2.1 hiPSCs (both grown on Geltrex coated dishes with CM) and NP cells. As occurred with mRNA regulation (), no significant changes in cyclin E1 protein expression levels were observed between asynchronous and PD-arrested cells. However, a significant reduction in the abundance of cyclin E1 protein was evident in G2/M-arrested cells with NOCO (0.36 ± 0.09; 0.35 ± 0.08 and 0.43 ± 0.08 fold induction vs. Control for FN2.1, H9 and NP, respectively) ().
Again, in order to discard that cyclin E1 protein regulation throughout hPSCs cell cycle could depend on cell culture conditions, above experiments were repeated in H9 hESCs and FN2.1 hiPSCs grown on Vitronectin coated dishes with E8 medium. Surprisingly, under these experimental conditions, a slight but significant up-regulation of cyclin E1 protein expression levels was observed in PD-arrested cells (1.68 ± 0.32 and 1.57 ± 0.14 fold induction vs. Control for FN2.1 and H9, respectively) ()). Once more, down-regulation of cyclin E1 protein levels was observed in NOCO treated cells (0.34 ± 0.05 and 0.34 ± 0.04 fold induction vs. Control for FN2.1 and H9, respectively) ()).
Figure 6. Changes in cyclin E1 protein expression levels throughout hPSCs and NP cell cycle progression. Analysis of cyclin E1 protein expression levels quantified by Western blot in asynchronous (Control) or synchronous G1 (PD arrested, 5 μM for 30 h for hPSCs and 1 μM for 24 h for NP) (a, b), G1/S boundary [Aphidicolin (Aph.) arrested, 10 μg/ml for 20 h for hPSCs and 10 μg/ml for 48 h for NP] (c) or G2/M [NOCO arrested, 100 ng/ml for 24 h for hPSCs and 200 ng/ml for 54 h for NP (a, b); Vincristine (Vcr.) 250 nM for 24 h for hPSCs (c)] FN2.1 and H9 hPSCs [grown in Geltrex coated dishes with CM (a) or in Vitronectin coated dishes with E8 (b, c)] and NP cells. Actin was used as loading control. Mean + SEM fold induction relative to Control (asynchronous cells, arbitrary set as 1) and representative blots of three independent experiments are shown. (*) p < 0.05, (**) p < 0.01, (***) p < 0.001 vs. Control.
![Figure 6. Changes in cyclin E1 protein expression levels throughout hPSCs and NP cell cycle progression. Analysis of cyclin E1 protein expression levels quantified by Western blot in asynchronous (Control) or synchronous G1 (PD arrested, 5 μM for 30 h for hPSCs and 1 μM for 24 h for NP) (a, b), G1/S boundary [Aphidicolin (Aph.) arrested, 10 μg/ml for 20 h for hPSCs and 10 μg/ml for 48 h for NP] (c) or G2/M [NOCO arrested, 100 ng/ml for 24 h for hPSCs and 200 ng/ml for 54 h for NP (a, b); Vincristine (Vcr.) 250 nM for 24 h for hPSCs (c)] FN2.1 and H9 hPSCs [grown in Geltrex coated dishes with CM (a) or in Vitronectin coated dishes with E8 (b, c)] and NP cells. Actin was used as loading control. Mean + SEM fold induction relative to Control (asynchronous cells, arbitrary set as 1) and representative blots of three independent experiments are shown. (*) p < 0.05, (**) p < 0.01, (***) p < 0.001 vs. Control.](/cms/asset/fc32869d-8b02-4380-abc3-06d2b2b72e67/kccy_a_1496740_f0006_b.gif)
Next, we arrested hPSCs (grown on Vitronectin with E8) and NP in G1/S boundary with Aphidicolin and quantified cyclin E1 protein expression levels by Western blot. Importantly, we observed a strong and significant up-regulation of cyclin E1 protein levels in all cases (9.31 ± 0.24; 4.68 ± 1.48 and 2.32 ± 0.31 fold induction vs. Control for FN2.1, H9 and NP, respectively) ()).
Finally, as cyclin E1 protein levels down-regulation in S-G2/M phases could be a result of a side effect of the inhibitor used to arrest the cells, we decided to repeat the experiments using a different pharmacological inhibitor. Therefore, we tested Vincristine to arrest hPSCs (grown on Vitronectin with E8) in G2/M. After determining that hPSCs were effectively arrested in G2/M upon exposure to Vincristine (250nM for 24 hours) (Supplementary Figure 3c), cyclin E1 protein expression levels were analyzed by Western blot. Importantly, a strong and significant down-regulation of cyclin E1 protein expression levels was observed (0.34 ± 0.14 and 0.44 ± 0.15 fold induction vs. Control for FN2.1 and H9, respectively) ()).
Taken together, the above results indicate that cyclin E1 protein expression levels are periodically regulated through hPSCs and NP cell cycle, being up-regulated (similar to cyclin E1 mRNA) in G1/S boundary and down-regulated in G2/M.
Regulation of cyclin E1 mRNA and protein expression levels throughout hPSCs cell cycle progression after aphidicolin block and release
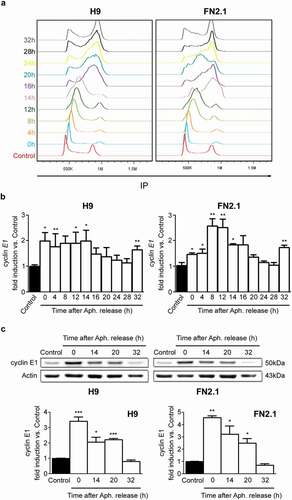
hPSCs (H9 hESCs and FN2.1 hiPSCs) grown on Vitronectin coated dishes with E8 medium were synchronized in G1/S boundary with Aphidicolin (10 μg/ml for 20 hours) and then released to enter the cell cycle. First, in order to demonstrate that cells were properly released from the blocking procedure, cell cycle progression was analyzed at every 4 hours after release to a total of 32 hours (). Next, cyclin E1 mRNA and protein expression levels were quantified by RT-qPCR or Western blot in asynchronous or at different time points after Aphidicolin removal. Particularly, cyclin E1 mRNA levels peaked at G1/S boundary and remained high until 16 hours after release, with an accompanying rise in the population of cells with a DNA content of 4N (G2/M phase). As shown in ), at 32 hours after Aphidicolin release, cyclin E1 expression levels peaked again. Finally, a similar behavior, although delayed in time, was observed with cyclin E1 protein abundance ()). Taken together, the above results indicate that cyclin E1 mRNA and protein expression levels are undoubtedly periodically regulated through hPSCs cell cycle progression. Importantly, cyclins A2, B1, D1, D2 and D3 mRNA expression levels also showed a periodic behavior after Aphidicolin block and release experiments (Supplementary Figure 5).
Figure 7. Changes in cyclin E1 mRNA and protein expression levels throughout hPSCs cell cycle progression after Aphidicolin block and release. H9 hESCs and FN2.1 hiPSCs grown in Vitronectin coated dishes with E8 medium were synchronized at G1/S boundary by Aphidicolin (Aph.) block (10 μg/ml for 20 h) and released to enter the cell cycle, and then: (a) Cells were harvested at the indicated time points after release and fixed with cold 70% ethanol. DNA content was measured with propidium iodide (PI) and its fluorescence was determined with a flow cytometer to determine DNA content. A representative DNA content frequency histogram plot is shown for each time point. N = 3. Control: asynchronous cells. h: hours. (b) cyclin E1 mRNA expression levels were quantified by RT-qPCR in asynchronous or at different time points after Aphidicolin (Aph.) removal. rpl7 expression was used as normalizer. Graphs show mean + SEM mRNA fold induction relative to asynchronous control cells (arbitrarily set as 1) of at least three independent experiments. h: hours. (*) p < 0.05 and (**) p < 0.01 vs. Control (asynchronous cells). (c) cyclin E1 protein expression levels were quantified by Western blot in asynchronous or at different time points after Aphidicolin (Aph.) removal. Actin was used as loading control. Mean + SEM fold induction relative to Control (asynchronous cells, arbitrary set as 1) and representative blots of three independent experiments are shown. h: hours. (*) p < 0.05, (**) p < 0.01, (***) p < 0.001 vs. Control.
Regulation of cyclin E1 protein levels in G2/M phase
Cyclin E1 drives the transition from G1 to S phase through the assembly of pre-replication complexes and activation of CDK2, leading to the initiation of DNA synthesis. In somatic cells, cyclin E1 peaks in expression at G1/S phase of the cell cycle. This periodicity in expression results from regulation of both mRNA abundance and protein degradation. Upon S phase entry CDK2 phosphorylation of cyclin E1 primes it for phosphorylation. These phosphorylation events create short regions in cyclin E1 that allow its ubiquitin-dependent proteasomal degradation during S phase and G2/M [Citation37].
In order to test if the above mentioned mechanism is also operative in hPSCs and hESCs-derived NP, cyclin E1 protein levels were quantified by Western blot in asynchronous and G2/M- (NOCO treatment) arrested H9 hESCs, FN2.1 hiPSCs (both grown on Vitronectin with E8) and NP cells in the presence or absence of the proteasome inhibitor MG-132. Importantly, by Western blot analysis we found that proteasome inhibition significantly reverted cyclin E1 down-regulation observed in G2/M-arrested cells (). Moreover, we then studied if CDK2 inhibition was also able to prevent cyclin E1 degradation in G2/M. To do so, we used a specific CDK2 inhibitor (CDK2 inhibitor II) using the same experimental conditions described for MG-132 and demonstrated that CDK2 activity mediates cyclin E1 protein product down-regulation in G2/M-arrested hPSCs and NP ()).
Figure 8. Regulation of cyclin E1 protein expression levels in G2/M phase. Analysis of cyclin E1 protein expression levels quantified by Western blot in asynchronous (Control) or synchronous G2/M (NOCO arrested, 100 ng/ml for 24 h for hPSCs and 200 ng/ml for 54h for NP) (a, b and c) or G1 (PD arrested, 5 μM for 30h for hPSCs and 1μM for 24 h for NP) (c) FN2.1 and H9 hPSCs (grown in Vitronectin coated dishes with E8) and NP cells treated or not with proteasome inhibitor MG-132 (MG132, 62.5 nM for 24 h for hPSCs and 62.5 nM for 54 h for NP) (a), CDK2 inhibitor II (CDK2i, 5 µM for 24 h for hPSCs and 5µM for 54 h for NP) (b) and GSK3β inhibitor CHIR99021 (CHIR, 10 µM for 24 h) (c). Actin was used as loading control. Mean + SEM fold induction relative to Control (asynchronous cells, arbitrary set as 1) and representative blots of at least three independent experiments are shown. (*) p < 0.05, (**) p < 0.01, (***) p < 0.001 vs. Control. (&) p < 0.05, (&&) p < 0.01 vs. NOCO.
Finally, as it has been reported that GSK3β can also phosphorylate cyclin E1 and regulate its turnover [Citation38], we analyzed cyclin E1 protein expression levels by Western blot in asynchronous, G1- (PD treatment) and G2/M- (NOCO treatment) arrested H9 hESCs, FN2.1 hiPSCs (both grown on Vitronectin with E8) and NP cells in the presence or not of CHIR99021 (specific GSK3β inhibitor). Interestingly, in this cellular context we found that GSK3β inhibition was not able to prevent cyclin E1 turnover in G2/M. Not only that, but in the presence of the GSK3β inhibitor we determined that cyclin E1 protein levels diminished even more in G2/M ()). Importantly, the efficacy of GSK3β inhibition by CHIR99021 in hPSCs has been recently confirmed in our lab [Citation28].
Altogether, the above results suggest that cyclin E1 turnover in G2/M in both hPSCs and NP relies on CDK2-mediated ubiquitin-dependent proteasomal degradation. Again, hPSCs pluripotency was not affected upon NOCO, MG-132, CDK2 inhibitor II and CHIR99021 treatments under the experimental conditions described according to pluripotency markers (oct-4 and nanog) mRNA expression levels quantified by RT-qPCR (Supplementary figure 4c).
Discussion
hPSCs have become an essential tool for the study of developmental processes in vitro and also in other areas of basic biology, holding great promise for use in regenerative medicine or drug discovery. Thus, what precedes their safe use in clinic is the precise understanding of the molecular pathways that regulate prolonged self-renewal and pluripotency in vitro. Current knowledge about stem cell biology suggests a mechanistic link between cell cycle and self-renewal and pluripotency networks. In this regard, it has been reported that Oct-4, Nanog and Sox2, master regulators of pluripotency, have roles in controlling transition through the cell cycle directly regulating genes required for the G1 to S phase transition such as CDK6 and Cdc25A, and to accelerate G1 progression [Citation39–Citation41]. Likewise, the cell cycle machinery has been implicated in the regulation of the aforementioned networks including targets such as Oct-4, Nanog and Sox2 [Citation42]. For example, Brumbaugh and colleagues reported that ERK2 and CDK1/cyclin A2 differentially phosphorylate Nanog in vitro, raising the possibility that CDK1 functions analogously to ERK2, perhaps to sustain Nanog during S/M phase; however, this was only speculative at that point [Citation43].
To the best of our knowledge several scenarios describing the cell cycle of hPSCs have been proposed until present, but the precise functional and molecular characteristics of hPSCs division cycle remain unanswered. Therefore, the present study attempted to shed some light into the understanding of cell cycle regulation in two types of hPSCs, hESCs and hiPSCs, putting special emphasis in the levels and timing of expression of several cyclins, particularly cyclin E1.
Another current challenge for researchers is the efficient generation of hPSCs-derived renewable NP, which can further differentiate into neurons, for their potential use in cell replacement therapies. For this reason, in this work we also analyzed the cell cycle profile and the expression pattern of major cyclins in hESCs-derived NP, subject of research that as far as we know has not been studied yet.
Herein, we confirmed that in H9 hESCs and FN2.1 hiPSCs () D-type cyclins mRNAs are periodically expressed in hPSCs. Moreover, we determined that cyclin D2 is the predominant D-type cyclin expressed in both pluripotent cell types, in particular, we observed that cyclin D1 mRNA and protein expression levels are significantly lower than the ones observed in HF. In line with this finding, Card and colleagues reported that the levels of cyclin D1 are attenuated by miR-302a in hESCs [Citation41]. Additionally, in 2010 the aforementioned group reported that cyclin D2 is expressed predominantly in hESCs (WA09/H9) and that, upon lineage commitment, at the early stages of differentiation a change in the expression ratio of cyclin D2 to D1 occurs [Citation21].
Furthermore, in the case of type A- and B-cyclins, early studies with mESCs have revealed that cyclins A2 and B1 proteins are constitutive expressed and more abundant in mESCs than in somatic MEFs [Citation44]. Consistent with these findings, Becker et al. observed similarly robust expression of A- and B-type cyclins in hESCs, attributing these high levels to the increased proportion of hESCs residing, at any given time, in S, G2 and M phases [Citation5]. Supporting these findings, Neganova et al. showed that in hESCs cyclins A2 and B1 levels fluctuate during the cell cycle [Citation22]. In line with this evidence, we found that cyclin A2 and B1 mRNAs are periodically expressed in both hESCs and hiPSCs and determined that their mRNAs and protein expression levels are higher in hPSCs than in somatic HF independently of their distinct cell cycle distribution. Interestingly, Liu et al observed that Akt activity fluctuates across the cell cycle, mirroring cyclin A expression. Moreover, Cyclin A2-deletion-induced elevation of cellular apoptosis in mouse embryonic stem cells, supporting the idea that cyclin A2 may govern cellular survival in vivo largely by promoting Akt activation [Citation45]. Thus, whether the elevated expression levels of cyclin A2 we observed contribute to govern cell survival of hPSCs by regulating Akt activity awaits to be determined.
Last but not least, reports about the way cyclin E1 is regulated through hPSCs cell cycle progression are very contradictory. On this sense, Filipczyk et al. showed by immunocytochemistry that 100% of proliferating hESCs are positive for cyclin E1 protein concluding that it is constitutively expressed in undifferentiated hESCs similarly to what occurs in mESCs [Citation9]. On the same line, more recently Singh et al. observed that cyclin E1 expression lacks cell cycle periodicity at the transcript and protein levels in H9 hESCs [Citation23]. Conversely, Abdelalim et al. reported that protein levels of cyclin E1 increase around the G1/S boundary in hESCs [Citation3]. In this sense, in the present study we determined that cyclin E1 mRNA and its protein product levels oscillate throughout the cell cycle peaking at G1/S in both hESCs and hiPSCs. Additionally, we found that there is a turnover of cyclin E1 protein levels in G2/M in these cell types. This last result is supported by Neganova et al., who has previously observed that hESCs display lower levels of cyclin E1 protein in G2/M [Citation22].
Taken together our results are somehow consistent with earlier findings regarding D-type, A1 and B2 cyclins mRNA and protein expression levels (abundance and cell cycle-associated periodicity) in hESCs. Importantly, herein we found that a similar molecular setting is also present in hiPSCs, another type of pluripotent cells. Even though, we found that fluctuations of cyclins mRNA expression levels over time differed between embryonic and induced pluripotent stem cells. The differences observed in the temporal fluctuation of cyclins mRNA between H9 and FN2.1 cell lines could be explained, at least in part, by a gene expression signature that defines hiPSCs state as unique from that of hESCs [Citation46].
Further, after a thorough study of cyclin E1 gene expression using different chemical agents for cell cycle synchronization and cell culture conditions, we determined that its mRNA and protein product expression levels fluctuate throughout the cell cycle in both hPSCs types. The discrepancy between the aforementioned reports, especially in what respects to cyclin E1 regulation through hPSCs cell cycle, may be due to the variability between different hESCs/hiPSCs lines used in the experiments among the different groups, the time in culture (number of passages) [Citation20], the use of different experimental protocols or cell culture media, the time window in which synchronized cells are sorted/processed/analyzed, the contribution of some differentiated cells or the sensitivity of Western blot assays or in antibodies quality [Citation19]. Noteworthy, herein different pharmacological inhibitors were used and block and release experiments were performed to synchronize cells in order to encounter and do not miss the time window in which cyclin E1 reaches its highest expression level and also to confirm that changes observed are not result of side effects of the inhibitor used. Interestingly, block and release experiments showed that the fluctuation of cyclin E1 mRNA expression levels were not mirrored by its protein levels, which can be due to differences in their stability and in the transcriptional and translational regulatory mechanisms.
On the other hand, defining in greater detail the mechanistic aspects that connect cell fate switches to the cell cycle machinery will be instrumental in developing novel methods to more effectively generate specific cell types. With this purpose, in this study we also investigated changes occurring in cell cycle and in the expression profile of cyclins in hESCs progeny at the initial stages of neural differentiation. We found that this immature differentiated progeny (Nestin+/CD133+) display a cell cycle profile that highly resembles that of somatic cells with a highly populated G1 phase. It is important to mention that NP expressed significantly higher levels of D-type cyclins (cyclin D1 and D2) than HF and hPSCs. On this sense, it has been reported that overexpression of cyclin D1 and cyclin E1 in mice shortens G1-phase, leading to down-regulation of neurogenesis and increased populations of apical and intermediate progenitor cells [Citation47–Citation51]. Moreover, it has been also shown that cyclin D2 is essential for the expansion of neural stem/progenitor cells in both embryonic and adult mammalian brains [Citation50,Citation51]. Thus, it is conceivable that the expression levels of cyclin D2 and E1 displayed by hESC-derived NP would be required to sustain proliferation at this stage of differentiation. Recently, Pauklin et al. reported that in late G1, cyclin D1 is induced and forms a complex with locus-specific transcription factors to recruit transcriptional coactivators onto neuroectoderm genes and corepressors onto endoderm genes in stem cells [Citation52]. Importantly, it has been shown that the activities of D-type cyclins also promote neuroectoderm formation during hiPSCs generation through up-regulating Pax6 [Citation53]. Thus, we can speculate that D-type cyclins may also influence phenotype-associated gene expression in NP.
Next, we deepen our study on cyclin E1 mRNA regulation in asynchronous hPSCs. It should be mentioned that cyclin E1/CDK2 is considered the main cyclin/CDK complex in mESCs. Importantly, decreasing CDK2 activity was found to lengthen G1 establishing a canonical cell cycle profile in mESCs cells, which was followed by differentiation [Citation54]. Importantly, similar results were also shown for hESCs [Citation9,Citation22]. Moreover, cyclin E1 plays a key role during plenipotent hESCs derivation and, potentially, during normal embryo development as well [Citation55]. As high levels of CDK2 activity may result of the elevated expression levels of cyclin E1, we aimed to study which signaling pathways are involved in cyclin E1 mRNA regulation in hPSCs. Even though PI3K/AKT and MEK/ERK1/2 signaling cascades cooperate to maintain hPSCs stemness [Citation26,Citation27], only MERK/ERK1/2 inhibition causes the loss of hESCs self-renewal capacity and proliferation rate [Citation27]. On the other hand, PI3K/AKT signaling pathway has a predominant relevance in ensuring hPSCs survival [Citation28]. Consistent with these findings, on this report we demonstrated that only MEK/ERK1/2, but not PI3K/AKT, signaling pathway regulates hPSCs cyclin E1 mRNA expression levels in asynchronously growing cells.
In what respect to the study of transcription factors that could regulate cyclin E1 mRNA expression levels, we focused our attention in c-Myc and the E2F family. In the case of c-Myc, it was already reported that this transcription factor may play a key role in regulating promoters and microRNAs associated with core pluripotency-associated genes. These findings implicate targets of the c-Myc network not only in playing a key role in controlling the efficiency of reprogramming, but also in maintaining stem cell pluripotency [Citation29,Citation31,Citation32]. Moreover, there have been identified direct c-Myc targets like cyclins, including cyclin E1, and CDKs in mESCs, suggesting the role of c-Myc in cell cycle regulation of pluripotent stem cells [Citation33]. Thus, occupancy of cell cycle regulatory genes promoters by c-Myc may play a role in the rapid cell division of both murine and hPSCs. Indeed, we found that cyclin E1 mRNA expression levels diminished upon c-Myc inhibition with 10,058-F4 in hPSCs. Interestingly, activation of ERK1/2 markedly enhances c-Myc protein stability as a result of direct phosphorylation of serine-62 [Citation56], which means that MEK/ERK1/2 could be upstream of c-Myc in cyclin E1 mRNA regulation. Curiously, it has been also demonstrated that cyclin E1/CDK2 can also phosphorylate c-Myc at serine-62 [Citation57], suggesting that there could be a complex regulatory positive feedback loop between c-Myc and cyclin E1/CDK2 in hPSCs. However, further experiments should be performed in order to confirm this hypothesis.
On the other hand, it is well known that cell cycle regulation of cyclin E transcription is mediated by E2F binding sites present in its promoter. Moreover, cyclin E1 is able to stimulate its own transcription through a positive feedback mechanism involving E2F activation [Citation35,Citation58]. Particularly, E2F1 was described as the main E2F transcription factor directly involved in cyclin E1 regulation [Citation36]. Indeed, we used a pan-E2Fs inhibitor and observed that, in hPSCs, cyclin E1 mRNA expression levels partially depends on E2Fs activity. In conclusion, we found that, in asynchronous hPSCs, MEK/ERK1/2 signaling pathway plus c-Myc and E2Fs transcription factors may be responsible, at least in part, of the high cyclin E1 mRNA expression levels observed in both H9 hESCs and FN2.1 hiPSCs.
Last but not least, we decided to gain insight about how cyclin E1 protein levels are regulated during S-G2/M phases, as we observed a G2/M-turnover of the protein in both hPSCs and NP. As previously mentioned, it has been demonstrated in somatic cells that upon mitogenic stimuli, cyclin E1 peaks in expression at G1/S phase (mRNA and protein) and then the protein is degraded in S-G2/M phases of the cell cycle. Importantly, we observed the same periodical behavior in hPSCs and NP. Cyclin E1 degradation is mediated through at least two distinct ubiquitin-proteasome pathways: one involving the BCR (BTB-Cul-3-Rbx1) ubiquitin ligase that targets monomeric cyclin E1 [Citation59] and the other the F-box protein Fbw7 (SCFFbw7, Skp1-Cul1-Rbx1-Fbw7) ubiquitin ligase complex [Citation37]. In somatic quiescent cells, monomeric cyclin E1 is constitutively degraded through the BCR-mediated pathway, which does not require cyclin E1 phosphorylation [Citation60]. Contrary, in proliferative somatic cells, upon S phase entry CDK2 phosphorylation of cyclin E1 primes it for phosphorylation by GSK-3β and other kinases [Citation38]. These phosphorylation events create short regions in cyclin E1 that are recognized by the SCFFbw7 complex which mediates cyclin E1 ubiquitination and in consequence its rapid proteasomal degradation during S phase and G2/M [Citation35,Citation37,Citation38,Citation61]. As these mechanisms were not yet studied in undifferentiated hPSCs and its differentiated NP progeny, we analyzed cyclin E1 turnover in G2/M upon proteasome and CDK2 inhibition. Importantly, we demonstrated that in these cellular contexts, cyclin E1 is proteasome-degraded by a mechanism that requires CDK2 activity. Thus, as cyclin E1 phosphorylation by CDK2 seems to be required, cyclin E1 turnover in hPSCs and NP appears to be mediated by the SCFFbw7 complex. Interestingly, on this sense it was reported that undifferentiated mouse hepatic progenitor cells do not require BCR and, instead, utilize the SCFFbw7 pathway to regulate cyclin E1 [Citation35,Citation62]. Accordingly, the BCR or SCFFbw7-dependent ubiquitination pathways appear to modulate cyclin E1 protein expression levels in a cell type- and differentiation stage-specific manner, being the SCFFbw7-mediated pathway the predominant mechanism in highly proliferative pluripotent or progenitors cells. Besides, before being degraded by the SCFFbw7-mediated proteasome pathway, cyclin E1 must be phosphorylated within conserved motifs called Cdc4 phosphodegrons (CPDs) [Citation63]. Cyclin E-CDK2 auto-phosphorylates at T62, T380 and S384 residues present in the CPDs. GSK3β, among others, phosphorylates T380 as well [Citation35]. While T380 phosphorylation is largely constitutive, S384 can only be auto-phosphorylated by CDK2 and is the critical switch that initiates cyclin E1 degradation [Citation63]. Moreover, as phosphorylation of cyclin E1 by GSK3β on T380 was reported to be pivotal for cyclin E1 turnover [Citation38], we studied the effect of GSK3β inhibition with a specific pharmacological inhibitor (CHIR99021) and found not even a partial reversion in cyclin E1 turnover. It is possible that, under our experimental conditions, GSK3β activity has not a dominant role over CDK2-mediated cyclin E1 stability due to the high levels of PI3K/AKT activity, present in hPSCs and NP (stimulated and sustained by bFGF and EGF, respectively), that negatively regulates GSK3β.
Methods
Cell lines, culture and differentiation
hESCs WA09 (H9) were purchased from WiCell Research Institute (http://www.wicell.org) at low passages (p15 to p20). hiPSCs line FN2.1 has been previously derived from human foreskin fibroblasts at our laboratory in accordance with relevant guidelines and regulations and has been fully validated [Citation64]. hPSCs lines were maintained on an inactivated mouse embryonic fibroblast (iMEF) feeder layer in medium comprised of Dulbecco’s Modified Eagle’s Medium/Ham’s F12 (DMEM/F12, Gibco, http://www.thermofisher.com/order/catalog/product/11330032) supplemented with 20% Knockout Serum Replacement (KSR, Gibco, http://www.thermofisher.com/order/catalog/product/10828028), 2 mM non-essential amino acids (Gibco, http://www.thermofisher.com/order/catalog/product/11140050), 2 mM L-glutamine (Gibco, http://www.thermofisher.com/order/catalog/product/25030081), 100U/ml penicillin/100 μg/ml streptomycin (Gibco, http://www.thermofisher.com/order/catalog/product/15140122), 0.1mM β-mercaptoethanol (Gibco, http://www.thermofisher.com/order/catalog/product/21985023) and 4ng/ml of bFGF (Gibco, http://www.thermofisher.com/order/catalog/product/PHG0023). hPSCs were transferred with 1mg/ml collagenase IV into feeder-free diluted (1/100) Geltrex (Gibco, http://www.thermofisher.com/order/catalog/product/A1413302) coated dishes in iMEF conditioned medium (CM). For conditioning medium, 3 × 10⁶ inactivated MEFs were incubated for 24 hours with 25 ml of DMEM/F12 medium supplemented with 5% KSR and 2 ng/ml of bFGF (in addition to the other aforementioned supplements) and stored at −20°C. After thawing, fresh aliquots of KSR and bFGF were added to the medium to render a final concentration of 20% and 8 ng/ml, respectively.
To induce differentiation, hPSCs grown on iMEFs as colonies were dispersed with 1 mg/ml collagenase IV for 1 hour. Cells were then transferred to non-adherent Petri dishes containing DMEM medium supplemented with 20% fetal bovine serum (Gibco, http://www.thermofisher.com/order/catalog/product/10437028), 2 mM L-glutamine, 100U/ml penicillin/100 μg/ml streptomycin used as differentiation medium. Cells were incubated in suspension at 37°C and 5% CO2 for 7 days. During the incubation, the suspended hESCs clumps
aggregated to form three-dimensional non-adherent embryoid bodies (EBs), which were then plated onto 0.1% gelatin coated 24-well microplates and cultured for an additional 7 days. 7 days. Normally, within 2–4 days after plating, tissue like-structures including contractile areas and neural rosettes were observed in the outgrowth of the EB.
For some experiments feeder-free cultures of hPSCs were maintained on Vitronectin (0.5 µg/cm2) coated dishes (VTN-N, Gibco, http://www.thermofisher.com/order/catalog/product/A14700) in combination with fully defined Essential 8 medium (E8, Gibco, http://www.thermofisher.com/order/catalog/product/A1517001). Cultures were split every 3 to 4 days by means of PBS-EDTA (Versene, Gibco, http://www.thermofisher.com/order/catalog/product/15040066) passaging. Before experiments, hPSCs grown on Vitronectin and E8 were dissociated into single cells using Accutase 1x (Gibco, http://www.thermofisher.com/order/catalog/product/A1110501) for 7 minutes, plated onto Vitronectin coated dishes (with addition of 10 µM Y-27,632 ROCK inhibitor) (Abcam, http://www.abcam.com/y-27632-dihydrochloride-ab120129.html) and grown until confluence with E8.
HF were prepared as primary cultures from freshly obtained human foreskins as soon as possible after surgery. Written informed consent was obtained from patients according to guidelines established by the Ethics Committee of the Fundación para la Lucha contra las Enfermedades Neurológicas de la Infancia (FLENI). Briefly, after fat and loose fascia removal, surgical discard tissue was trimmed into strips (approximately 0.5 cm × 1.5 cm) using a sterile scalpel. The cut tissue was subjected to an overnight digestion with dispase and then followed by careful removal of the epidermis. The remaining dermis was placed in high glucose DMEM (Gibco, http://www.thermofisher.com/order/catalog/product/12430047), 10% FBS (vol/vol) (Gibco, http://www.thermofisher.com/order/catalog/product/12484028), plated onto tissue culture plates and incubated in a 37°C, 5% CO2, 90% humidity incubator. Within 7–10 days outgrowths of fibroblasts appeared. The isolated fibroblasts were then expanded, frozen and stored as described elsewhere.
Neural progenitors (NP) were previously derived from H9 hESCs [Citation65]. Briefly, EBs were generated by cutting H9 colonies into small pieces with a needle, detaching them from the feeder layer and culturing them in an ultralow adhesion culture dish in DMEM/F12 medium supplemented with 20% KSR, 2 mM non-essential amino acids, 2 mM L-glutamine, 100 U/ml penicillin/100 μg/ml streptomycin, 0.1 mM β-mercaptoethanol for 4 days. Medium was then replaced with Neural induction medium [DMEM/F12 medium supplemented with N-2 supplement (Gibco, http://www.thermofisher.com/order/catalog/product/17502048), 2 mM non-essential amino acids and 1 μg/ml heparin (Sigma-Aldrich, https://www.sigmaaldrich.com/catalog/product/sial/h4784?lang=es®ion=AR)]. To induce neural rosette formation, 6-day-old EB were plated on 20 μg/ml laminin-coated (Sigma, https://www.sigmaaldrich.com/catalog/product/sigma/l2020?lang=es®ion=AR) dishes and cultured in Neural induction medium for 15 days. During the culture of EB on the laminin-coated surfaces, neural rosettes were observed and manually removed from the surrounding flat cells. Next, the rosettes were dissected into small pieces using a sterile pulled glass pipette under a stereomicroscope and plated on laminin-coated dishes and were cultured in a Neural proliferation medium, which consisted of Neurobasal medium (Gibco, http://www.thermofisher.com/order/catalog/product/21103049) supplemented with B-27 (Gibco, http://www.thermofisher.com/order/catalog/product/17504044), N-2, 2 mM L-glutamine, 2 mM non-essential amino acids, 100U/ml penicillin/streptomycin, 20 ng/ml bFGF, 20 ng/ml epidermal growth factor (EGF, Gibco, http://www.thermofisher.com/order/catalog/product/PHG0313), 20 μg/ml bovine pancreas insulin (Sigma, https://www.sigmaaldrich.com/catalog/product/sigma/i0516?lang=es®ion=AR) and 75 μg/ml low-endotoxin bovine serum albumin (Sigma, https://www.sigmaaldrich.com/catalog/product/sigma/a8806?lang=es®ion=AR). After the initial differentiation lasting 21 days, NP were dissociated using Accutase 1x for 5 min, centrifuged at 300 x g for 5 min, resuspended with Neural proliferation medium and plated on Geltrex coated dishes for further expansion and cryopreservation.
For neuronal differentiation, NP were suspended in Neurobasal medium supplemented with B-27, N-2, 2 mM L-glutamine, 2mM non-essential amino acids, 50 U/ml penicillin/streptomycin (all from Invitrogen, CA, USA), 20 μg/ml bovine pancreas insulin and 75 μg/ml low endotoxin bovine serum albumin (Sigma, MO, USA) as floating aggregates for three days. Then medium was replaced by Neural induction medium (DMEM/F12 medium supplemented with N-2, 2 mM non-essential amino acids and 1 μg/ml heparin) and cellular aggregates were expanded for 10 days. Medium was changed every 2 days. After neural expansion, the aggregates (neurospheres) were allowed to attach onto 10 μg/ml laminin-coated plates in Neural differentiation medium (Neurobasal medium supplemented with B-27, N-2, 10 ng/ml BDNF (Gibco, http://www.thermofisher.com/order/catalog/product/PHC7074), 10 ng/ml GDNF (Gibco, http://www.thermofisher.com/order/catalog/product/PHC7041), 200 μg/ml ascorbic acid (Sigma, https://www.sigmaaldrich.com/catalog/product/sigma/a4544?lang=es®ion=AR), 0.1 μM cAMP (Sigma, https://www.sigmaaldrich.com/catalog/product/sigma/a9501?lang=es®ion=AR) and 20 μg/ml laminin for 10 days. Medium was changed every 2 days.
All cell lines were free of Mycoplasma sp. infection, which was tested as previously described [Citation66].
Immunostaining and fluorescence microscopy
hPSCs and its differentiated progeny, hESCs-derived NP and its neuronal differentiated progeny and HF were analyzed for in situ immunofluorescence. Briefly, cells were rinsed with ice-cold PBS and fixed in PBSA (PBS with 0.1% bovine serum albumin) with 4% formaldehyde for 45 min. After two washes with PBS, cells were permeabilized with 0.1% Triton X-100 in PBSA with 10% normal goat serum for 30 min, washed twice and stained with the corresponding primary antibodies. Fluorescent secondary antibodies were used to localize the antigen/primary antibody complexes. The cells were counterstained with DAPI and examined under a Nikon Eclipse TE2000-S inverted microscope equipped with a 20X E-Plan objective and a super high-pressure mercury lamp. The images were acquired with a Nikon DXN1200F digital camera, which was controlled by the EclipseNet software (version 1.20.0 build 61). For information about antibodies used please see Supplementary methods (Table 3).
RNA isolation and Rt-qPCR
Total RNA was extracted using TRIzol reagent (Invitrogen, http://www.thermofisher.com/order/catalog/product/15596018) according to manufacturer’s instructions. cDNA was synthesized using MMLV reverse transcriptase (Promega, https://www.promega.com/products/pcr/rt-pcr/m-mlv-reverse-transcriptase/?catNum=M1705) from 500 ng of total RNA. For real-time PCR studies, cDNA samples were diluted 5-fold and PCR amplification and analysis were performed with StepOnePlus Real Time PCR System (Applied Biosystems, http://www.thermofisher.com/order/catalog/product/4376600). The SYBR® GreenERTM qPCR SuperMix UDG (Invitrogen, http://www.thermofisher.com/order/catalog/product/11762100) was used for all reactions, following manufacturer’s instructions. For information about primers sequences please refer to Supplementary methods (Table 1).
Synchronization experiments
To arrest cell cycle the following inhibitors were used: Nocodazole (a microtubule polymerization inhibitor) (Sigma, https://www.sigmaaldrich.com/catalog/product/sigma/m1404?lang=es®ion=AR) and Vincristine (a mitotic spindle formation inhibitor) (Sigma, https://www.sigmaaldrich.com/catalog/product/sigma/v8879?lang=es®ion=AR), to arrest at G2/M phase; PD0332991 (a specific inhibitor of CDK4/6) (Sigma, https://www.sigmaaldrich.com/catalog/product/sigma/pz0199?lang=es®ion=AR) and Aphidicolin (a specific inhibitor of DNA polymerase α, which is responsible for DNA replication) (Sigma, https://www.sigmaaldrich.com/catalog/product/sigma/a0781?lang=es®ion=AR), to arrest at early G1 phase and G1/S phase boundary, respectively. Inhibitors were dissolved in DMSO (Nocodazole and Aphidicolin) or H2O (PD0332991 and Vincristine) and stored at −20°C (Nocodazole, Aphidicolin and Vincristine) or room temperature (PD0332991) protected from light. Inhibitors were added to cell cultures such that the final DMSO concentrations were not higher than 0.10% (v/v).
Inhibitors
GSK690693 (Sigma, https://www.sigmaaldrich.com/catalog/product/sigma/sml0428?lang=es®ion=AR), U0126 (Sigma, https://www.sigmaaldrich.com/catalog/product/sigma/u120?lang=es®ion=AR), 10,058-F4 (Sigma, https://www.sigmaaldrich.com/catalog/product/sigma/f3680?lang=es®ion=AR), HLM006474 (Tocris, https://www.tocris.com/products/hlm-006474_5283), CHIR99021 (Tocris, https://www.tocris.com/products/chir-99021_4423), MG-132 (Calbiochem, http://www.merckmillipore.com/AR/es/product/MG-132-CAS-133407-82-6-Calbiochem,EMD_BIO-474,790) and CDK2 inhibitor II (Santa Cruz Biotechnology, https://www.scbt.com/scbt/product/cdk2-inhibitor-ii-222035-13-4) reagents were used as AKT1/2, MEK1/2, c-Myc, E2Fs, GSK3β, proteasome and CDK2 inhibitors, respectively. Inhibitors were dissolved in DMSO and stored at −20°C (GSK690693, HLM006474, MG-132 and CDK2 inhibitor II) or 4°C (U0126, 10,058-F4) protected from light. Inhibitors were added to cell cultures such that the final DMSO concentrations were not higher than 0.10% (v/v).
Flow cytometric analysis of cell cycle arrest by propidium iodide (PI) DNA staining
After inhibitors incubation, single-cell suspensions were obtained with Accutase 1x treatment (37°C for 7 minutes). To analyze DNA content, cells were fixed with ethanol 70%, re-hydrated with PBS 3% FBS, left 40 minutes at 4°C, then incubated 30 minutes at 37°C with RNAse A (100 µg/ml) (Invitrogen, http://www.thermofisher.com/order/catalog/product/12091021), and then with Propidium Iodide (PI) (40 µg/ml) (Sigma-Aldrich, https://www.sigmaaldrich.com/catalog/product/sial/81845?lang=es®ion=AR) for 5 minutes. Cells were immediately analyzed by flow cytometry. Data was acquired on a BD Accuri C6 flow cytometer (BD Biosciences, https://www.bdbiosciences.com/instruments/accuri/). The percentage of cells in each cell cycle phase was calculated by the FlowJo v10.0.7’s univariate platform (https://www.flowjo.com/solutions/flowjo/downloads) which assumes Gaussian distributions of the 2N and 4N (formerly G0/G1 and G2/M, respectively) populations, then uses a subtractive function to reveal the S-phase population. The cells within one standard deviation of the 2N and 4N medians are subtracted from the data, and the remaining cells (S-phase) are fit with a polynomial function that is convoluted with the Gaussian distributions of the 2N and 4N populations to form the complete model.
Flow cytometric analysis of Oct-4 stemness marker
hPSCs grown on Vitronectin coated dishes with E8 medium were disassociated into single cells by treatment with Accutase and centrifuged at 1000 rpm for 5 min. After addition of 4% formaldehyde and fixation at room temperature for 30 min, cells were washed three times with PBS/Albumin 0,1% and then permeabilized (in a solution containing 1% BSA, 10% normal goat serum and 0.1% Triton X-100) at room temperature for 45 min. Then, cells were incubated for 2h with a primary antibody targeting Oct-4 (1:50 in a solution containing 1% BSA, 10% normal goat serum). Cells were then washed three times with PBS/Albumin 0,1% and incubated for 45 min. with Alexa Fluor 488-conjugated goat anti-mouse IgG secondary antibody (1:400) under dark conditions at room temperature. After centrifugation, cells were washed three times with PBS/Albumin 0,1%, resuspended in this solution and analyzed on a BD Accuri C6 flow cytometer. Normal mouse IgG was used as isotype control.
Protein analysis
Total proteins were extracted from hPSCs and NP in ice-cold RIPA protein extraction buffer (Sigma, https://www.sigmaaldrich.com/catalog/product/sigma/r0278?lang=es®ion=AR) supplemented with protease inhibitors (Protease inhibitor cocktail set I, Calbiochem, http://www.merckmillipore.com/AR/es/product/Protease-Inhibitor-Cocktail-Set-I-Calbiochem,EMD_BIO-539,131). Protein concentration was determined using Bicinchoninic Acid Protein Assay (Pierce, http://www.thermofisher.com/order/catalog/product/23225). Equal amounts of protein were run on 12% SDS-polyacrylamide gel electrophoresis and transferred to PVDF (Millipore, http://www.merckmillipore.com/AR/es/product/Immobilon-P-PVDF-Membrane,MM_NF-IPVH304F0) membranes. Blots were blocked 1 hour at room temperature in TBS (20 mM Tris-HCl, pH 7.5, 500 mM NaCl) containing low-fat powdered milk (5%) and Tween 20 (0.1%). Incubations with primary antibodies were performed overnight at 4°C in blocking buffer (3% skim milk, 0.1% Tween, in Tris-buffered saline). Membranes were then incubated with the corresponding counter-antibody and the proteins revealed by enhanced chemiluminescence detection (SuperSignal West Femto System, Thermo Scientific, http://www.thermofisher.com/order/catalog/product/34095). For information about antibodies used please see Supplementary methods (Table 2). Densitometric analysis of protein levels were performed with ImageJ 1.34s software (Wayne Rasband, National Institutes of Health, https://imagej.nih.gov/ij/) for chemiluminescence detection. Representative whole membrane blots showing the specificity of cyclins (D1, D2, E1, A and B1) antibodies are shown in Supplementary Figure 6.
Statistical analysis
All results are expressed as mean + SEM. Two-tailed Student’s t-test were used to detect significant differences (p < 0.05) among treatments as indicated. Statistical analysis was made with the software GraphPad PRISM Version 6 (https://www.graphpad.com/scientific-software/prism/).
Supplemental Material
Download MS Word (4 MB)Acknowledgments
The authors wish to thank Darío Fernandez Espinosa and Marcela Cañari for their technical skillful assistance. M.S.R.V, O.M.H, S.G.M and L.R. are members of the National Council for Scientific Research (CONICET).
Disclosure statement
No potential conflict of interest was reported by the authors.
Supplementary material
Supplementary material can be accessed here.
Additional information
Funding
Related Research Data
References
- Thomson JA, Itskovitz-Eldor J, Shapiro SS, et al. Embryonic stem cell lines derived from human blastocysts. Science. 1998 Nov 06;282(5391):1145–1147.
- Takahashi K, Tanabe K, Ohnuki M, et al. Induction of pluripotent stem cells from adult human fibroblasts by defined factors. Cell. 2007 Nov 30;131(5):861–872.
- Abdelalim EM. Molecular mechanisms controlling the cell cycle in embryonic stem cells. Stem Cell Rev. 2013 Dec;9(6):764–773.
- Ruiz S, Panopoulos AD, Herrerias A, et al. A high proliferation rate is required for cell reprogramming and maintenance of human embryonic stem cell identity. Curr Biol. 2011 Jan 11;21(1):45–52.
- Becker KA, Ghule PN, Therrien JA, et al. Self-renewal of human embryonic stem cells is supported by a shortened G1 cell cycle phase. J Cell Physiol. 2006 Dec;209(3):883–893.
- Ghule PN, Medina R, Lengner CJ, et al. Reprogramming the pluripotent cell cycle: restoration of an abbreviated G1 phase in human induced pluripotent stem (iPS) cells. J Cell Physiol. 2011 May;226(5):1149–1156.
- Calder A, Roth-Albin I, Bhatia S, et al. Lengthened G1 phase indicates differentiation status in human embryonic stem cells. Stem Cells Dev. 2013 Jan 15;22(2):279–295.
- Boward B, Wu T, Dalton S. Concise Review: control of Cell Fate Through Cell Cycle and Pluripotency Networks. Stem Cells. 2016 Jun;34(6):1427–1436.
- Filipczyk AA, Laslett AL, Mummery C, et al. Differentiation is coupled to changes in the cell cycle regulatory apparatus of human embryonic stem cells. Stem Cell Res. 2007 Oct;1(1):45–60.
- Sela Y, Molotski N, Golan S, et al. Human embryonic stem cells exhibit increased propensity to differentiate during the G1 phase prior to phosphorylation of retinoblastoma protein. Stem Cells. 2012 Jun;30(6):1097–1108.
- Burdon T, Smith A, Savatier P. Signalling, cell cycle and pluripotency in embryonic stem cells. Trends Cell Biol. 2002 Sep;12(9):432–438.
- Lange C, Calegari F. Cdks and cyclins link G1 length and differentiation of embryonic, neural and hematopoietic stem cells. Cell Cycle. 2010 May 15;9(10):1893–1900.
- Collins I, Garrett MD. Targeting the cell division cycle in cancer: CDK and cell cycle checkpoint kinase inhibitors. Curr Opin Pharmacol. 2005 Aug;5(4):366–373.
- Vermeulen K, Van Bockstaele DR, Berneman ZN. The cell cycle: a review of regulation, deregulation and therapeutic targets in cancer. Cell Prolif. 2003 Jun;36(3):131–149.
- Malumbres M. Cyclin-dependent kinases. Genome Biol. 2014;15(6):122.
- Canepa ET, Scassa ME, Ceruti JM, et al. INK4 proteins, a family of mammalian CDK inhibitors with novel biological functions. IUBMB Life. 2007 Jul;59(7):419–426.
- Abbas T, Dutta A. p21 in cancer: intricate networks and multiple activities. Nat Rev Cancer. 2009 Jun;9(6):400–414.
- White J, Dalton S. Cell cycle control of embryonic stem cells. Stem Cell Rev. 2005;1(2):131–138.
- Conklin JF, Sage J. Keeping an eye on retinoblastoma control of human embryonic stem cells. J Cell Biochem. 2009 Dec 01;108(5):1023–1030.
- Barta T, Dolezalova D, Holubcova Z, et al. Cell cycle regulation in human embryonic stem cells: links to adaptation to cell culture. Exp Biol Med (Maywood). 2013 Mar;238(3):271–275.
- Becker KA, Stein JL, Lian JB, et al. Human embryonic stem cells are pre-mitotically committed to self-renewal and acquire a lengthened G1 phase upon lineage programming. J Cell Physiol. 2010 Jan;222(1):103–110.
- Neganova I, Zhang X, Atkinson S, et al. Expression and functional analysis of G1 to S regulatory components reveals an important role for CDK2 in cell cycle regulation in human embryonic stem cells. Oncogene. 2009 Jan 08;28(1):20–30.
- Singh AM, Chappell J, Trost R, et al. Cell-cycle control of developmentally regulated transcription factors accounts for heterogeneity in human pluripotent cells. Stem Cell Reports. 2013;1(6):532–544.
- Xu C, Rosler E, Jiang J, et al. Basic fibroblast growth factor supports undifferentiated human embryonic stem cell growth without conditioned medium. Stem Cells. 2005 Mar;23(3):315–323.
- Levenstein ME, Ludwig TE, Xu RH, et al. Basic fibroblast growth factor support of human embryonic stem cell self-renewal. Stem Cells. 2006 Mar;24(3):568–574.
- Paling NR, Wheadon H, Bone HK, et al. Regulation of embryonic stem cell self-renewal by phosphoinositide 3-kinase-dependent signaling. J Biol Chem. 2004 Nov 12;279(46):48063–48070.
- Li J, Wang G, Wang C, et al. MEK/ERK signaling contributes to the maintenance of human embryonic stem cell self-renewal. Differentiation. 2007 Apr;75(4):299–307.
- Romorini L, Garate X, Neiman G, et al. AKT/GSK3beta signaling pathway is critically involved in human pluripotent stem cell survival. Sci Rep. 2016;6:35660.
- Kim J, Chu J, Shen X, et al. An extended transcriptional network for pluripotency of embryonic stem cells. Cell. 2008 Mar 21;132(6):1049–1061.
- Nakagawa M, Koyanagi M, Tanabe K, et al. Generation of induced pluripotent stem cells without Myc from mouse and human fibroblasts. Nat Biotechnol. 2008 Jan;26(1):101–106.
- Nagaria PK, Robert C, Park TS, et al. High-Fidelity Reprogrammed Human IPSCs Have a High Efficacy of DNA Repair and Resemble hESCs in Their MYC Transcriptional Signature. Stem Cells Int. 2016;2016:3826249.
- Chen X, Xu H, Yuan P, et al. Integration of external signaling pathways with the core transcriptional network in embryonic stem cells. Cell. 2008 Jun 13;133(6):1106–1117.
- Kidder BL, Yang J, Palmer S. Stat3 and c-Myc genome-wide promoter occupancy in embryonic stem cells. PLoS One. 2008;3(12):e3932.
- Santoni-Rugiu E, Falck J, Mailand N, et al. Involvement of Myc activity in a G(1)/S-promoting mechanism parallel to the pRb/E2F pathway. Mol Cell Biol. 2000 May;20(10):3497–3509.
- Siu KT, Rosner MR, Minella AC. An integrated view of cyclin E function and regulation. Cell Cycle. 2012 Jan 01;11(1):57–64.
- Ohtani K, DeGregori J, Nevins JR. Regulation of the cyclin E gene by transcription factor E2F1. Proc Natl Acad Sci U S A. 1995 Dec 19;92(26):12146–12150.
- Caldon CE, Sergio CM, Sutherland RL, et al. Differences in degradation lead to asynchronous expression of cyclin E1 and cyclin E2 in cancer cells. Cell Cycle. 2013 Feb 15;12(4):596–605.
- Welcker M, Singer J, Loeb KR, et al. Multisite phosphorylation by Cdk2 and GSK3 controls cyclin E degradation. Mol Cell. 2003 Aug;12(2):381–392.
- Lee J, Go Y, Kang I, et al. Oct-4controls cell-cycle progression of embryonic stem cells. Biochem J. 2010 Feb 09;426(2):171–181.
- Zhang X, Neganova I, Przyborski S, et al. A role for NANOG in G1 to S transition in human embryonic stem cells through direct binding of CDK6 and CDC25A. J Cell Biol. 2009 Jan 12;184(1):67–82.
- Card DA, Hebbar PB, Li L, et al. Oct4/Sox2-regulated miR-302 targets cyclin D1 in human embryonic stem cells. Mol Cell Biol. 2008 Oct;28(20):6426–6438.
- Ouyang J, Yu W, Liu J, et al. Cyclin-dependent kinase-mediated Sox2 phosphorylation enhances the ability of Sox2 to establish the pluripotent state. J Biol Chem. 2015 Sep 11;290(37):22782–22794.
- Brumbaugh J, Russell JD, Yu P, et al. NANOG is multiply phosphorylated and directly modified by ERK2 and CDK1 in vitro. Stem Cell Reports. 2014 Jan 14;2(1):18–25.
- Fujii-Yamamoto H, Kim JM, Arai K, et al. Cell cycle and developmental regulations of replication factors in mouse embryonic stem cells. J Biol Chem. 2005 Apr 01;280(13):12976–12987.
- Liu P, Begley M, Michowski W, et al. Cell-cycle-regulated activation of Akt kinase by phosphorylation at its carboxyl terminus. Nature. 2014 Apr 24;508(7497):541–545.
- Chin MH, Mason MJ, Xie W, et al. Induced pluripotent stem cells and embryonic stem cells are distinguished by gene expression signatures. Cell Stem Cell. 2009 Jul 2;5(1):111–123.
- Lange C, Huttner WB, Calegari F. Cdk4/cyclinD1 overexpression in neural stem cells shortens G1, delays neurogenesis, and promotes the generation and expansion of basal progenitors. Cell Stem Cell. 2009 Sep 04;5(3):320–331.
- Pilaz LJ, Patti D, Marcy G, et al. Forced G1-phase reduction alters mode of division, neuron number, and laminar phenotype in the cerebral cortex. Proc Natl Acad Sci U S A. 2009 Dec 22;106(51):21924–21929.
- Lim S, Kaldis P. Loss of Cdk2 and Cdk4 induces a switch from proliferation to differentiation in neural stem cells. Stem Cells. 2012 Jul;30(7):1509–1520.
- Tsunekawa Y, Osumi N. How to keep proliferative neural stem/progenitor cells: a critical role of asymmetric inheritance of cyclin D2. Cell Cycle. 2012 Oct 01;11(19):3550–3554.
- Tsunekawa Y, Britto JM, Takahashi M, et al. Cyclin D2 in the basal process of neural progenitors is linked to non-equivalent cell fates. EMBO J. 2012 Apr 18;31(8):1879–1892.
- Pauklin S, Madrigal P, Bertero A, et al. Initiation of stem cell differentiation involves cell cycle-dependent regulation of developmental genes by Cyclin D. Genes Dev. 2016 Feb 15;30(4):421–433.
- Chen CL, Wang LJ, Yan YT, et al. Cyclin D1 acts as a barrier to pluripotent reprogramming by promoting neural progenitor fate commitment. FEBS Lett. 2014 Nov 03;588(21):4008–4017.
- Koledova Z, Kafkova LR, Calabkova L, et al. Cdk2 inhibition prolongs G1 phase progression in mouse embryonic stem cells. Stem Cells Dev. 2010 Feb;19(2):181–194.
- Krivega MV, Geens M, Heindryckx B, et al. Cyclin E1 plays a key role in balancing between totipotency and differentiation in human embryonic cells. Mol Hum Reprod. 2015 Dec;21(12):942–956.
- Sears R, Nuckolls F, Haura E, et al. Multiple Ras-dependent phosphorylation pathways regulate Myc protein stability. Genes Dev. 2000 Oct 01;14(19):2501–2514.
- Hydbring P, Bahram F, Su Y, et al. Phosphorylation by Cdk2 is required for Myc to repress Ras-induced senescence in cotransformation. Proc Natl Acad Sci U S A. 2010 Jan 5;107(1):58–63.
- Geng Y, Eaton EN, Picon M, et al. Regulation of cyclin E transcription by E2Fs and retinoblastoma protein. Oncogene. 1996 Mar 21;12(6):1173–1180.
- Singer JD, Gurian-West M, Clurman B, et al. Cullin-3 targets cyclin E for ubiquitination and controls S phase in mammalian cells. Genes Dev. 1999 Sep 15;13(18):2375–2387.
- McEvoy JD, Kossatz U, Malek N, et al. Constitutive turnover of cyclin E by Cul3 maintains quiescence. Mol Cell Biol. 2007 May;27(10):3651–3666.
- Koepp DM, Schaefer LK, Ye X, et al. Phosphorylation-dependent ubiquitination of cyclin E by the SCFFbw7 ubiquitin ligase. Science. 2001 Oct 5;294(5540):173–177.
- Kossatz U, Breuhahn K, Wolf B, et al. The cyclin E regulator cullin 3 prevents mouse hepatic progenitor cells from becoming tumor-initiating cells. J Clin Invest. 2010 Nov;120(11):3820–3833.
- Davis RJ, Swanger J, Hughes BT, et al. The PP2A-B56 Phosphatase Opposes Cyclin E Autocatalytic Degradation via Site-Specific Dephosphorylation. Mol Cell Biol. 2017 Apr 15;37(8).
- Questa M, Romorini L, Bluguermann C, et al. Generation of iPSC line iPSC-FH2.1 in hypoxic conditions from human foreskin fibroblasts. Stem Cell Res. 2016 Mar;16(2):300–303.
- Garcia CP, Videla Richardson GA, Dimopoulos NA, et al. Human Pluripotent Stem Cells and Derived Neuroprogenitors Display Differential Degrees of Susceptibility to BH3 Mimetics ABT-263, WEHI-539 and ABT-199. PLoS One. 2016;11(3):e0152607.
- Romorini L, Riva DA, Bluguermann C, et al. Effect of antibiotics against Mycoplasma sp. on human embryonic stem cells undifferentiated status, pluripotency, cell viability and growth. PLoS One. 2013;8(7):e70267.