
ABSTRACT
Mitochondria are important regulators of tumour growth and progression due to their specific role in cancer metabolism and modulation of apoptotic pathways. In this paper we describe that mitochondria-targeted antioxidant SkQ1 designed as a conjugate of decyl-triphenylphosphonium cation (TPP+) with plastoquinone, suppressed the growth of fibrosarcoma HT1080 and rhabdomyosarcoma RD tumour cells in culture and tumour growth of RD in xenograft nude mouse model. Under the same conditions, no detrimental effect of SkQ1 on cell growth of primary human subcutaneous fibroblasts was observed. The tumour growth suppression was shown to be a result of the antioxidant action of low nanomolar concentrations of SkQ1. We have revealed significant prolongation of mitosis induced by SkQ1 in both tumour cell cultures. Prolonged mitosis and apoptosis could be responsible for growth suppression after SkQ1 treatment in RD cells. Growth suppression in HT1080 cells was accompanied by the delay of telophase and cytokinesis, followed by multinuclear cells formation. The effects of SkQ1 on the cell cycle were proved to be at least partially mediated by inactivation of Aurora family kinases.
Abbreviations: TPP+: Triphenylphosphonium cation; ROS: Reactive oxygen species; mtROS: Mitochondrial reactive oxygen species; NAC: N-acetyl-L-cysteine; DCFH-DA: Dichlorodihydrofluorescein diacetate; APC: Anaphase promoting complex; ABPs: Actin-binding proteins; DMEM: Dulbecco’s modified Eagle media; SDS: sodium dodecyl sulfate; HEPES: 4-(2-hydroxyethyl)-1-piperazineethanesulfonic acid
Introduction
The reactive oxygen species (ROS) are known to affect signaling pathways mediating cell division, differentiation, migration and cell death. Mitochondria are playing essential roles in ROS production and regulation of signal transduction [Citation1]. The role of ROS and redox homeostasis in tumor progression is controversial. Cancer cells are often characterized by elevated level of ROS and an altered redox potential compared to normal cells [Citation2]. ROS production stimulates cell proliferation, motility, and pro-survival signaling pathways contributing to tumorigenesis. On the other hand, ROS are involved in the antitumor defense via control of apoptosis and cellular senescence.
Mitochondria are important regulators of tumor growth and progression due to their specific role in cancer metabolism and modulation of apoptotic pathways. Mitochondrial-targeted agents have emerged as promising pharmacological alternatives for cancer therapy [Citation3]. An attachment of alkyl-triphenylphosphonium cation (TPP+) to different drugs has become a well-established approach to obtain mitochondria-targeted agents. Significant number of alkyl-TPP+ conjugates has been studied for anticancer therapy [Citation3]. Delocalized lipophilic cations (such as alkyl-TPP+ derivatives) electrophoretically accumulate in mitochondria of cancer cells, since these cells exhibit a considerably higher mitochondrial membrane potential than non-transformed cells [Citation4].
Reactive oxygen species produced by mitochondria (mtROS) could be of special importance for pro-tumorigenic signaling [Citation5]. Several mitochondria-targeted antioxidants designed as conjugates of decyl-TPP+ with plastoquinone (SkQ1) [Citation6–Citation8], decyl-TPP+ with thymoquinone (SkQT1) [Citation9], decyl-TPP+ with coenzyme Q10 (MitoQ) [Citation10], nitroxides (Mito-CP) [Citation11] or a vitamin E analog (Mito-chromanol) [Citation12], inhibited the tumor cell proliferation in vitro and the growth of tumor xenografts in vivo. Antitumor effect of MitoQ, Mito-CP and Mito-chromanol used in these studies at high concentrations was mediated primarily by prooxidant action of these compounds. We used low nanomolar concentrations of mitochondria-targeted antioxidant SkQ1 that decreased mtROS to study whether a suppression of tumor growth could be a result of the antioxidative SkQ1 action.
We evaluated the contribution of mtROS in cell cycle regulation of fibrosarcoma and rhabdomyosarcoma cells targeting their mitochondria with antioxidant SkQ1. We showed for the first time that scavenging of mtROS with SkQ1 inhibited the growth of tumor HT1080 and RD cells in vitro and the growth of RD tumor xenografts in vivo.
Results
SkQ1 treatment changed actin cytoskeleton organization in sarcoma HT1080
In human cells non-muscle actin exists as two protein isoforms: β- and γ-actin [Citation13]. Cytoplasmic actins are organized in different cytoskeletal structures and responsible for distinct cell functions. β-Actin is connected to contraction, motility and adhesion, whereas γ-actin is predominantly organized in cortical and lamellar networks essential for cell shape maintenance and cell motility [Citation14,Citation15].
Morphology of HT1080 fibrosarcoma cells is heterogeneous. In most HT1080 cells β-actin formed blebbs and raffles at the cell perimeter, that indicated the instability of the cell edge. Apical γ-actin network clearly identified cortical structures and edge ruffles (). Cultivation of these cells with SkQ1 induced reorganization of actin cytoskeleton of HT1080 as well as RD cells. SkQ1 stimulated formation of β-actin stress fibers in the center and along the perimeter of cells, decreased β-actin cytoplasm staining in the periphery, which could lead to stabilization of the cell edge. Dense γ-actin network and bundles especially pronounced at the periphery of HT1080 cells were identified after SkQ1 treatment ().
Figure 1. SkQ1 induced changes in cell morphology and actin organization in НТ1080. β-actin and γ-actin staining in the control and SkQ1-treated (40 nM,72 hours) HT1080 cells; immunofluorescence microscopy, scale bar 10 μm.
In human non-muscle cells γ-actin is organized in cortical and lamellar networks, participating in raffles and lamellipodia formation. We used γ-actin immunostaining to identify changes in cell area and morphology in the presence of SkQ1. HT1080 cells became more spread as a result of incubation with SkQ1: the average occupied area of control cells was 698 ± 106 μm2, area of cells treated with SkQ1 (40 nM, 72 hours) was 1615 ± 175 μm2 (p < 0.05; only mononuclear cells were measured).
Antioxidants NAC (1mM) and Trolox (100µM) induced similar actin network reorganization in HT1080 cells (data not shown).
SkQ1 suppressed proliferation of HT1080 and RD cells
SkQ1 significantly inhibited the growth of HT1080 and RD cell cultures (, ). Death of HT1080 cells was not pronounced, while the population of apoptotic cells in RD could be visually observed and detected with FACS analysis (see next section).
Figure 2. SkQ1 suppressed proliferation and increased population of multinucleated cells in HT1080 and RD. A. SkQ1 (20 nM, 40 nM) inhibited proliferation of HT1080 cells compared to control and C12TPP (40 nM); statistical analysis of phase contrast microscopy. B. SkQ1 (20 nM, 40 nM) inhibited proliferation of RD cells compared to control and C12TPP (40 nM); statistical analysis of phase contrast microscopy. C. Multinucleated HT1080 cells after incubation with SkQ1 (20 nM, 48 hours); green – β-actin, blue – DNA; immunofluorescence microscopy, scale bar 10μm. D. SkQ1 (20 nM, 40 nM, 48 hours) increased population of multinucleated cells in HT1080; statistical analysis of immunofluorescence microscopy. Student t-test, (**) for p < 0.01, (***) for p < 0.001. E. An enhancement of multinucleated cells’ population in RD after SkQ1 (20 nM, 40 nM, 72 hours) treatment; statistical analysis of immunofluorescence microscopy. Student t-test, (**) for p < 0.01, (***) for p < 0.001.
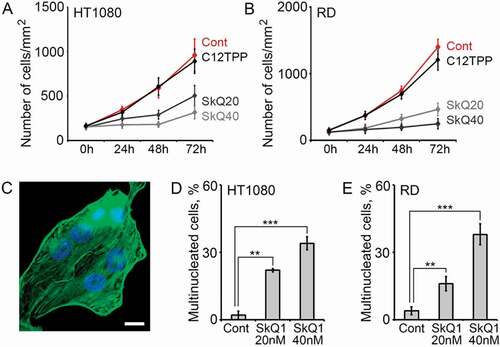
C12TPP, a molecule structurally related to SkQ1 but without antioxidant (plastoquinone) group, did not influence proliferation and ploidy of HT1080 and RD cells (, ). Antioxidants NAC (1mM) and Trolox (0.1mM) also suppressed the growth of RD cells (Supplemental Figure 1A). Uncoupler FCCP is known to dissipate mitochondrial membrane potential and therefore prevent accumulation of SkQ1 in mitochondria [Citation16]. In our study FCCP (5µM) prevented SkQ1-induced growth inhibition of RD cells (Supplemental Figure 1A) supporting the conclusion on the critical role of mitochondrial ROS in proliferation of RD cells. These data stimulated the further studies of SkQ1 effect on the cell cycle parameters.
SkQ1 enhanced population of multinucleated cells in HT1080 and RD cultures (). Amount of multinucleated cells (predominantly binuclear for HT1080) increased more than 10-fold after incubation with SkQ1 (, ). This might be explained assuming that SkQ1 induces some dramatic changes in mitosis.
SkQ1 induced changes in cell cycle of HT1080 cells
Flow cytometry analysis revealed that SkQ1 treatment entailed a decrease in G1 cell (2n) population (Student t-test, р < 0.01) and significantly increased 4n population (Student t-test, р < 0.01) of HT1080 cells (, ). Population of 4n cells may correspond to G2/M stage or to the presence of polyploid cells. We estimated the number of mitoses in the human fibrosarcoma HT1080 cells after SkQ1 treatment.
Figure 3. SkQ1 induced cell cycle changes in НТ1080 and RD. A. Cell cycle analysis of the control and SkQ1-treated HT1080 cells (10 nM, 20 nM, 40 nM, 24 hours). Statistically significant difference of data by Student t-test was demonstrated for G1 and G2/M periods after 20 nM (р < 0.05) and 40 nM (р < 0.01) SkQ1 treatment as compared with control. B. Cell cycle analysis of control and SkQ1-treated HT1080 cells (40 nM, 96 hours). Statistically significant difference of data by Student t-test (р < 0.01) was demonstrated for G1 and G2/M periods C. SkQ1 increased apoptotic, < 2n (р < 0.01) and decreased G1 (р < 0.05) cell populations in RD. D. Cell cycle analysis of control and SkQ1-treated (24 hours) HSCF cells. Flow cytometry analysis after staining with propidium iodide. Data are mean ± SEM.
In RD cells SkQ1 induced significant (more than three-fold) increase of apoptotic cell population (Student t-test, р < 0.01). (). Apoptosis play a critical role in suppression of RD growth since pan-caspase inhibitor zVAD-fmk and inhibitor of executive caspase DEVD-fmk (data not shown) restored viability of cell population in the presence of SkQ1 (Supplemental Figure 1B). Apoptosis of RD cells induced by SkQ1 (40 nM) was not related to possible prooxidant action of SkQ1. Antioxidant action of SkQ1 was confirmed using dichlorodihydrofluorescein diacetate (DCFH-DA) staining and flow cytometric analysis. We demonstrated that scavenging of mtROS with SkQ1 resulted in downregulation of intracellular hydrogen peroxide in RD cells (41.2 ± 7.4% decrease after incubation with SkQ1 as compared with control cells, mean ± SEM, p < 0.01). Moreover, non-targeted antioxidants NAC (1mM) and Trolox (0.1 mM) also suppressed viability of RD cells (Supplemental Figure 1A).
Cell cycle of primary human subcutaneous fibroblasts was not affected by SkQ1 treatment (). This is probably correlates with the lack of a noticeable decrease in the ROS level in fibroblasts after SkQ1 treatment [Citation17].
SkQ1 suppressed mitosis in HT1080 cells
Immunofluorescence analysis revealed a decrease of the mitotic cells number in SkQ1-treated HT1080 cells (). The rate of mitoses in partially synchronized by serum deprivation HT1080 cells (Materials and Methods, “Cell synchronization” for details) was found to decrease more than 3-fold after incubation with SkQ1 (42 h). The same effect was observed after 90 hours ().
Figure 4. SkQ1 induced changes in number and characteristics of mitosis in HT1080 cells. A. Reduction of mitotic cell population by SkQ1 (40 nM C12ТРР, 40 nM SkQ1, 24 and 96 hours). B. SkQ1 (40 nM, 42 and 90 hours) diminished mitotic cell population in partially synchronized by serum deprivation cell culture. C. SkQ1 (40 nM, 72 hours) induced changes in phase duration of morphologically normal mitoses (P – prophase, М – metaphase, А – anaphase, Т – telophase). D. SkQ1 (40 nM, 72 hours) induced changes in phase duration of prolonged mitoses. E. SkQ1 (20 nM, 72 hours) caused prolonged mitoses in mitotic cell population. F. SkQ1 (40 nM, 24 hours) induced changes in distribution of dividing cells over mitotic phases (nТ – normal telophase, aT – asymmetrical in shape telophase).
Thus, we concluded that increase of 4n population in the presence of SkQ1 was a result of the polyploidy, but not of the possible rise of mitotic cell amount.
SkQ1 induced prolonged mitosis in HT1080 and RD cells
In the next series of experiments, HT1080 and RD cells were studied using life time-lapse microscopy to analyze the composition of 4n population revealed by flow cytometry.
In control HT1080 cells we detected population of cells with delay in mitosis at telophase/cytokinesis stages and asymmetrical in shape (we named it “prolonged mitosis” hereafter). The daughter cells markedly differed in size and shape with numerous active pseudopodia and blebs.
In all dividing cells the length of mitotic phases, in particular telophase/cytokinesis, was found to increase after incubation with SkQ1. Telophase/cytokinesis duration in control cells with normal cell division was 37.9 ± 3.3 min, in cells with prolonged mitosis was 169.3 ± 6.2 min. Treatment with SkQ1 increased telophase/cytokinesis duration more than twice in both normal and prolonged mitosis cell population. Duration of prophase and metaphase was also increased more than 1,5 times as a result of SkQ1 treatment (, ).
Dynamic observations revealed that SkQ1 lead to significant increase of prolonged mitoses percentage in HT1080 cells. Proportion of prolonged mitoses in cells incubated with SkQ1 was 60.9 ± 18.9% compared with 7.3 ± 3.0% in control cells ().
Immunofluorescent microscopy of HT1080 cells revealed that SkQ1 changed the distribution of dividing cells over mitotic phases (). SkQ1 treatment caused 4,5-fold increase in the number of asymmetrical in shape mitotic cells with prolonged telophase/cytokinesis and about 2 times decrease in the number of normal mitotic cells.
Time-lapse microscopy of RD cells indicated significant increase in the telophase/cytokinesis duration in the presence of SkQ1: it was 27.2 ± 2.0 min in control, and 193.8 ± 10.5 min after incubation with SkQ1 (40 nM, 24 hours). SkQ1 induced the appearance of cells with apoptotic features. This cell population included some mitotic cells with prolonged telophase/cytokinesis, suggesting a mitotic catastrophe in RD cells after SkQ1 treatment.
These data indicated a significant increase in mitosis duration induced by SkQ1 in HT1080 and RD tumor cells. Prolongation in prophase and metaphase, telophase/cytokinesis delay of mitotic tumor cells after incubation with SkQ1 were revealed. This effect of SkQ1 on mitotic cells could be responsible for the growth decrease of neoplastically transformed cells.
SKQ1 decreased tumor growth of RD cells in xenograft nude mouse model
Subcutaneous RD tumours in xenograft nude mouse model grew slower with SkQ1 compared to control. SkQ1 reduced the mass and volume of 10-day tumours; 20-day tumours were 2 times smaller in volume in animals receiving SkQ1 than in control group (, ).
Figure 5. SkQ1 effected tumour growth of RD cells in xenograft nude mouse model. A. SkQ1 (250 nM/kg, once every 2 days, 20 days after tumour grafting) downregulated the weight of subcutaneous tumours in xenograft nude mouse model. B. SkQ1 (250 nM/kg, once every 2 days) downregulated volume of subcutaneous tumours in xenograft nude mouse model, p < 0.05.
SkQ1 changed distribution and expression of cell cycle regulators in HT1080 and RD cells
Dynamic observations of mitosis delay in HT1080 cells indicated the possible effects of SkQ1 on anaphase promoting complex (APC). Activated APC regulates cell transition from metaphase to anaphase and is responsible for the final events in mitosis through the inactivation of cyclin-dependent kinases. At the end of mitotic division APC regulates ubiquitination of Aurora family kinases and completes cytokinesis process [Citation18,Citation19]. In the next experiments localization, amount and activity of Auroras A, B, and C in HT1080 cells were studied and compared with SkQ1-treated cells.
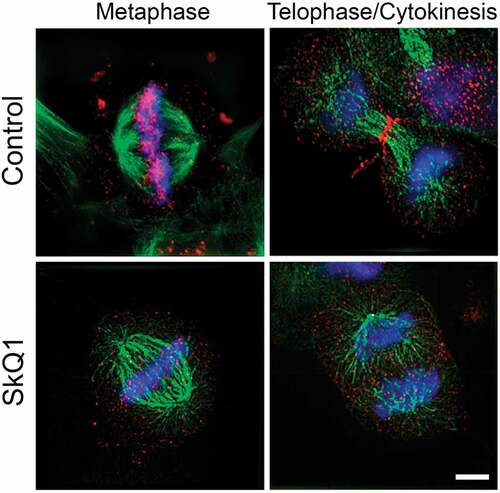
We used immunofluorescence microscopy () and super-resolution SIM microscopy () to reveal the distribution of Aurora B kinase in mitotic cells with or without SkQ1. In metaphase of control HT1080 cells Aurora B had diffuse distribution in chromosome area. SkQ1 treatment stimulated localization of Aurora B as compact, dotted structures in chromosome region (). In anaphase of both control and experimental cells Aurora B was localized in the equatorial region (data not shown). In the stage of telophase/cytokinesis Aurora B formed point structures in the furrow area in both control and SkQ1-treated cells (). We observed a decrease in fluorescence intensity of Aurora B as a result of incubation with SkQ1 (). Especially noticeable difference of Aurora B immunofluorescence was observed at metaphase and telophase/cytokinesis stages (, ).
Figure 6. SkQ1 influenced the distribution and activation of Aurora family kinases and Rb in НТ1080 cells. A. Aurora B distribution in the mitotic HT1080 cells after SkQ1 (40 nM, 24 h) treatment; blue – DNA, red – Aurora B; immunofluorescence microscopy. B. Measurements of Aurora B fluorescence intensity in the mitotic НТ1080 cells (М – Metaphase, Т – Telophase/Cytokinesis), SkQ1 (40 nM, 24 h), average fluorescence intensity/100 µm2 ± SEM. C. SkQ1 (40 nM, 24 h) didn’t induce changes in mitotic cells number in HT1080 cells after colcemide (0.02 µg/ml, 24 h) treatment. D. Phospho-Auroras A, B, C and phospho-Rb (Ser807/811) in НТ1080 after colcemide (0.02 µg/ml, 24 h) and SkQ1 (100 nM, 24 h) treatment.
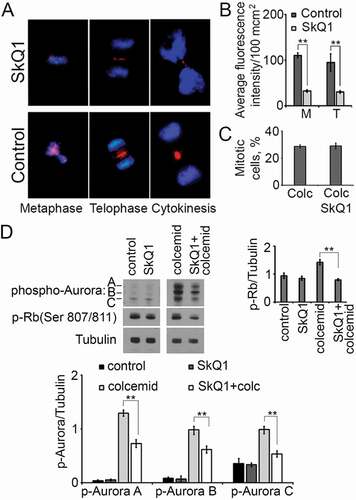
Figure 7. The effect of SkQ1 on distribution of Aurora B kinase in the dividing НТ1080 cells. Aurora B distribution in mitotic HT1080 cells after SkQ1 (40 nM, 24 h) treatment; red – Aurora B, green – a-tubulin, blue – DNA; super-resolution microscopy 3D-SIM. Images represent maximal-intensity projections, scale bar 5 µm.
We used western blotting assay to analyze the active phosphorylated state of Aurora family kinases. Сolcemide (0.02 μg/ml) was used to achieve the enrichment of cell culture by mitotic fraction, as Auroras are used during mitosis mainly. As a result of colcemide incubation, the level of phosphorylated Aurora A/B/C was quite high in the synchronized HT1080 cells. SkQ1 treatment significantly decreased amount of phosphorylated Aurora A/B/C in partially synchronized HT1080 cells (). The rate of mitotic cells in control and SkQ1-treated (24h) synchronized cells proved to be similar (). The amount of Aurora B protein decreased in the both unsynchronized and synchronized RD cells after SkQ1 treatment (Supplemental Figure 1E).
Inhibition of Aurora B results in down-regulation of E2F-mediated transcription and cell cycle arrest which depends on p53 and retinoblastoma protein (Rb) tumour suppressor pathways [Citation20]. The Rb pathway has well characterized roles in the regulation of S phase entry, but it also regulates the later stages of the cell cycle and apoptosis. SkQ1 reduced the amount of phosphorylated Rb in the synchronized HT1080 cells (), whereas the total Rb amount remained unchanged (data not shown).
Discussion
We have demonstrated that SkQ1 treatment inhibited the growth of fibrosarcoma and rhabdomyosarcoma cells. Previously we have shown inhibition of cell proliferation induced by SkQ1 in other tumour cultures [Citation6,Citation7]. Growth suppression in HT1080 cells was accompanied by decreased number of mitoses and multinucleation, that indicated problems with mitosis exit. In RD cells we identified increased apoptosis that could be responsible for growth inhibition after SkQ1 treatment. Lipophilic cation C12TPP without plastoquinolyl residue did not influence proliferation and ploidy of HT1080 and RD cells. Non-targeted antioxidant NAC (1 mM) had similar growth inhibition action on HT1080 and RD cells. SkQ1 had no detrimental effect on normal human subcutaneous diploid fibroblasts growth.
In addition to the growth inhibition, mitochondria-targeted antioxidant SkQ1 induced dramatic changes in the morphology of HT1080 tumour cells. Cytoplasmic β- and γ-actin cytoskeleton rearrangement was accompanied by cell area enlargement.
The isoform-specific actin cytoskeleton reorganization regulates distinct cell cycle perturbations due to interplay between cytoplasmic actins, MAP-kinases and other cell cycle regulators [Citation15]. The relative abundance and organization of cytoplasmic β- and γ-actins are changed during cell transformation and tumour progression [Citation7,Citation21]. Moreover, cytoplasmic β-actin acts as a tumour suppressor, inhibiting cell growth and invasion in vitro and tumour growth in vivo. In contrast, γ-actin increases the oncogenic potential via ERK1/2, actin-binding proteins (ABPs) and some other regulatory proteins [Citation15].
In contrast to proliferation, previously it was shown that incubation of normal human subcutaneous diploid fibroblasts with SkQ1 induced similar changes in cell morphology and actin cytoskeleton organization [Citation17]. These data indicated activation of the Rho-ROCK pathway by SkQ1, whereas the mechanism of ROS-induced inhibition of Rho in RAS-transformed fibroblasts was described [Citation22]. Fibroblasts transfected with a construct containing N-RAS had more transformed phenotype compared with the non-transfected parent cells [Citation23]. Transformation of p53-/- mouse fibroblasts by oncogene N-RAS caused strong decrease in cell area, induced dissipation of actin stress fibers and related vinculin-positive focal adhesions. Treatment of the RAS-transformed fibroblasts with SkQ1 caused restoration of actin stress fibers, focal adhesion contacts, and enlargement of cell area [Citation6]. Tumour phenotype of human fibrosarcoma HT1080 cells is caused by activated N-RAS oncogene [Citation24]. Activated RAS increases intracellular ROS [Citation25,Citation26]. We conclude that scavenging of mitochondrial ROS by SkQ1 induced Rho-dependent reorganization of actin cytoskeleton in HT1080 cells. An antioxidant NAC induces similar morphology changes and normalization of cell motility in RAS-transformed fibroblasts via modulation of Rac1, Rho, and cofilin activity [Citation27].
To examine whether HT1080 and RD cells progressed through mitosis in a regular fashion, we scored the dividing cells according to their phases in mitosis (prophase, metaphase, anaphase or telophase) and cytokinesis. We revealed prolongation mitosis and cytokinesis after incubation with SkQ1. SkQ1 dramatically increased the number of asymmetrical in shape mitotic cells with prolonged telophase/cytokinesis and decreased the number of normal mitotic cells. In RD population of cells with morphological features of apoptosis was indicated after SkQ1 treatment. Enhancement of apoptosis in RD cells was not the result of oxidative action inherent in SkQ1 at higher concentrations [Citation8], which was confirmed with DCFH-DA and flow cytometry analysis.
We examined localization, amount and activity of Aurora family kinases responsible for the mitosis and cytokinesis progression. Aurora kinases are represented by three protein isoforms (A, B and C) which are considered to be a perspective molecular targets for cancer therapy [Citation28]. Increased expression of Aurora A and B leads to genetic instability and tumour progression [Citation29], the role of Aurora C is poorly understood. SkQ1 reduced the phosphorylation of all three Aurora family kinases, thereby apparently suppressed their activity.
Aurora A regulates cell entry into mitosis, controls centrosome maturation, duplication, separation and spindle assembly in mitosis [Citation30]. Low Aurora A activity causes mitotic arrest at the G2/M stage and spindle disassembly [Citation31]. A delay of pro- and metaphase in mitotic HT1080 cells could be a result of decreased activity of Aurora A kinase induced by SkQ1.
Cytokinesis is a final stage of cell division and precise event for daughter cell separation after chromosome separation. Population of the multinucleated HT1080 cells could be a result of incomplete cytokinesis. Cytokinesis is regulated by several protein kinases, such as Aurora-B and Rho-kinase/ROCK. Aurora-B functions in both early and late mitotic events, chromosome segregation/condensation, and cytokinesis. Aurora-B and Rho-kinase/ROCK regulate the progression of cytokinesis without communicating to each other at the cleavage furrow [Citation32]. Suppression of Aurora-B by siRNA or inhibitor causes multinucleation [Citation33] as well as Rho-kinase/ROCK depletion, the effect of double depletion was additive [Citation32]. Inhibition of Aurora B kinase activity in breast cancer cells causes polyploidy, apoptosis and mitotic catastrophe, and efficiently suppresses the tumour growth in a xenograft model [Citation34]. We observed a decrease of Aurora B kinase and active phosphorylated Aurora A/B/C proteins after SkQ1 treatment. Aurora-B kinase could be responsible for HT1080 multinucleation and growth suppression, as we proposed that scavenging of mitochondrial ROS with SkQ1 induced Rho signaling in HT1080 cells.
Aurora C is expressed in germ cells, playing a role in meiosis analogous to Aurora B in mitosis [Citation35]. Aurora C contributes to breast cancer cell transformation, but its role in carcinogenesis is still unclear [Citation36]. Our data confirms the regulatory function of Aurora C in mitosis of cells with activated N-RAS oncogene.
SkQ1 reduced the amount of phosphorylated retinoblastoma protein Rb in synchronized HT1080 and RD cells. Rb plays important roles in the regulation of cell proliferation, differentiation, senescence, and apoptotic cell death. The role of Rb in tumour progression is controversial, as it acts as inhibitor of both cell growth and cell death.
Rb plays a central role in the inhibition of cell proliferation, so tumour development often involves Rb inactivation [Citation37]. Rb is known to be inactivated by different mechanisms, including phosphorylation and degradation. Most sporadic human cancers inactivate Rb function by exploiting pathways that regulate Rb phosphorylation [Citation37]. Consequently, active proliferation of HT1080 cells may be induced by phosphorylation-dependent Rb inactivation. SkQ1 significantly decreased the amount of phosphorylated Rb in synchronized HT1080 cells and thereby downregulated proliferation.
We propose that in both studied cell cultures SkQ1 induced mitotic catastrophe via distinct signaling pathways. Mitotic catastrophe is an oncosuppressive mechanism that senses mitotic failure leading to cell death or senescence. Following a prolonged mitotic arrest, cells either die in mitosis via apoptosis, or exit mitosis without dividing and survive, a process known as mitotic slippage [Citation38]. It protects against aneuploidy and genetic instability, and its induction in cancer cells by exogenous agents can be a promising therapeutic end point [Citation39].
Summarizing, SkQ1 was found to inhibit the growth of tumour HT1080 and RD cells. The cytostatic SkQ1 effect was at least in part caused by decreased activity of Aurora family kinases.
Materials and methods
Cells
HT1080 (ATCC#CCL-121) human fibrosarcoma cell line with a single endogenous mutant N-RAS allele [Citation40], RD (ATCC#CCL-136) human rhabdomyosarcoma cell line [Citation41] and HSCF (primary human subcutaneous diploid fibroblasts from cell culture collection, Institute of Medical Genetics, Russian Academy of Sciences, Moscow) were used. The cells were maintained in DMEM (Dulbecco’s Modified Eagle’s Medium, Gibco) supplemented with 10% FBS (HyClone) and 5 mM of glutamic acid (PanEco) at 37°C in the air atmosphere containing 5% CO2.
Chemicals
SkQ1 [10-(6'-plastoquinonyl) decyltriphenylphosphonium] is a conjugate of decyl-TPP+ with the plant electron carrier and antioxidant plastoquinone [Citation16]. C12TPP is a structurally related to SkQ1 molecule lacking quinone moiety. NAC (Sigma) was used in concentration 1 mM. 20 µM of caspase inhibitors DEVD (Sigma) and zVAD-fmk (Sigma) were used for 24 hours. 5 µM FCCP [carbonyl cyanide p-trifluoromethoxyphenylhydrazone] (Sigma) was used. Colcemide (Sigma) 0,02 – 0,8 µg/ml was used (Supplemental Figure 1C, 1D).
Cell culture growth rate
The cells were seeded into Petri dishes and cell count was performed each day using phase contrast microscopy on Axioplan (Zeiss) microscope with 20х/0.50 Plan-Neofluar lenses. At least 20 view fields were analyzed.
Cell cycle analysis
After 24–96 hours of incubation the cells were collected for cell cycle analysis. Cells were harvested, washed with PBS and fixed with ice-cold 80% ethanol (1:2), incubated overnight at 4°C and stored at 4°C until analyzed by flow cytometry. Briefly, the cells were spun down to remove the ethanol, washed with PBS and stained with 30 µg/ml Propidium Iodide (MP Biomedicals, France) and 10 ng/ml RNase A (Fermentas, Lithuania) in PBS for 45 min at 37°C in the dark. At least 20,000 of cells per sample were analyzed using Beckman Coulter Cytomics FC500 flow cytometer.
Measurement of intracellular ROS
For the intracellular ROS measurement RD cells were incubated in serum-free DMEM medium with 1.8 µM DCFH-DA (2´,7´ - dichlorodihydrofluorescein diacetate, Invitrogen) for 10 minutes at 37°C in the dark. After the oxidation by ROS, dichlorodihydrofluorescein is transformed to the highly fluorescent dichlorofluorescin (DCF). Then cells were detached with the trypsin-EDTA solution and ROS accumulation was measured by flow cytometry with Beckman Coulter Cytomics FC500.
Cell synchronization
We used two cell synchronization methods. (1) The cells were incubated in the serum-free medium for 24 hours to enrich the cultures with mitosis without chemical treatment. The cells were passaged after 24 hours of serum deprivation and incubated in fresh medium containing serum for 13–24 hours before analysis. (2) We also used 0.02 µg/ml of colcemide to enrich the cultures with mitosis. The cells were passaged and after 3 hours we added colcemide to the medium for 24 hours. The cells were then rinsed once with fresh medium and then incubated in fresh medium for 1 hour.
Antibodies
The following antibodies were used: mouse monoclonal antibodies against cytoplasmic β-actin (µA5775GA, AbD Serotec), γ-actin (µA5776GA, AbD Serotec), α-tubulin (Cell Signaling), α-tubulin (clone DM1A, Sigma), Rb (Cell Signaling), rabbit antibodies against Aurora B (Cell Signaling), phospho-Auroras A/B/C (Cell Signaling), phospho-Rb (Ser795) (Cell Signaling), phospho-Rb (Ser 807/811) (Cell Signaling), CENP-A (Cell Signaling). The following secondary antibodies were used: AlexaFluor488-, AlexaFluor594-, goat anti-mouse IgG1, IgG2b, IgG and goat anti-rabbit IgG (Jackson ImmunoResearch Laboratories. Inc).
Immunofluorescence and structured illumination microscopy
For immunofluorescent staining the cells were cultivated on cover glasses and washed with DMEM containing 20 mM HEPES at 37°C. Cells were fixed for 15 min with 1,5% paraformaldehyde on a serum-free DMEM (with 20 mM HEPES) at room temperature. Then the cells were extracted and fixed with cold MeOH at −20°С for 5 min (for antibodies staining) or permeabilized with 0.1% triton X-100 in PBS containing 0.5 mM CaCl2 and 3 mM MgCl2 for 3 min at room temperature (for DAPI and phalloidin staining). DAPI (Sigma) was applied for nuclear staining. Total F-actin was stained with rhodamine-conjugated phalloidin (Sigma). Immunofluorescence was observed using Axioplan microscope (Zeiss) with 40×/0.75 and 63х/1,25 Plan-Neofluar lenses with oil immersion.
DAPI and rhodamine-conjugated phalloidin staining were used to analyze mitotic rate and evaluate the number of cells on different mitotic stages (500 cells/per condition, three independent experiments).
Fluorescence intensity of Aurora B was measured with Image J 1,37C (NIH, http://rsb.info.nih.gov/ij/) software in square of 100 µm2 in the cell area, where the protein was localized. For each experimental condition at least 30 fields of view were examined.
Structured illumination microscopy (3D-SIM) was performed using a Nikon N-SIM (Nikon) with 100x/1.49 NA oil immersion objective, 488 nm and 561 nm diode laser excitation. Image stacks (z-steps of 0.12μm) were acquired with EµCD camera (iXon 897, Andor, effective pixel size 60 nm). Serial optical sections of the same cell taken in wide-field mode were deconvolved using the AutoQuant blind deconvolution algorithm. Image acquisition, SIM image reconstruction and data alignment were preformed using NIS-Elements 4.2 software (Nikon).
Live cells imaging
The cells were cultivated on cover glasses in glass chambers for 24 hours before monitoring. The cells were analyzed with phase contrast using Opton microscope and 40х/1,0 Planapo lens with oil immersion. Time-lapse video imaging (slowing down 120 times) with Hamamatsu C2400-01 camera was used for dynamic observations. Studio Launcher software was used for image processing. At least 30 mitotic cells were analyzed for each experimental condition to calculate duration of mitotic phases.
Western blot analysis
Cells were extracted with cold sample buffer (62.5mM Tris-HCl, pH 6.8, 2% sodium dodecyl sulfate (SDS), 10% glycerin, 50 mM dithiothreitol, 0.01% bromophenol blue). Lysates were separated in 10% SDS polyacrylamide gel and transferred onto polyvinylidene fluoride membrane (Amersham GE Healthcare). After blocking the nonspecific binding by bovine serum albumin, the membranes were incubated with specific antibodies. We used α-tubulin as a loading control. The membranes were incubated with secondary antibodies bound with horseradish peroxidase (Amersham GE Healthcare). The membranes were developed using the chemiluminescence technique with ECL reagents (Amersham GE Healthcare) according to producer’s protocol. The resulting films were scanned or produced with ChemiDoc MP (BioRad) and analyzed densitometrically with ImageJ 1,37C (NIH, http://rsb.info.nih.gov/ij/) and Image Lab (BioRad) software.
Xenograft model
We used immunodeficient athymic mice to study the effect of SkQ1 on RD tumour growth in xenograft model. Briefly, female D2 × J nude mice (the age 6–8 weeks) were inoculated subcutaneously with two distinct tumours (106 RD cells suspended in 100 µl of PBS). Half of the experimental animals received 250 nmol/kg of SkQ1 once every two days, the substance was injected into the esophagus via catheter.
The monitoring of tumour formation was started at day 7–10 after injection and was performed every 3 days with a digital caliper. Xenograft volumes were calculated as (width)2 ×(length) × 0.5. After 3 weeks of observation the explanted tumours were isolated and analyzed. The animal experimental protocols were approved by the Committee for Ethics of Animal Experimentation and the experiments were conducted in accordance with the Guidelines for Animal Experiments in Russian Blokhin Cancer Research Center.
Statistical analysis
Results are presented indicating mean ± standard error of the mean of at least three independent experiments. Intergroup differences were analyzed by the Mann–Whitney U test or Student’s t-test when applicable. Values of p < 0.001 (***), p < 0.01 (**), and p < 0.05 (*) were considered as statistically significant.
Supplemental Material
Download MS Word (179 KB)Acknowledgments
We thank to the Lomonosov MSU development program 5.13.
Disclosure statement
No potential conflict of interest was reported by the authors.
Supplemental material
Supplemental data for this article can be accessed here.
Additional information
Funding
Related Research Data
References
- Chandel NS. Mitochondria as signaling organelles. BMC Biol. 2014;12:34.
- Fruehauf JP, Meyskens FL. Reactive oxygen species: a breath of life or death? Clin. Cancer Res. 2007;13:789–794.
- Guzman-Villanueva D, Weissig V. Mitochondria-Targeted Agents: mitochondriotropics, Mitochondriotoxics, and Mitocans. Handb Exp Pharmacol. 2017;240:423–438.
- Modica-Napolitano JS, Aprille JR. Delocalized lipophilic cations selectively target the mitochondria of carcinoma cells. Adv Drug Deliv Rev. 2001;49:63–70.
- Sabharwal S, Schumacker P. Mitochondrial ROS in cancer: initiators, amplifiers or an Achilles’ heel? Nat Rev Cancer. 2014;14:709–721.
- Agapova LS, Chernyak BV, Domnina LV, et al. Mitochondria-targeted plastoquinone derivatives as tools to interrupt execution of the aging program. 3. Inhibitory effect of SkQ1 on tumor development from p53-deficient cells. Biochemistry (Mosc). 2008;73:1300–1316.
- Shagieva G, Domnina L, Makarevich O, et al. Depletion of mitochondrial reactive oxygen species downregulates epithelial-to-mesenchymal transition in cervical cancer cells. Oncotarget. 2017;8:4901–4913.
- Skulachev VP, Anisimov VN, Antonenko YN, et al. An attempt to prevent senescence: A mitochondrial approach. Biochim Biophys Acta Bioenerg. 2009;1787:437–461.
- Severina II, Severin FF, Korshunova GA, et al. In search of novel highly active mitochondria-targeted antioxidants: thymoquinone and its cationic derivatives. FEBS Lett. 2013;587:2018–2024.
- Rao VA, Klein SR, Bonar SJ, et al. The antioxidant transcription factor Nrf2 negatively regulates autophagy and growth arrest induced by the anticancer redox agent mitoquinone. J Biol Chem. 2010;285:34447–34459.
- Starenki D, Park J-I. Mitochondria-targeted nitroxide, Mito-CP, suppresses medullary thyroid carcinoma cell survival in vitro and in vivo. J Clin Endocrinol Metab. 2013;98:1529–1540.
- Cheng G, Zielonka J, McAllister DM, et al. Mitochondria-targeted vitamin E analogs inhibit breast cancer cell energy metabolism and promote cell death. BMC Cancer. 2013;13:285.
- Vandekerckhove J, Weber K. At least six different actins are expressed in a higher mammal: an analysis based on the amino acid sequence of the amino-terminal tryptic peptide. J Mol Biol. 1978;126:783–802.
- Dugina V, Zwaenepoel I, Gabbiani G, et al. Beta and gamma-cytoplasmic actins display distinct distribution and functional diversity. J Cell Sci. 2009;122:2980–2988.
- Dugina V, Khromova N, Rybko V, et al. Tumor promotion by γ and suppression by β non-muscle actin isoforms. Oncotarget. 2015;6:14556–14571.
- Antonenko Y, Avetisyan A, Bakeeva L, et al. Mitochondria-targeted plastoquinone derivatives as tools to interrupt execution of the aging program. 1. Cationic plastoquinone derivatives: synthesis and in vitro studies. Biochem (Mosc). 2008;73:1273–1287.
- Popova EN, Pletjushkina OY, Dugina VB, et al. Scavenging of Reactive Oxygen Species in Mitochondria Induces Myofibroblast Differentiation. Antioxid Redox Signal. 2010;13:1297–1307.
- Littlepage LE, Ruderman JV. Identification of a new APC/C recognition domain, the A box, which is required for the Cdh1-dependent destruction of the kinase Aurora-A during mitotic exit. Genes Dev. 2002;16:2274–2285.
- Stewart S, Fang G. Destruction box-dependent degradation of aurora B is mediated by the anaphase-promoting complex/cyclosome and Cdh1. Cancer Res. 2005;65:8730–8735.
- Kumari G, Ulrich T, Krause M, et al. Induction of p21CIP1 protein and cell cycle arrest after inhibition of Aurora B kinase is attributed to aneuploidy and reactive oxygen species. J Biol Chem. 2014;289:16072–16084.
- Shagieva GS, Domnina LV, Chipysheva TA, et al. Actin isoforms and reorganization of adhesion junctions in epithelial-to-mesenchymal transition of cervical carcinoma cells. Biochem (Mosc). 2012;77:1266–1276.
- Shinohara M, Shang W-H, Kubodera M, et al. Nox1 redox signaling mediates oncogenic Ras-induced disruption of stress fibers and focal adhesions by down-regulating Rho. J Biol Chem. 2007;282:17640–17648.
- Alexandrova AY, Dugina VB, Paterson H, et al. Motility of intracellular particles in rat fibroblasts is greatly enhanced by phorbol ester and by over-expression of normal p21N-ras. Cell Motil Cytoskeleton. 1993;25:254–266.
- Paterson H, Reeves B, Brown R, et al. Activated N-ras controls the transformed phenotype of HT1080 human fibrosarcoma cells. Cell. 1987;51:803–812.
- Archer H, Bar-Sagi D. Ras and Rac as Activators of Reactive Oxygen Species (ROS). GTPase Protoc New Jersey: Humana Press. 2002;189:067–073.
- Serù R, Mondola P, Damiano S, et al. HaRas activates the NADPH oxidase complex in human neuroblastoma cells via extracellular signal-regulated kinase 1/2 pathway. J Neurochem. 2004;91:613–622.
- Alexandrova AY, Kopnin PB, Vasiliev JM, et al. ROS up-regulation mediates Ras-induced changes of cell morphology and motility. Exp Cell Res. 2006;312:2066–2073.
- Baldini E, Sorrenti S, Da E, et al. Aurora kinases: new molecular targets in thyroid cancer therapy. Clin Ter. 2012;163:e457–62.
- Anand S, Penrhyn-Lowe S, Venkitaraman AR. AURORA-A amplification overrides the mitotic spindle assembly checkpoint, inducing resistance to Taxol. Cancer Cell. 2003;3:51–62.
- Carmena M, Earnshaw WC. The cellular geography of Aurora kinases. Nat Rev Mol Cell Biol. 2003;4:842–854.
- Marumoto T, Honda S, Hara T, et al. Aurora-A kinase maintains the fidelity of early and late mitotic events in HeLa cells. J Biol Chem. 2003;278:51786–51795.
- Yokoyama T, Goto H, Izawa I, et al. Aurora-B and Rho-kinase/ROCK, the two cleavage furrow kinases, independently regulate the progression of cytokinesis: possible existence of a novel cleavage furrow kinase phosphorylates ezrin/radixin/moesin (ERM). Genes Cells. 2005;10:127–137.
- Hauf S, Cole RW, LaTerra S, et al. The small molecule Hesperadin reveals a role for Aurora B in correcting kinetochore-microtubule attachment and in maintaining the spindle assembly checkpoint. J Cell Biol. 2003;161:281–294.
- Gully CP, Zhang F, Chen J, et al. Antineoplastic effects of an Aurora B kinase inhibitor in breast cancer. Mol Cancer. 2010;9:42.
- Fernandez-Miranda G, Trakala M, Martin J, et al. Genetic disruption of aurora B uncovers an essential role for aurora C during early mammalian development. Development. 2011;138:2661–2672.
- Han EH, Min J-Y, Yoo S-A, et al. A small-molecule inhibitor targeting the AURKC-IκBα interaction decreases transformed growth of MDA-MB-231 breast cancer cells. Oncotarget. 2017;8:69691–69708.
- Sherr CJ. Cancer cell cycles. Science. 1996;274:1672–1677.
- Topham CH, Taylor SS. Mitosis and apoptosis: how is the balance set? Curr Opin Cell Biol. 2013;25:780–785.
- Vitale I, Galluzzi L, Castedo M, et al. Mitotic catastrophe: a mechanism for avoiding genomic instability. Nat Rev Mol Cell Biol. 2011;12:385–392.
- Gupta S, Stanbridge EJ. Paired human fibrosarcoma cell lines that possess or lack endogenous mutant N-ras alleles as experimental model for Ras signaling pathways. Methods Enzymol. 2001;333:290–306.
- McAllister RM, Melnyk J, Finklestein JZ, et al. Cultivation in vitro of cells derived from a human rhabdomyosarcoma. Cancer. 1969;24:520–526.