
ABSTRACT
Recent studies using direct live cell imaging have reported that individual B lymphocytes have correlated transit times between their G1 and S/G2/M phases. This finding is in contradiction with the influential model of Smith and Martin that assumed the bulk of the total cell cycle time variation arises in the G1 phase of the cell cycle with little contributed by the S/G2/M phase. Here we extend these studies to examine the relation between cell cycle phase lengths in two B lymphoma cell lines. We report that transformed B lymphoma cells undergo a short G1 period that displays little correlation with the time taken for the subsequent S/G2/M phase. Consequently, the bulk of the variation noted for total division times within a population is found in the S/G2/M phases and not the G1 phase. Models that reverse the expected source of variation and assume a single deterministic time in G1 followed by a lag + exponential distribution for S/G2/M fit the data well. These models can be improved further by adopting two sequential distributions or by using the stretched lognormal model developed for primary lymphocytes. We propose that shortening of G1 transit times and uncoupling from other cell cycle phases may be a hallmark of lymphocyte transformation that could serve as an observable phenotypic marker of cancer evolution.
Introduction
Understanding the relationship between times spent within each internal phase of the cell cycle is of critical importance for interpreting proliferation studies widely used in biological research. The question is long-standing and heavily influenced by classic studies that identified a stochastic contribution to cell cycle times [Citation1–Citation5]. For example, drawing on filming data, Smith and Martin proposed a transitional model of cell cycle progression where a deterministic ‘lag’ and an exponential waiting phase gave excellent approximations of the total time for cell division [Citation1].
Given that the time for replication of DNA was thought to be constant, Smith and Martin attributed the stochastic, exponential component to the G1 phase. Their model imagined that a radioactive decay-like mechanism motivated the exit of cells from the G1 phase of cell cycle before entering the more time constant S/G2/M phase. This model, expressed as a series of differential equations, has been widely adopted and used to estimate the proportion of cells in each phase of the cell cycle in a population of dividing cells [Citation6–Citation11].
Despite the utility of this model, recent imaging technologies have allowed the direct visualization and tracking of cell cycle phases in living cells. One widely used method introduced by Sakaue-Sawano and colleagues [Citation12], Fluorescent Ubuiqtination-based Cell Cycle Indicator (FUCCI), enables monitoring of cell-cycle at the single cell level, and has revealed lengths of cell cycle phases in cardiomyocytes, melanoma cells, intestinal stem cells and neural stem cells [Citation13–Citation16]. Using this FUCCI system to monitor cell cycle phases in dividing lymphocytes, Dowling and colleagues reported that B and T lymphocytes did not conform to the Smith-Martin model as they did not exhibit an exponential G1 phase [Citation17]. Rather, dividing B and T lymphocytes displayed stretched cell cycles where time spent in G1 and S/G2/M phases was correlated in individual cells, and each phase represented a relatively constant proportion of the length of the total cell cycle phase [Citation17]. As a common feature of transformed cells is the deregulation of their cell cycles [Citation18–Citation22] we sought to examine the cell cycles of transformed B lymphocytes for comparison to healthy cells. We reasoned this analysis would provide insight into how immortalisation might alter the internal regulation of cell growth.
For this analysis we combined the FUCCI cell cycle reporter system [Citation12] with single cell imaging to ask whether transformed B lymphocytes have a similar cell cycle structure to healthy B lymphocytes and display correlations in phase lengths, or have developed an alternative relationship. We report that, the S/G2/M phase in B lymphoma cells accounts for most of the variance in total division time. Moreover, regulation of G1 and S/G2/M phases appears to be largely independent, as we found no evidence for strong correlation of duration of these phases. These studies provide further evidence against the generality of the Smith and Martin model and suggest that transformation can subvert the normal controls that usually connect the passage through consecutive phases of division.
Results
Fluorescent profiles of FUCCI expression in transformed B lymphocytes
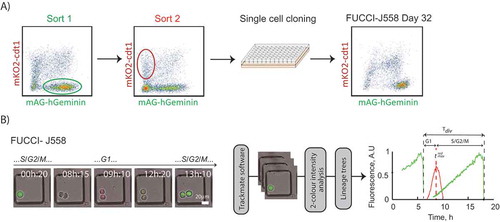
FUCCI expression was first established in both the murine B cell plasmacytoma, J558 [Citation23], and the B lymphoma line, I.29 [Citation24] (). The two reporter constructs, mAG-hGeminin and mKO2-hcdt1, were introduced by lentiviral transduction and sequentially sorted for mAG-hGeminin and mKO2-hcdt1 expression. Single clone lines were established that demonstrated stable expression of each FUCCI component up to and exceeding 30 days ( and S1). Having established FUCCI-J558 and FUCCI-I.29 lines we adapted a single cell imaging system previously used to investigate cell cycle lengths [Citation17,Citation25,Citation26]. Single cells seeded in microgrids were filmed over 60 hours to observe 1–3 division rounds, and we developed an imaging analysis pipeline (described in Methods) to measure the onset of G1 (tredmax) and S/G2/M (tdiv-tredmax) ().
Figure 1. Sorting protocol to create FUCCI cancer B cell lines. (a) Schematic description of FUCCI cell line generation. FUCCI-J558 B plasmacytoma and FUCCI-I.29 B lymphoma cell lines were created by co-transduction with mAG-hGeminin and mKO2-cdt1, consecutive sorting on mAG-hGeminin (Sort 1, green fluorescence) then mKO2-cdt1 (Sort 2, red fluorescence) expression, and single cell cloning culture. Clones with stable expression of at least 30 days were selected for further experiments. Generation of FUCCI-I.29 is shown in Fig. S1. (b) Imaging pipeline to cell cycle phase measurements. Examples of still images taken from time lapse imaging of FUCCI B cell lines. Time lapse movies were separated into stacks, processed, tracked and analyzed through Trackmate software, with green and red fluorescence measurements at each timepoint extracted and plotted for each cell within a lineage tree. Temporal changes in fluorescence and marked delineations in G1, S/G2/M and total division times are shown. For the purposes of the study G1 is measured from the point of division to the red peak, tredmax, and S/G2/M as tdiv-tredmax. Example fluorescence profiles from a single sibling cell delineating demarcation of phases. The imaging experiment data was pooled from N = 2 experiments, with 2 cell line clones each for FUCCI-J558 and FUCCI-I.29, imaged in duplicate for each experiment. Scale bar: 20μm.
Cell cycle phases of transformed B cell cycles display converse smith-martin kinetics
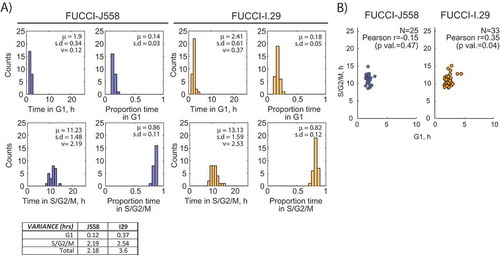
We then sought to establish the kinetic profile of cell cycle phases for each transformed B lymphocyte line. The average times for division in FUCCI-J558 (13.1 h, s.d 1.5 h) and FUCCI-I.29 (13.4 h, s.d 1.9 h) (), were similar to published times for stimulated primary B cells at 11.9 h [Citation17]. However, when broken down further to times in G1 and S/G2/M, the period and proportion in G1 phase was notably different to that reported for primary B cells [Citation17] (). First, transformed B cells spent shorter times in G1 (FUCCI J558: 1.5 h, 14% of total division, FUCCI-I.29: 2.41 h, 18% of total division) () compared to that previously observed in CpG stimulated primary B cells (G1: 3.3 h, 27% of total division [Citation17]). Second, when the patterns of variation were further interrogated, the bulk of the variation in total division time could be assigned to the S/G2/M rather than G1 phase (, see table), converse to the classic view of Smith and Martin [Citation1]. We also examined the relation between time spent in G1 and S/G2/M phases. In healthy B cells the proportion of time spent in G1 was found to be a relatively fixed proportion of the total division time enabling a convenient stretched model of cell cycle length [Citation17]. In contrast the correlation between G1 and S/G2/M phase lengths of individual tumor cells was found to be weak to non-existent (J558: r = −0.15; I.29 r = 0.35) () and therefore inconsistent with the key finding that motivated the development of the stretched cell cycle model.
Figure 2. Cell cycle phases of transformed B cell cycles display converse Smith-Martin kinetics. (a) Distribution histograms of time (h) and proportion of time spent in either G1 or S/G2/M. Bar plots of cell cycle phases for both FUCCI-J558 and FUCCI-I.29 cancer B cells are shown with sample mean, standard deviation and variance in hours (μ, s.d, v), with a summary of the variances summarized is listed in a table. (b) S/G2/M versus vs G1 time (h) plotted for J558 (red) and I.29 (orange) B lymphoma cells. The Pearson correlation of coefficient and p-value is shown. N = 25 FUCCI-J558, N = 33 FUCCI-I.29 cells chosen randomly from its sibling pair for correlation comparisons.
Cell cycle phases do not conform to an age independent, exponential mechanism
One of the goals of our studies is to develop relatively simple parameterised mathematical models of cell proliferation that can be used to predict proportions of cells in different cell cycle phases. Such models are useful for estimating cell cycle times, for example, from mixed population data showing proportion of cells in cell cycle phases, or by pulse labeling cells for DNA uptake [Citation27,Citation28]. As there was little correlation between time in G1 and S/G2/M phases for both cell types, the total division time can be approximated as the sum of two independent phase distributions. Therefore, we assessed patterns of variation for each phase independently. To visualize fitting accuracy for a variety of models we adopted the alpha plot method of Smith and Martin [Citation1] and applied it to the FUCCI-J558 and FUCCI-I.29 data, Figure 3. The alpha plot is a form of survival plot showing the proportion of cells that have divided over time when synchronized to their previous mitosis (time 0). Note that all models were fitted directly to G1 and S/G2/M measurements, and the alpha plots were merely used for visualization post-fitting. In this plot the total division times (tDiv) represent distribution of the total division time predicted as the convolution of fitted G1 and S/G2/M distributions. In different models for describing the distributions for total division times and their internal phases are compared (see Methods). The two-parameter Smith-Martin model, constructed as an exponential time in G1 plus a deterministic lag time for S/G2/M (black line), fitted total division times well, however, returned a poor estimation of time for individual cell cycle phases. Furthermore, a simple exponential function provided a poor estimation of the stochastic variation in either phase, suggesting that a simple two-parameter model such as a constant lag for G1, and an exponential decay for S/G2/M is not very accurate (, black line). For the purposes of mathematical modeling especially in the context of ordinary differential equation (ODE) type models, assuming deterministic or exponentially distributed times is particularly convenient. We find that such approximations can be reasonable for our data but require three parameters in total- one for modeling G1 and two for modeling S/G2/M. In particular, we note the coefficient of variation for the G1 phase is small (FUCCI-J558:18.0% and FUCCI-I.29:25.2%), thus as an approximation G1 phase can be assumed to be constant. Moreover, the S/G2/M time distribution can be approximated using a deterministic lag followed by an exponential decay (, Red line). Thus, a model assuming a deterministic lag for G1 phase, and a further deterministic lag plus an exponential for S/G2/M provided satisfactory fits for each cell cycle phase and for total division times (, red line). Such a model is well suited for ODE formulations.
Figure 3. Duration of G1 and S/G2/M can be accurately explained by an age-dependent mechanism. Alpha-plots of G1, S/G2/M and total division times. The Exponential + Lag (Smith-Martin), Lag + Lag, Exponential, Gaussian + Gaussian, Gamma + Gamma, Lognormal + Lognormal, and Stretched Lognormal fits for G1 and S/G2/M respectively are shown. Akaike Information Criterion with a correction for small sample size (AICc) values for the different alpha plot fits are shown to the right in a table. AICc values were computed for G1 and S/G2/M measurements treated as separate datasets (columns “G1” and “S/G2/M”), and also for G1 and S/G2/M measurements treated as a single dataset (column “G1 and S/G2/M”). Note that models containing a lag involve a deterministic component and therefore an AICc value cannot be calculated. The stretched lognormal model is fit simultaneously to G1 and S/G2/M data, therefore, AICc values for G1 and S/G2/M data are not computed separately. N = 25 FUCCI-J558, N = 33 FUCCI-I.29 cells chosen randomly from its sibling pair for modeling comparisons.
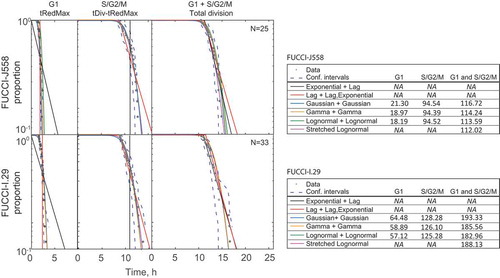
The accuracy of model fits can be further improved by incorporating commonly used age-dependent probability distributions. In we have compared Gaussian (blue line), Gamma (yellow line) and Lognormal (green line) fits for each cell cycle phase. Interestingly, we find that for both G1 and S/G2/M phases, each of these distributions gives equally good fits, and calculating the total division time as the sum of two such distributions yield similarly parsimonious fits as measured by Akaike Information Criterion with a correction for small sample sizes (AICc) (See tables in ). , in the right panel, illustrates how G1+S/G2/M Gaussian, or Lognormals or Gamma distributions can be concatenated to yield satisfactory description of cell cycle phases and total division times. We also compared these four parameter models to fits based on the stretched cell cycle model that adopts 3 parameters (two parameters of a lognormal, and a stretching parameter, pink line) [Citation17]. We found that, despite the lack of strong correlation between G1 and S/G2/M measurements, the stretched cell cycle model resulted in a similar performance as indicated by AICc. Overall, for the purposes of mathematical modeling for our data, the stretched model can still be used with the convenience of needing to estimate one less parameter, as compared to the models with independent distributions for the two parts. At the same time, G1 (lag), S/G2/M (lag + exponential) model (, red line), which is attractive from the point of view of mathematical convenience for ODE-based modeling, still gives a reasonable approximation to data.
Distinct correlations for clonal relatives
Intraphase correlations in familial pedigrees can provide evidence for the transfer of deterministic factors that influence cell cycle time across generations. For example, the model of Smith and Martin predicted, incorrectly for many cell types, that G1 duration should be uncorrelated in siblings [Citation29]. To reveal heritable mechanisms influencing cell cycle phase transitions in FUCCI-J558 and FUCCI-I.29, we investigated sibling and other familial correlations within our imaging data. Mirrored bar graphs showing times, and proportions allocated for each cell cycle phase for each pair of siblings, suggested a high degree of correlation (). The correlation was relatively strongly positive for both cells (Pearson’s correlation coefficient r, FUCCI J558: 0.593, FUCCI I.29: 0.663, ), although weaker than observed for primary B cells (Pearson’s correlation coefficient r = 0.91 [Citation30]).
The lymphoma cells in our study displayed strong correlation in the G1 phase in siblings and cousins, and these correlations were higher than observed in G1 length times between mother and daughter cells ()). There were also moderate correlations for S/G2/M times, but correlations were weaker in all relationships (sibling, mother-daughter and cousins) compared to that seen for G1 phase (). These data show higher relatedness for G1 times in siblings and cousins compared to mother to daughter, consistent with intergenerational carriage of a cell cycle regulator. Cyclical generational correlations have been noted for other cells [Citation31], although the mechanism is currently unknown.
Figure 4. Cell cycle phase bar plots in sibling cells show familial features. (a) Sibling bar length plots representing total division times for sibling pairs, the red dot denotes the red fluorescence peak (red), green fluorescence length (green), or no fluorescence (black). Siblings’ lifetimes are shown side by side, with one axis going from center to the left and another one going from center to the right. The left bar plots represent real time and the plots on the right represent the relative proportions. Scatter plots of (b) total division times, (c) G1 times, and (d) S/G2/M times, showing correlation between sibling, s, mother-daughter, m.d, and cousin, c, in hours (h), with the Pearson’s correlation coefficient, r, and statistical significance, p-value; mean, μ, and standard deviation, σ, shown.
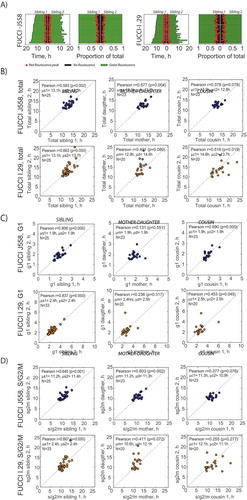
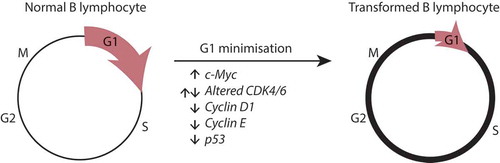
Figure 5. A model for G1 phase minimisation during B lymphocyte transformation. Healthy B lymphocytes cycle as normally, where total division times may vary slightly but each G1 and S/G2/M phases can be scaled against each other according to the stretched cell cycle model. During oncogenic transformation, deregulation of G1 restriction point targets, such as increased myc, altered CDK4/6 levels, decrease cyclin D1 or p53 null mutations results in a minimisation of G1 time and variation, with most of the variation occurring at S/G2/M.
Discussion
Here we investigated cell cycle phase relationships in transformed, long-term cultured B cell lines. We expected lymphoma-derived cell lines to differ from primary cultured B cells, as they have undergone multiple rounds of selection; initially during oncogenic transformation, and subsequently during long term culture. Surprisingly, we found the average division time was similar to primary activated B lymphoblasts as were the patterns of variation in total division times, with both having consistent right-skewed distributions [Citation17]. Moreover, a modest to strong heritability of division times was observed for siblings, mothers and daughters and for cousins, suggesting that the transmission of factors that influence division times are passed through multiple generations, as also seen for primary B cells [Citation17]. However, when time in G1 and S/G2/M were revealed with FUCCI reporters, two significant differences between primary and transformed cells became apparent. First, the time for G1 with later cell cycle phases in individual lymphoma cells showed only weak, if any, correlation, in contrast to the relatively strong concordance in primary B lymphocytes [Citation17]. Second, the time taken to traverse G1 was short, as observed with other lymphoblast lines [Citation32], resulting in the bulk of the variation in cell cycle time being attributable to the S/G2/M phase.
It appears that transformation has played a role in minimizing the time taken to complete the G1 phase, and not the S/G2/M phase for both cell types (). This is perhaps expected, as exit from G1 is a major restriction point before DNA synthesis and the level of numerous proteins, including known oncogenes, regulate this decision. Molecular changes that would eliminate the usual controls that govern the decision to divide include deregulated c-Myc, Cyclin D/E, and p53, and these genes are found mutated in up to 90% of B lymphomas [Citation33–Citation41]. It is also likely that the removal of limiting steps in cell cycle progression by deregulating the production of regulatory proteins can explain the reduced correlations in times for G1 and S/G2/M in individual lymphoma cells compared to primary B cells. An alternative interpretation is that a direct loss of a quiescent state, G0, is a feature of B lymphocyte transformation as healthy B lymphocytes are usually able to re-acquire a quiescent, small, non-dividing state [Citation42,Citation43]. There are two reasons why this might not be the case. First, cyclins and p53, for instance, may indeed regulate quiescence in many cell types including B lymphocytes [Citation44–Citation49], but data evidencing that genes regulating quiescence in B lymphocytes as important tumor suppressors appear less convincing. For example, mice deficient for the quiescent regulator KLF4 show no spontaneous B cell expansion or malignancy [Citation50]. Second, as our comparison to healthy B lymphocytes is restricted to cells undergoing active division, they can be directly compared to transformed B cells which also do not go through a quiescent phase. Quiescent healthy lymphocytes can also be identified with ease with imaging with the FUCCI reporter as they show no progressive increase in cell size and accumulate much higher levels of FUCCI red than cycling cells [Citation51,Citation52]. Hence, while loss of G0 is an interesting biological consideration, as no quiescent cells (healthy or transformed) are being analyzed and compared in this study, the lack of G0 alone cannot explain the differences we observe. Thus, we propose that dysregulation leading to a shortened time in G1, and the loss of correlation with later cell cycle phases could serve as an early hallmark of oncogenic transformation.
A major goal of our study is to inform the rational development of parsimonious, robust models of cell division that can predict the proportion and lengths of cells in different cell cycle phases within populations of unsynchronised cells. Such models are widely applied to, for example, DNA labeling data [Citation27] or BrdU cell pulse data [Citation28]. To build a completely accurate statistical model of cell cycle progression that includes time in transitional phases and inheritance features would require considerable complexity and will likely be over-parameterised for fitting to population data that reports only proportions of cells in each phase. Our goal is simpler, like Smith and Martin, we aim for a robust model that can be easily applied. To minimize the number of parameters, cell cycle models must make appropriate simplifying assumptions that can be tested by the type of information acquired here for the timing of cell cycle phase transitions. As a common fitting protocol is based on variations of the Smith-Martin model we tested this model in different configurations. The Smith-Martin model expects an exponential waiting time in G1, and a relatively invariant time for S/G2/M. As for primary B cells this model was found to be quite successful for predicting variation in total division times but failed completely for internal cell cycle phases. To develop and test more accurate variations, we identified two major sources of error in the Smith-Martin model. First, we found no evidence that an age-independent exponential waiting time underlies the source of time variation in any phase. Second, the Smith-Martin model assumed that the bulk of the time variation occurred in G1 phase was incorrect as the principal source of variation was in S/G2/M rather than in G1.
Our analysis and search for alternative models led us to compare three-parameter variants. We found the minimum successful formulation suitable for an ODE-based model assumed a single deterministic time for G1, followed by a lag and exponential fit for S/G2/M phases. Thus, by reversing the major source of variation from G1 to S/G2/M phases and replacing the exponential waiting time with a delayed distribution, the Smith-Martin model can be much improved as the basis for ODE-based models. Similarly, models that assume a deterministic time in G1, followed by an age-dependent distribution for S/G2/M, such as a lognormal, or Gamma, also provide excellent fits (data not shown). In deference to the original, we labeled these minimal, reverse variation models as converse Smith-Martin models. We also found that more complex, four parameter models that assume two consecutive, independent phases and therefore result in a convolution of two distributions (ie. lognormal to lognormal) also yield excellent outcomes.
The stretched model was developed to be consistent with the experimental finding of strong correlation between G1 and S/G2/M phases [Citation17]. This strong correlation is found for primary B cells but interestingly not the lymphoma cells studied here. Nevertheless, the stretched model gives similarly parsimonious fitting results to the lymphoma data, presumably as it efficiently serves to construct two consecutive distributions from only three parameters. Taken together, this study and that of Dowling et al. [Citation17] argue strongly against the view that time spent in the S/G2/M phases of the cell cycle does not contribute significantly to variation in cell division times. In contrast we find that variation within S/G2/M phase of B lymphoblast cells is significant, independent of the G1 phase, and to an extent, heritable from mother to daughter cells.
Comparisons of the stretched cell cycle features seen in healthy B lymphocytes to other transformed lymphocyte lines will likely provide further insight into which features of cell cycle can serve as general hallmarks of cancer transformation. In this way we believe the FUCCI reporter system coupled with alternative models of cell cycle times offers a powerful method to determine the individual and collective impact of somatic gene changes on the multiple drivers of transformation.
Methods
Generation of FUCCI B cell lines and in vitro culture
Fluorescence Ubiquitin Cell Cycle Indicator (FUCCI) lentiviral constructs mAG-hGeminin and mKO2-hcdt1 on a CSII-EF lentiviral backbone were obtained from RIKEN (http://www.brc.riken.jp/lab/cfm/aim/lentivirus.html). Viral supernatant harvested 24 and 48 hours after calcium phosphate-mediated transfection of 293T cells were placed in a 6-well plate to which 1 × 10⁶ J558 plasmacytoma [Citation23] or I.29 lymphoma cells [Citation24] were added and spun for 1.5 hours, 37°C, 1200 G. Transduced B cells were sorted sequentially for mAG-hGeminin then mKO2-hcdt1 expression then designated “FUCCI”. Single FUCCI-J558 or FUCCI-I.29 cell clones were selected for stable expression after 30 days. 3.3x10⁴ cells in 300 ul were placed in 8-well chamber slides for imaging (see Time lapse imaging and Image Processing).
Time lapse imaging and image processing
The chamber slide (μ-Slide 8 well, Ibidi, 80826) containing 70-µm microgrids (Microsurfaces, MGA-70-01) and cells were transferred to an environment-controlled [37°C, 5% (vol/vol) CO2, humidified] Zeiss Axiovert 200M microscope. A Zeiss Plan-Apochromat 20 × objective (N.A. 0.8) was used, and fluorescence and bright-field images were captured with a PCO.edge sCMOS camera (5.5 megapixels). The light source was a Zeiss Colibri module controlled by Zen Blue software fitted with 490 nm and 565 nm beam splitters, as well as 470 nm and 540–580 nm light-emitting diodes, which were used to excite mAG-hGeminin and mKO2-hcdt1 respectively. Cell filtering, segmentation and tracking was done using a semi-automated custom script using Trackmate software in FIJI v1.51p and can be downloaded at https://bitbucket.org/DrLachie/fucci-lineage-code. Tracks were manually corrected on red and green fluorescence. Lengths of G1 and S/G2/M was measured by the onset of red peak fluorescence and data values were exported in Python for further mathematical modeling.
Mathematical modeling
For each of the cell lines our dataset comprised pairs of sibling cells in generation 1 as counted from the beginning of the movie. One randomly selected sibling from each pair was used for scatterplots and histograms in and accompanying statistics. One randomly selected sibling was also used for subsequent modeling. Models listed in were fitted directly to G1 and S/G2/M durations, and the alpha plots were only used for visualization post fitting. The “lag” in the constant lag model for G1 (respectively, S/G2/M) was taken as the mean of G1 (respectively, S/G2/M) durations. The “lag, exponential” model for the S/G2/M component was fitted by fitting an exponentially modified Gaussian using method of moments, and then disregarding the variance of the Gaussian distribution. Thus the lag was taken as the mean of the Gaussian component. All other models were fit using maximum likelihood estimation, and the relative performance of the fits was assessed using Akaike Information Criterion with a correction for small sample sizes (AICc) [Citation53]. Mother-daughter and cousin-cousin relations were assessed on an extended version of the dataset that included six cells for each family: two cells in generation 1 and four cells in generation 2. The generation 1 cells in the extended dataset are the same as in the main dataset. In some instances, the number of families represented in the extended dataset were smaller than the number of pairs in the main dataset because some families could be tracked only up to generation 1.
Supplemental Material
Download MS Word (125.6 KB)Acknowledgments
mAG-hGem and mKO2-hcdt1 lentiviral constructs were provided by the Dr. Atsushi Miyawaki from the RIKEN Brain Science Institute. We thank Dr. Liyan Liu and Eunice Tan for assistance in help with image analysis, Lynn Corcoran for help with methods.
Disclosure statement
No potential conflict of interest was reported by the authors.
Supplementary material
Supplemental data can be accessed here.
Additional information
Funding
Notes on contributors
K. Pham
K.P and P.D.H designed the study; K.P performed the experiments. A.K, L.W, R.J.H and K.R. oversaw the imaging pipeline and reviewed and analyzed imaging data. K.P, A.K and P.D.H assessed data and mathematical models and wrote the paper.
Related Research Data
References
- Smith JA, Martin L. Do cells cycle? Proc Natl Acad Sci U S A. 1973 Apr;70(4):1263–1267. PubMed PMID: 4515625; PubMed Central PMCID: PMC433472.
- Shields R. Transition probability and the origin of variation in the cell cycle. Nature. 1977 Jun 23;267(5613):704–707. PubMed PMID: 876390.
- Shields R, Smith JA. Cells regulate their proliferation through alterations in transition probability. J Cell Physiol. 1977 Jun;91(3):345–355. PubMed PMID: 558988. .
- Shields R, Brooks RF, Riddle PN, et al. Cell size, cell cycle and transition probability in mouse fibroblasts. Cell. 1978 Oct;15(2):469–474. PubMed PMID: 569024.
- Ln C. A G1 rate model accounts for cell-cycle kinetics attributed to ‘transition probability’. Nature. 1980 Oct 30;287(5785):857–859. PubMed PMID: 6159544.
- Golubev A. Transition probability in cell proliferation, stochasticity in cell differentiation, and the restriction point of the cell cycle in one package. Prog Biophys Mol Biol. 2012 Sep;110(1):87–96. PubMed PMID: 22609564. .
- Lee HY, Perelson AS. Modeling T cell proliferation and death in vitro based on labeling data: generalizations of the Smith-Martin cell cycle model. Bull Math Biol. 2008 Jan;70(1):21–44. PubMed PMID: 17701260. .
- Lee TJ, Yao G, Bennett DC, et al. Stochastic E2F activation and reconciliation of phenomenological cell-cycle models. PLoS Biology. 2010 Sep 21;8(9). PubMed PMID: 20877711;1–11. PubMed Central PMCID: PMC2943438.
- Leon K, Faro J, Carneiro J. A general mathematical framework to model generation structure in a population of asynchronously dividing cells. J Theor Biol. 2004 Aug 21;229(4):455–476. PubMed PMID: 15246784.
- Zilman A, Ganusov VV, Perelson AS. Stochastic models of lymphocyte proliferation and death. PloS one. 2010 Sep 30;5(9). PubMed PMID: 20941358; PubMed Central PMCID: PMC2948000. DOI: 10.1371/journal.pone.0012775.
- De Boer RJ, Perelson AS. Quantifying T lymphocyte turnover. J Theor Biol. 2013 Jun 21;327:45–87.
- Sakaue-Sawano A, Kurokawa H, Morimura T, et al. Visualizing spatiotemporal dynamics of multicellular cell-cycle progression. Cell. 2008 Feb 08;132(3):487–498. PubMed PMID: 18267078.
- Hashimoto H, Yuasa S, Tabata H, et al. Time-lapse imaging of cell cycle dynamics during development in living cardiomyocyte. J Mol Cell Cardiol. 2014 Jul;72:241–249. PubMed PMID: 24704900; eng.
- Ridenour DA, McKinney MC, Bailey CM, et al. CycleTrak: a novel system for the semi-automated analysis of cell cycle dynamics. Dev Biol. 2012 May 01;365(1):189–195. PubMed PMID: 22387844; PubMed Central PMCID: PMCPmc3322266. eng.
- Matsu-Ura T, Dovzhenok A, Aihara E, et al. Intercellular coupling of the cell cycle and circadian clock in adult stem cell culture. Mol Cell. 2016 Dec 01;64(5):900–912. PubMed PMID: 27867006; PubMed Central PMCID: PMCPmc5423461. eng.
- Roccio M, Schmitter D, Knobloch M, et al. Predicting stem cell fate changes by differential cell cycle progression patterns. Development. 2013 Jan 15;140(2):459–470. PubMed PMID: 23193167; eng.
- Dowling MR, Kan A, Heinzel S, et al. Stretched cell cycle model for proliferating lymphocytes. Proc Natl Acad Sci U S A. 2014 Apr 29;111(17):6377–6382. PubMed PMID: 24733943; PubMed Central PMCID: PMC4036001.
- Motokura T, Arnold A. Cyclin D and oncogenesis. Curr Opin Genet Dev. 1993 Feb;3(1):5–10. PubMed PMID: 8453274; PubMed Central PMCID: PMC8453274. eng.
- Boehm JS, Hession MT, Bulmer SE, et al. Transformation of human and murine fibroblasts without viral oncoproteins. Mol Cell Biol. 2005 Aug;25(15):6464–6474. PubMed PMID: 16024784; PubMed Central PMCID: PMC1190359.
- Aifantis I, Raetz E, Buonamici S. Molecular pathogenesis of T-cell leukaemia and lymphoma. Nat Reviews Immunol. 2008 May;8(5):380–390. PubMed PMID: 18421304; eng.
- Rosenquist R, Bea S, Du MQ, et al. Genetic landscape and deregulated pathways in B-cell lymphoid malignancies. J Intern Med. 2017 Jun 20 PubMed PMID: 28631441; eng. DOI:10.1111/joim.12633.
- Barille-Nion S, Bah N, Vequaud E, et al. Regulation of cancer cell survival by BCL2 family members upon prolonged mitotic arrest: opportunities for anticancer therapy. Anticancer Res. 2012 Oct;32(10):4225–4233. PubMed PMID: 23060542; eng.
- Ralph P. Retention of lymphocyte characteristics by myelomas and theta + -lymphomas: sensitivity to cortisol and phytohemagglutinin. Journal of Immunology (Baltimore, Md: 1950). 1973 Jun;110(6):1470–1475. PubMed PMID: 4541304.
- Sitia R, Rubartelli A, Deambrosis S, et al. Differentiation in the murine B cell lymphoma I.29: inductive capacities of lipopolysaccharide and Mycoplasma fermentans products. Eur J Immunol. 1985 Jun;15(6):570–575. PubMed PMID: 3874069.
- Day D, Pham K, Ludford-Menting MJ, et al. A method for prolonged imaging of motile lymphocytes. Immunol Cell Biol. 2009 Feb;87(2):154–158. PubMed PMID: 18982018; eng.
- Duffy KR, Wellard CJ, Markham JF, et al. Activation-induced B cell fates are selected by intracellular stochastic competition. Science. 2012 Jan 20;335(6066):338–341. PubMed PMID: 22223740.
- Metcalf D, Wiadrowski M. Autoradiographic analysis of lymphocyte proliferation in the thymus and in thymic lymphoma tissue. Cancer Res. 1966 Mar;26(3):483–491. PubMed PMID: 5930695.
- Bonhoeffer S, Mohri H, Ho D, et al. Quantification of cell turnover kinetics using 5-bromo-2ʹ-deoxyuridine. Journal of Immunology (Baltimore, Md: 1950). 2000 May 15;164(10):5049–5054. PubMed PMID: 10799860.
- Minor PD, Smith JA. Explanation of degree of correlation of sibling generation times in animal cells. Nature. 1974 Mar 15;248(445):241–243. PubMed PMID: 4206605.
- Hawkins ED, Markham JF, McGuinness LP, et al. A single-cell pedigree analysis of alternative stochastic lymphocyte fates. Proc Natl Acad Sci U S A. 2009 Aug 11;106(32):13457–13462. PubMed PMID: 19633185; PubMed Central PMCID: PMC2715326.
- Sandler O, Mizrahi SP, Weiss N, et al. Lineage correlations of single cell division time as a probe of cell-cycle dynamics. Nature. 2015 Mar 26;519(7544):468–471. PubMed PMID: 25762143.
- Pearl Mizrahi S, Gefen O, Simon I, et al. Persistence to anti-cancer treatments in the stationary to proliferating transition. Cell Cycle. 2016 Dec 16;15(24):3442–3453. PubMed PMID: 27801609; PubMed Central PMCID: PMC5224467.
- Cory S. Activation of cellular oncogenes in hemopoietic cells by chromosome translocation. Adv Cancer Res. 1986;47: 189–234. PubMed PMID: 3096089; eng.
- Bosch F, Jares P, Campo E, et al. PRAD-1/cyclin D1 gene overexpression in chronic lymphoproliferative disorders: a highly specific marker of mantle cell lymphoma. Blood. 1994 Oct 15;84(8):2726–2732. PubMed PMID: 7919385; eng.
- Sanchez-Beato M, Sanchez-Aguilera A, Piris MA. Cell cycle deregulation in B-cell lymphomas. Blood. 2003 Feb 15;101(4):1220–1235. 10.1182/blood-2002-07-2009. PubMed PMID: 12393483; eng.
- Chiles TC. Regulation and function of cyclin D2 in B lymphocyte subsets. Journal of Immunology (Baltimore, Md: 1950). 2004 Sep 01;173(5):2901–2907. PubMed PMID: 15322145; eng.
- John RR, Malathi N, Ravindran C, et al. Mini review: multifaceted role played by cyclin D1 in tumor behavior. Indian Journal Dental Research: Official Publication Indian Society Dental Research. 2017 Mar-Apr;28(2):187–192. PubMed PMID: 28611330; eng.
- Sherr CJ, The MF. RB and p53 pathways in cancer. Cancer Cell. 2002 Aug;2(2):103–112. PubMed PMID: 12204530.
- Slatter TL, Ganesan P, Holzhauer C, et al. p53-mediated apoptosis prevents the accumulation of progenitor B cells and B-cell tumors. Cell Death Differ. 2010 Mar;17(3):540–550. PubMed PMID: 19779492; eng.
- Whittaker SR, Mallinger A, Workman P, et al. Inhibitors of cyclin-dependent kinases as cancer therapeutics. Pharmacol Ther. 2017 May;173:83–105. PubMed PMID: 28174091; eng.
- Lezaja A, Altmeyer M. Inherited DNA lesions determine G1 duration in the next cell cyclecycle. Cell. 2017 Oct 5:1–9 PubMed PMID: 28980862. DOI:10.1080/15384101.2017.1383578.
- Turner ML, Hawkins ED, Hodgkin PD. Quantitative regulation of B cell division destiny by signal strength. Journal of Immunology (Baltimore, Md: 1950). 2008 Jul 1;181(1):374–382. PubMed PMID: 18566403; eng.
- Hawkins ED, Turner ML, Wellard CJ, et al. Quantal and graded stimulation of B lymphocytes as alternative strategies for regulating adaptive immune responses. Nat Commun. 2013;4:2406. PubMed PMID: 24009041; PubMed Central PMCID: PMCPmc3778729. eng.
- Ladha MH, Lee KY, Upton TM, et al. Regulation of exit from quiescence by p27 and cyclin D1-CDK4. Mol Cell Biol. 1998 Nov;18(11):6605–6615. PubMed PMID: 9774675; PubMed Central PMCID: PMCPmc109245. eng.
- Glynne R, Ghandour G, Rayner J, et al. B-lymphocyte quiescence, tolerance and activation as viewed by global gene expression profiling on microarrays. Immunol Rev. 2000 Aug;176:216–246. PubMed PMID: 11043780; eng.
- Yusuf I, Fruman DA. Regulation of quiescence in lymphocytes. Trends Immunol. 2003 Jul;24(7):380–386. PubMed PMID: 12860529.
- Chen J, Yusuf I, Andersen HM, et al. FOXO transcription factors cooperate with delta EF1 to activate growth suppressive genes in B lymphocytes. Journal of Immunology (Baltimore, Md: 1950). 2006 Mar 1;176(5):2711–2721. PubMed PMID: 16493026; eng.
- Kharas MG, Yusuf I, Scarfone VM, et al. KLF4 suppresses transformation of pre-B cells by ABL oncogenes. Blood. 2007 Jan 15;109(2):747–755. PubMed PMID: 16954505; PubMed Central PMCID: PMCPmc1785099. eng.
- McConnell AM, Yao C, Yeckes AR, et al. p53 regulates progenitor cell quiescence and differentiation in the airway. Cell Reports. 2016 Nov 22;17(9):2173–2182. PubMed PMID: 27880895; eng.
- Yusuf I, Kharas MG, Chen J, et al. KLF4 is a FOXO target gene that suppresses B cell proliferation. Int Immunol. 2008 May;20(5):671–681. PubMed PMID: 18375530; eng.
- Tomura M, Sakaue-Sawano A, Mori Y, et al. Contrasting quiescent G0 phase with mitotic cell cycling in the mouse immune system. PloS one. 2013;8(9):e73801. PubMed PMID: 24066072; PubMed Central PMCID: PMCPmc3774768. eng.
- Marchingo JM, Kan A, Sutherland RM, et al. T cell signaling. antigen affinity, costimulation, and cytokine inputs sum linearly to amplify T cell expansion. Science. 2014 Nov 28;346(6213):1123–1127. PubMed PMID: 25430770; eng.
- Burnham KP, Anderson DR. Multimodel inference: understanding AIC and BIC in model selection. Sociol Methods Res. 2004;33(2):261–304.