
ABSTRACT
Cell cycle phase transitions are tightly orchestrated to ensure efficient cell cycle progression and genome stability. Interrogating these transitions is important for understanding both normal and pathological cell proliferation. By quantifying the dynamics of the popular FUCCI reporters relative to the transitions into and out of S phase, we found that their dynamics are substantially and variably offset from true S phase boundaries. To enhance detection of phase transitions, we generated a new reporter whose oscillations are directly coupled to DNA replication and combined it with the FUCCI APC/C reporter to create “PIP-FUCCI”. The PIP degron fusion protein precisely marks the G1/S and S/G2 transitions; shows a rapid decrease in signal in response to large doses of DNA damage only during G1; and distinguishes cell type-specific and DNA damage source-dependent arrest phenotypes. We provide guidance to investigators in selecting appropriate fluorescent cell cycle reporters and new analysis strategies for delineating cell cycle transitions.
Introduction
The eukaryotic cell division cycle is tightly regulated to ensure timely cell proliferation while maintaining genome stability. For this reason, monitoring progression through the sequential cell cycle phases is an important component of many biological studies. A variety of quantitative tools are in wide use to assess cell cycle phase position (analytical flow cytometry, antibody markers of cell cycle proteins, DNA stains, etc.), but most require harvesting cells at a single time point and thus provide little or no information about cell cycle dynamics. Until recently, most cell cycle dynamics information has come from arresting cell populations at a single cell cycle phase and collecting time points after release from the cell cycle block. The synchronization methods themselves introduce strong perturbations and cellular stresses. These are not well tolerated by all cell lines, and the perturbations can confound interpretation. Moreover, intercellular heterogeneity after release from a block leads to rapid loss of synchrony in nearly all mammalian cell lines, further blurring the dynamics of cell cycle progression.
To address these limitations, automated time-lapse live imaging of actively proliferating cells has become an increasingly popular method for studying cell cycle dynamics. This approach is particularly powerful because the time resolution can be high (minutes or even seconds) relative to cell cycle length (hours or days), and the pitfalls of artificial synchronization are bypassed. Cell timelines can be readily synchronized in silico to derive a statistical average of the population [Citation1]. Importantly, analyzing single cells reveals unique behaviors in subpopulations that would be missed by ensemble assays such as immunoblots or proteomics [Citation2,Citation3].
The Fluorescent Ubiquitination-based Cell Cycle Indicator (FUCCI) system was developed in 2008 by Miyawaki and colleagues [Citation4]. This system identifies cell cycle phases based on the presence or absence of two differently colored fluorescent tags on two cell cycle-regulated protein fragments. It has been widely adapted and modified for different species as well as for different applications [Citation4–Citation8]. Despite its broad utilization, the dynamics of these reporters relative to the landmark events of S phase entry and exit have not been closely analyzed. The switch from accumulation to degradation of the G1 FUCCI reporter is routinely interpreted as marking the onset of DNA replication, although that assumption has not been rigorously tested. Moreover, the FUCCI system reporters rarely show the abrupt changes in protein abundance that would be needed to clearly delineate the G1 to S phase transition due to slow degradation and accumulation/detection rates of the two reporters [Citation9]. Recently Sakaue-Sawano and colleagues described the development of a new set of FUCCI variations that provide an improved demarcation of the G1 to S phase transition. However, these derivative reporter systems have not been quantitatively characterized to determine both the precision in detecting phase boundaries as well as the cell-to-cell heterogeneity in the dynamics of phase transitions.
To provide deeper insights for interpretation and utilization of the original FUCCI reporters currently in widespread use for mammalian proliferation studies, we extensively quantified their dynamics relative to DNA replication. We demonstrate here that the ability of the original FUCCI reporters to mark the G1/S transition is very sensitive to reporter expression levels, and that one of the reporters requires a phosphomimetic amino acid in the expression vector. For comparison, we developed and validated a minimal FUCCI variant, PIP-FUCCI, that precisely indicates the transitions into and out of S phase. This reporter system is resistant to moderate doses of DNA damage and identifies different cell cycle arrest phenotypes. The reporter dynamics and analysis strategies here are broadly applicable to many future studies of cell proliferation and genome stability.
Results
Original FUCCI dynamics are offset from the G1/S phase transition
Our first goal was to comprehensively define the dynamics of the original FUCCI reporters relative to the boundaries of S phase. To this end, we stably expressed a direct DNA replication biosensor [Citation10–Citation12], the full-length PCNA protein fused to mTurquoise2 (mTurq2-PCNA), in a population of U2OS cells (human osteosarcoma). We expressed the PCNA fusion at a low level (Fig. S1A) and observed no deleterious effects on cell proliferation in standard culture or under imaging conditions (unpublished observations). Selected images from each hour of a cell cycle of one cell expressing mTurq2-PCNA are shown in (top row). The transition from diffuse to punctate and from punctate back to diffuse marks the G1/S and S/G2 transitions respectively, and these changes are often visible between two consecutive frames of the video (i.e. within 10 minutes). To automatically detect S phase boundaries, we used a sensitive approach based on calculating the spatially-localized variance of PCNA intensity across the nucleus (Fig. S1 B-D, details of analysis in Materials and Methods section). The variance is quantified over time by the black line in with time zero set to the first frame after cytokinesis. The rapid increase in PCNA variance indicates the onset of DNA replication whereas the steep drop in PCNA variance indicates the end of S phase. Thus, we can precisely define the time relative to S phase entry and exit of any given cell. For display purposes we use gray shading to indicate S phase duration calculated by PCNA variance here and in subsequent figures ().
Figure 1. FUCCI dynamics are offset from S phase. a) Selected images from wide field time-lapse imaging of a U2OS cell expressing mTurq2-PCNA and FUCCI fragments Cdt130-120-mCherry and Gem1–110-Citrine. One frame from each hour beginning after cytokinesis is shown with the nucleus outlined; numbers in the upper strip indicate hours since mitosis. Scale bar 10 µm. b) Quantification of fluorescence signals from the single cell presented in 1A. Mean fluorescence intensity of FUCCI fragments within nuclear regions were normalized to their maximum values. The PCNA signal variance produced by PCNA loading into nuclear foci was analyzed as described in Materials and Methods; the gray rectangle marks S phase. c) Schematic of the two fluorescent fragments used in FUCCI reporters from Sakaue-Sawanao 2008 and closely related derivatives [Citation4]. The human Cdt1 S31 phosphorylation site is indicated by a circle. Human geminin motifs for targeting by APCCdh1, D box (magenta line), and KEN motifs (blue lines) are marked. d) Illustration of the time warping method to align many traces from individual cells for inspection of cell cycle phase transitions (for details see Materials and Methods). e) Single cell traces (gray lines) and mean (magenta and green) of FUCCI reporter dynamics in individual U2OS cells of a clonal population. All traces were warped as in 1D, the total time between cell divisions is set to one hundred percent, and gray rectangles show the median S phase period of the population based on PCNA foci. Cells were imaged every 10 min (n = 107). f) The correlation of the Cdt130-120 maximum signal (see 1C) and the time delay between S phase onset determined by PCNA foci and the time of Cdt130-120 peak in individual cells in 1E. The teal line represents the best fit linear model. g) The correlation of the Cdt130-120 maximum signal (see 1C) and the time delay between S phase onset determined by PCNA foci and the disappearance of Cdt130-120 signal (as indicated by Cdt1 min in 1B) in individual cells in 1E. The teal line represents the best fit linear model.
![Figure 1. FUCCI dynamics are offset from S phase. a) Selected images from wide field time-lapse imaging of a U2OS cell expressing mTurq2-PCNA and FUCCI fragments Cdt130-120-mCherry and Gem1–110-Citrine. One frame from each hour beginning after cytokinesis is shown with the nucleus outlined; numbers in the upper strip indicate hours since mitosis. Scale bar 10 µm. b) Quantification of fluorescence signals from the single cell presented in 1A. Mean fluorescence intensity of FUCCI fragments within nuclear regions were normalized to their maximum values. The PCNA signal variance produced by PCNA loading into nuclear foci was analyzed as described in Materials and Methods; the gray rectangle marks S phase. c) Schematic of the two fluorescent fragments used in FUCCI reporters from Sakaue-Sawanao 2008 and closely related derivatives [Citation4]. The human Cdt1 S31 phosphorylation site is indicated by a circle. Human geminin motifs for targeting by APCCdh1, D box (magenta line), and KEN motifs (blue lines) are marked. d) Illustration of the time warping method to align many traces from individual cells for inspection of cell cycle phase transitions (for details see Materials and Methods). e) Single cell traces (gray lines) and mean (magenta and green) of FUCCI reporter dynamics in individual U2OS cells of a clonal population. All traces were warped as in 1D, the total time between cell divisions is set to one hundred percent, and gray rectangles show the median S phase period of the population based on PCNA foci. Cells were imaged every 10 min (n = 107). f) The correlation of the Cdt130-120 maximum signal (see 1C) and the time delay between S phase onset determined by PCNA foci and the time of Cdt130-120 peak in individual cells in 1E. The teal line represents the best fit linear model. g) The correlation of the Cdt130-120 maximum signal (see 1C) and the time delay between S phase onset determined by PCNA foci and the disappearance of Cdt130-120 signal (as indicated by Cdt1 min in 1B) in individual cells in 1E. The teal line represents the best fit linear model.](/cms/asset/b560a652-d527-4899-bcb5-bbc5f28da7db/kccy_a_1547001_f0001_oc.jpg)
The original FUCCI reporters are fragments of two reciprocally-regulated DNA replication origin licensing regulators, human Cdt1 and human Geminin [Citation4]. We analyzed FUCCI reporters – Cdt130-120 expressed as a fusion to mCherry and Gem1-110 expressed as a fusion to Citrine () in the same cells as mTurq2-PCNA (). We selected clonal populations expressing all three reporters. We subjected these cells to time-lapse fluorescence imaging over the course of 72 hours of unperturbed proliferation and collected images every 10 minutes. We detected no significant changes in cell cycle duration among cells analyzed early or late in the imaging period (Fig. S2A). We employed semi-automated segmentation and tracking tools to efficiently generate many fluorescence intensity traces from each experiment for statistical analysis.
We next sought to quantify the timing of the FUCCI system relative to PCNA-based cell cycle phase detection. We observed that peak expression of mCherry-Cdt130-120 occurred well after Citrine-Gem1-110 began to accumulate and PCNA had formed puncta. Traces of these three reporters from a single cell are shown in . The increase in Citrine-Gem1-110 accumulation closely coincided with the onset of S phase in this individual U2OS cell, but the degradation of mCherry-Cdt130-120 was delayed. This overlap of the Cdt1-based reporter with early S phase is consistent with the detection of BrdU-incorporation in Cdt130-120-expressing cells shown previously [Citation4,Citation9] and has been observed in other cell types [Citation13]. Moreover, mCherry-Cdt130-120 was still detectable even into late S phase ().
Because cell cycle phase durations vary among single cells [Citation3,Citation14–Citation19], to visualize FUCCI reporter dynamics at S phase transitions in a population of cells we developed a computational strategy to adjust for cell-to-cell variation in phase duration. Using PCNA variance-based phase boundaries, we independently interpolated individual traces within each G1, S phase, and G2/M period. We adjusted these three portions for each trace to the length of the median fraction of total cell cycle duration in the cell population (G1: 22%, S: 53%, and G2/M: 25% in this population of U2OS cells, ). This phase-specific “time warping” provides enhanced time resolution compared to aligning only to a single event (e.g. cytokinesis) and accentuates rapid events that occur near S phase transitions. We did not observe any artifacts near the phase transitions from applying this method to an unregulated nuclear reporter, NLS-Venus (Fig. S2B). Using this approach, we observed that the onset of Citrine-Gem1-110 accumulation began consistently close to the beginning of S phase whereas the substantial delay in the peak of mCherry-Cdt130-120 relative to S phase onset was apparent in the majority of U2OS cells (). Time warping was used solely for visualization purposes; quantification was performed on original traces. Interestingly, the offset between the start of S phase and the onset of mCherry-Cdt130-120 degradation was correlated with the expression level of the Cdt130-120 reporter (). This offset reveals an important caveat for using peak Cdt130-120 expression to mark the timing of the G1/S transition: the accuracy of marking the G1/S transition is highly dependent on reporter expression in any given cell. Similarly, the timing of complete mCherry-Cdt130-120 degradation also correlated with the maximum intensity expression (). These results were reproducible in an independent U2OS clone with particularly high reporter expression (Fig. S2C) and confirmed in image and flow cytometry experiments (Fig. S2D-E).
Original FUCCI dynamics rely on a phosphomimetic glutamate residue in the linker
An important strength of the FUCCI reporter system is the use of inactive protein fragments of both Cdt1 and Geminin. Interestingly, selection of the Cdt130-120 fragment interrupts the primary CDK phosphorylation site for SCFSkp2 E3 ubiquitin ligase recognition, the threonine-proline at positions 29–30 in the native protein. A second CDK site is serine-proline at 31–32, but prior work indicated that this site is a weak target for SCFSkp2 binding [Citation20,Citation21]. We therefore considered the possibility that the offset of Cdt130-120 degradation occurs because the major SCKSkp2 binding site at T29 is missing.
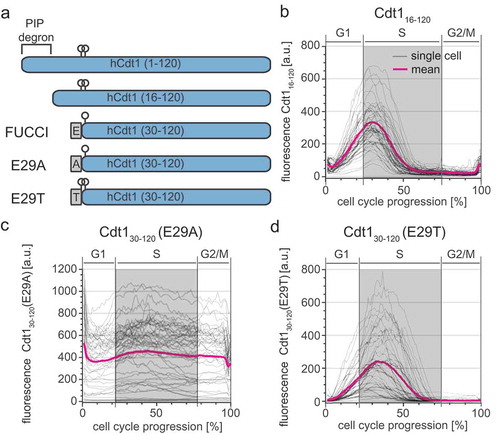
To test if a reporter containing the complete CDK-dependent phosphodegron marks the onset of S phase more precisely, we expanded the Cdt1 fragment to include amino acids 16 to 120 (). We stably expressed mCherry-Cdt116-120 in U2OS cells and monitored its dynamics relative to the S phase boundaries defined by mTurq2-PCNA as in . Despite the addition of the primary phosphorylation site at T29, the mCherry-Cdt116-120 fragment accumulated and degraded with kinetics similar to FUCCI mCherry-Cdt130-120 (). Upon closer inspection of the sequences of the original FUCCI construct, we noted the presence of a glutamate contributed by the linker connecting Cdt130-120 to the fluorescent protein in both the original construct and a derivative for expression in stem cells (ES-FUCCI) [Citation4,Citation22]. Since glutamate can sometimes mimic constitutive phosphorylation (see [Citation23] for an in-depth discussion), we hypothesized that the glutamate residue at this position analogous to T29 in native Cdt1 mimics Cdt1 phosphorylation for SCFSkp2 targeting. To test this idea directly, we constructed two variants of the linker with either alanine (E29A) or threonine (E29T) at the final position of the linker which corresponds to position 29 (i.e. threonine) in full length Cdt1 (). Cdt1 oscillations were virtually abolished in the E29A variant (), suggesting that S31 is either not phosphorylated or, as in native Cdt1, is not an effective Skp2 binding site. On the other hand, the E29T variant phenocopied the original Cdt130-120 reporter containing glutamate in its linker (). We conclude that the original Cdt130-120 FUCCI fragment oscillates because of a phosphomimetic glutamate residue in the linker region that compensates for the absence of the original phosphothreonine in native Cdt1. Moreover, since E29T, the original FUCCI fragment and linker (E29), and the Cdt116-120 constructs all have similar cell cycle kinetics, we postulate that they are approximately equivalent SCFSkp2 activity sensors in these cells. Moreover, the E29 version is a strict SCFSkp2 activity biosensor that is independent of substrate phosphorylation.
Figure 2. FUCCI Cdt130-120 is a phosphomimetic SCFSkp2 sensor. a) Schematics of the first 120 amino acids of Cdt1 and the four different reporter fragments analyzed in this study. Relevant phosphorylation sites are indicated by circles; linker regions derived from expression vectors are gray rectangles. b) Dynamics of the Cdt116-120-mCherry reporter throughout the cell cycle analyzed as in . Gray lines are 50 randomly selected cells and the magenta line is the mean signal for the population (n = 52). c) Dynamics of the Cdt130-120 (E29A)-mCherry reporter (50 random traces (gray) and mean of the population (magenta), n = 107). d) Dynamics of the Cdt130-120 (E29T)-mCherry reporter (50 random traces (gray) and mean of the population (magenta), n = 73).
PIP-FUCCI is a direct S phase sensor
Although the PCNA reporter precisely marks the boundaries of S phase, its use requires high-resolution microscopy and image processing that is more complex than simple fluorescence intensity measurements. Therefore, the simplicity of the degradation-based FUCCI system is an attractive practical feature. The new generation of FUCCI sensors [Citation24] preserves this simplicity of analysis while benefiting from employing the replication-coupled destruction by CRL4Cdt2. This coupling is achieved because many substrates of the CRL4Cdt2 E3 ubiquitin ligase are only recognized for ubiquitylation when bound to DNA-loaded PCNA which is an integral component of replication forks in S phase.
Here we introduce and characterize an independently developed minimal version of CRL4Cdt2-dependent FUCCI sensor. The expression construct consists of the PCNA-interacting protein (PIP) degron from human Cdt1 (Cdt11-17), fused to a nuclear localization sequence, an HA tag, and the mVenus fluorescent protein; we named this fusion “PIP-mVenus”. The Cdt1 PIP degron has been well-characterized both in native Cdt1 and as a fusion to heterologous proteins ([Citation25,Citation26], reviewed in [Citation27]). Fusing the Cdt1 PIP degron to heterologous proteins confers particularly rapid replication-coupled degradation compared to the PIP degron from another CRL4Cdt2 substrate, the CDK inhibitor p21 [Citation25]. We expressed this replication sensor with a P2A “self-cleaving” peptide linker to the same mCherry-Gem1-110 from the original FUCCI system [Citation28]. We refer to this construct (PIP-mVenus-P2A-mCherry-Gem1-110) as “PIP-FUCCI” (PIP-Fluorescent Ubiquitylation Cell Cycle Indicator) ().
We stably expressed this two-reporter single construct in U2OS cells with the PCNA reporter with no deleterious effects to cell cycle phase distribution (Fig. S3A) and collected time-lapse images as before. PIP-mVenus fluorescence was rapidly lost at the onset of DNA replication concurrent with PCNA foci formation ( and Supplementary Movie 1). At the end of S phase, PIP-mVenus accumulated throughout G2 in an almost linear fashion. The changes in PIP-FUCCI protein dynamics at the G1 to S phase transition and the S phase to G2 transition closely corresponded with the changes in PCNA variance associated with DNA replication. To test if the new PIP-mVenus fusion is strictly absent throughout all of S phase, we imaged cells every 10 minutes for 22 hours followed by a pulse of EdU for 30 minutes. After processing for EdU detection, we matched cells to their time lapse images. Unlike the reporters based on Skp2 targeting, PIP-mVenus positive cells were EdU-negative with diffuse PCNA localization, whereas all EdU-positive cells were PIP-mVenus-negative with focal PCNA localization ().
Figure 3. PIP-FUCCI is a precise cell cycle phase indicator. a) Schematic of the PIP-FUCCI dual reporter expression construct. Cdt11–17 = human Cdt1 amino acids 1-17 including the PIP degron, NLS = SV40 nuclear localization signal, HA = epitope tag, P2A = self-cleaving peptide, Gem1-110 = human Geminin amino acids 1-110 including both the D box and KEN motif. b) Selected images from wide field time-lapse imaging of a U2OS cell expressing mTurq2-PCNA and the PIP-FUCCI reporters PIP-mVenus and mCherry-Gem1-110. One frame from each hour beginning after cytokinesis is shown with the nucleus outlined; numbers in the upper strip indicate hours since mitosis. Scale bar 10 µm. c) Quantification of PCNA variance (black line) and PIP-FUCCI reporter fluorescence signals (green and magenta lines) from the cell in 3B. d) Dynamics of the PIP-mVenus reporter (left) and the mCherry-Gem1-110 (right) throughout the cell cycle. Gray lines are 100 randomly selected cells and heavy colored lines are the mean signal in the population (n = 125). S phase boundaries were determined by PCNA localization and are indicated with a gray rectangle; warping as in . e) Heat map of the signal intensity values of PIP-mVenus (green) in 55 asynchronously growing cells before EdU labeling. EdU intensity value (right) of the 55 cells. White dots indicate the beginning and end of S phase annotated manually based on the PCNA signal. f) Micrographs of selected asynchronously growing U2OS cells before EdU labeling (PCNA, PIP, and Gem1-110) and after labeling (DAPI and EdU). The cell cycle phase of each cell is indicated in the most right panel. Scale bar, 25 µm.
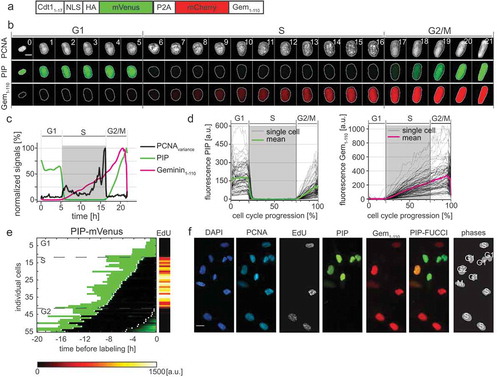
The remarkably tight correlation between PIP-mVenus degradation and the entirety of S phase combined with the restriction of mCherry-Gem1-110 expression to S phase and G2 provides a means to unambiguously identify cell cycle phases in fixed cells. To illustrate this use, we analyzed cells by PIP-mVenus and mCherry-Gem1-110 expression and secondarily by PCNA localization and EdU incorporation (). We readily identified G1 cells as mVenus single-positive, S phase cells as mCherry single positive, G2 cells as nuclear mVenus and mCherry double-positives; and M phase cells had both fluorescent proteins diffusely expressed since their nuclear envelopes had been disassembled. Thus, just two reporters (PIP-mVenus and mCherry-Gem1-110) are sufficient to accurately identify cell cycle phases in fixed cells.
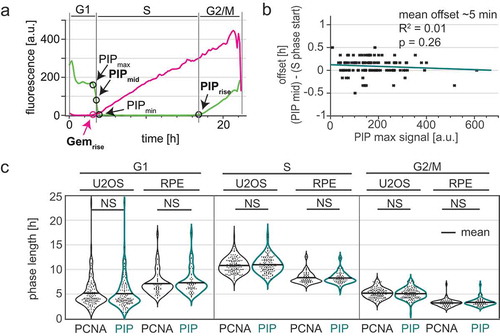
Because measuring PCNA variance is technically more demanding than measuring PIP-mVenus signal intensity, we performed a detailed analysis of the reliability for calling cell cycle phases in time lapse experiments using only the intensity levels of PIP-mVenus and compared this approach to measuring PCNA variance. We defined the start of S phase as the point when the intensity value of PIP-mVenus was half of its maximal value in G1; we call this point “PIPmid” (); we note that this point is a few minutes after the true S phase onset given the requirement for PCNA loading before PIP-mVenus degradation. When using PIP-mVenus as an indicator of the S to G2 transition we use the onset of signal accumulation (termed “PIPrise”). PIP-mid is tightly correlated with the onset of PCNA foci formation (quantified by the increase in PCNA variance) with an offset of approximately 5 minutes. Importantly, unlike the broad S phase offset in Cdt130-120 degradation in cells with different reporter expression levels, Different PIP-mVenus reporter expression levels had virtually no effect on degradation timing relative to S phase; even high reporter expression accurately marks S phase onset (, p = 0.26). To further define the accuracy of PIP-FUCCI as a cell cycle reporter, we compared cell cycle phase durations defined by PCNA variance or PIP-FUCCI intensity levels in both U2OS cells and in a non-transformed human epithelial cell line, RPE-hTert (Supplementary Movie 2). We found PIP-FUCCI to be just as accurate as PCNA variance for defining cell cycle phases in both cell lines ().
Figure 4. The PIP degron fusion protein precisely marks the G1/S and S/G2 transitions. a) One annotated example of traces from a single U2OS cell expressing PIP-mVenus (green) and mCherry-Gem1-110 (magenta). “PIPmid” is the time at which 50% of the maximum PIP-mVenus signal is lost ((“PIPmax” – “PIPmin”)/2) and is used to mark the beginning of S phase. Details of trace annotations are described in Materials and Methods. b) Correlation of PIP-mVenus PIPmax level with the offset between the beginning of S phase (determined by PCNA foci) and PIPmid in individual U2OS cells. Teal line represents the best fit linear model (n = 121). c) Distributions of cell cycle phase lengths measured by PCNA foci and PIP-mVenus dynamics in U2OS (n = 121) and RPE-hTert (n = 57) cells. No differences between the pairs of distributions were detected according to Kolmogorov-Smirnov test (p > 0.05). Black line indicates mean.
The effects of DNA damage on PIP-FUCCI dynamics
In addition to being loaded at active DNA replication forks, PCNA is also loaded during DNA damage repair [Citation29–Citation34]. Since PCNA loading is a prerequisite for PIP-degron-containing substrate interactions with the CRL4Cdt2 E3 ubiquitin ligase [Citation35–Citation38], we considered the possibility that PIP-mVenus degradation could report DNA damage in addition to DNA replication. CRL4Cdt2-activity is itself also affected by the cell cycle timing of the DNA insult: CRL4Cdt2 substrates are efficiently degraded after DNA damage in G1, inefficiently degraded in G2 cells due to CDK1-mediated CRL4Cdt2 inactivation [Citation39,Citation40], and DNA damage induces little additional substrate degradation in S phase since PCNA is already loaded and CRL4Cdt2 is active during DNA replication [Citation27]. Thus, we predicted that PIP-mVenus has different behaviors after DNA damage depending on the cell cycle phase at the time of damage. To test that prediction, we treated PIP-FUCCI U2OS cells with a high dose (200 ng/mL) of the radiomimetic DNA damaging agent neocarzinostatin (NCS) (). We imaged cells for approximately 24 hours before NCS treatment to establish a precise cell cycle position at the time of damage. As expected, NCS-treated U2OS cells in G1 rapidly lost PIP-mVenus signal followed by gradual PIP-mVenus re-accumulation ( top left panel). In contrast, G2 cells showed only minor reduction in PIP-mVenus signal intensity upon NCS treatment ( top right panel and ). PIP-mVenus was undetectable in S phase and remained so after NCS treatment (i and unpublished observations). Thus, PIP-mVenus shows a rapid decrease in signal in response to large doses of DNA damage only during G1.
Figure 5. PIP-FUCCI dynamics after DNA damage. a) PIP-mVenus dynamics in control U2OS cells and cells treated with neocarzinostatin (NCS) (200 ng/ml). Upper graphs show PIP-mVenus traces from cells treated with NCS in G1 (left, n = 19) or G2 (right, n = 18). Lower graphs are traces from control cells in G1 (left, n = 18) or G2 (right, n = 22) phases. The traces end when cells enter S phase or mitosis respectively; x axis is experiment time in minutes, time of NCS addition is 0 (arbitrary time point was selected for control cells). b) Quantification of PIP-mVenus decline 120 minutes after NCS treatment in U2OS cells in G1 and G2 phases. (Left) Bars are the ratios of detected versus expected PIP-mVenus levels assuming steady signal in G1 phase and linear increase in G2 phase. (Right) Cartoon showing the principle of this analysis. As a control traces from untreated U2OS cells were analyzed with a randomly selected point of mock treatment (for further details see Materials and Methods). Bar graphs show mean ± standard deviation, Wilcoxon rank sum test, p < 0.0001 (G1 control n = 122, G1 NCS n = 19, G2 control n = 121, G2 NCS n = 14). c) Example micrographs and single cell quantification of PIP-FUCCI reporters in U2OS (i, n = 48) and RPE-hTert (ii, n = 59) cells 48 hrs after treatment with NCS. Dashed line indicates time of NCS addition x axis is time in hours. (iii) histogram from NCS-treated RPE-hTert cells as in ii plotting hours between the end of S phase defined by PIP accumulation and the start of degradation of mCherry-Gem1-110 in the absence of cell division (i.e. “mitosis skipping”) (iv) U2OS cells induced to re-replicate by overproducing full-length CDK-resistant Cdt1 (n = 32).
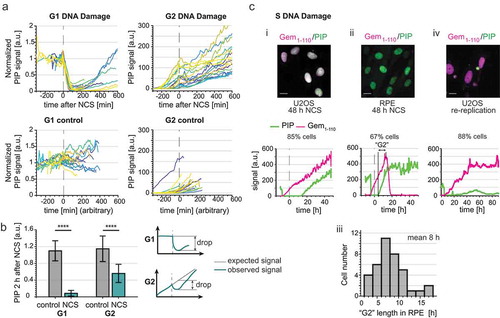
We next used PIP-FUCCI dynamics to investigate cell cycle fate after NCS treatment in S phase. Because the PIP-mVenus signal was already below the detection threshold, we did not observe a further decrease after NCS treatment (e.g. i lower panel, first ~ 10 hrs after NCS). U2OS cells treated with NCS in S phase subsequently arrested and steadily accumulated both PIP-mVenus and mCherry-Gem1-110 until the end of the imaging (example trace shown in i). The rate of increase of both reporters was similar to untreated G2 cells. This behavior is similar to our previous analysis of the G2 arrest in S phase-damaged U2OS cells [Citation41]. In contrast, untransformed RPE-hTert cells treated with NCS in S phase followed a different pattern of cell cycle reporter accumulation. After a variable arrest period with a mean of 8 hrs, cells expressed a stable amount of PIP-mVenus but then abruptly degraded mCherry-Gem1-110 (ii and iii). The rapid mCherry-Gem1-110 degradation is consistent with APCCdh1 activation despite the fact that the cells did not undergo nuclear envelope breakdown or cell division. We interpret this behavior as an indicator that cells could not maintain a full checkpoint arrest in G2 and reentered a G1 like state, bypassing mitosis and reactivating APCCdh1 [Citation42–Citation44].
Finally, we examined the reporter dynamics in cells experiencing damage from a different endogenously-generated source. We transduced U2OS cells with a full-length, hyperactive Cdt1 that is resistant to cyclin-dependent kinases to induce aberrant origin re-licensing after G1 phase [Citation45]. Origin re-licensing and re-firing is an endogenously-generated form of DNA damage that can occur in S or G2 [Citation46–Citation50]. We identified a subpopulation of cells that accumulated mCherry-Gem1-110, but without consistent accumulation of PIP-mVenus. For these cells, PIP-mVenus reporter fluorescence rose intermittently but did not accumulate as it did in G2 cells (iv). This pattern is consistent with perpetual DNA replication and targeting of CRL4Cdt2 substrates (as we had previously reported), and cells remaining in an S-phase like state [Citation49]. Taken together, these examples show that the relative accumulation and dynamics of the PIP-FUCCI reporters can distinguish cell type-specific and DNA damage source-dependent arrest phenotypes.
Geminin1-110 is not an accurate sensor of the G1/S transition
Proper identification of the G1 to S transition is crucial in cell cycle studies because the onset of S phase marks a critical and irreversible cellular commitment to proliferation. As discussed previously, PIP-mVenus is a direct indicator of replication because its dynamics are physically coupled to the PCNA replication fork protein ( and ). However, Gem1-110 is an indirect sensor of the G1/S transition that responds to APC/C ubiquitin ligase activity. Moreover, it has been recently proposed that APC/C inactivation marks the commitment point within G1 phase rather than the G1/S transition [Citation51]. To determine the relationship between the Gem1-110 reporter and the onset of S phase, we compared the dynamics of Gem1-110 to that of PCNA and PIP-mVenus. Interestingly, we observed substantial variation in the relative timing of initial mCherry-Gem1-110 accumulation and PIP-mVenus degradation in different cell lines ( and S3B). Since PIP-mVenus degradation is a near-exact marker of S phase onset (), the timing discrepancy means that mCherry-Gem1-110 is an imprecise marker of the G1 to S transition. In non-transformed RPE-hTert cells, mCherry-Gem1-110 was easily detectable before the degradation of PIP-mVenus whereas in U2OS cells it occurred at nearly the same time (). We refer to the difference between the onset of S phase (PIPmid) and in the initial rise of mCherry-Gem1-110 signal as the “Gem1-110 lag”, and its value was sometimes positive (PIP degradation occurs first) or negative (Gem accumulation occurs first). We also detected a correlation between G1 length of individual U2OS cells and mCherry-Gem1-110 lag (. Individual U2OS cells with short G1 lengths were more likely to begin mCherry-Gem1-110 accumulation after the beginning of S phase, whereas cells with longer G1 phases were more likely to accumulate mCherry-Gem1-110 coincident with (i.e. lag = 0) or preceding (i.e. negative lag) S phase onset. Even though the average lag of the U2OS population was close to zero, we did identify cells with delayed mCherry-Gem1-110 accumulation, and these cells had the shortest G1 phases. Unlike the G1 phase length associated lag with Gem1-110, PIP-mVenus degradation has no correlation with G1 length as measured by PCNA ( mean offset of 5 minutes).
Figure 6. Variable APCCdh1 reporter accumulation relative to the start of S phase in different cell lines. a) (Left) Micrographs of a single representative cell of RPE-hTert, U2OS, and T98G cells expressing PIP-FUCCI and mTurq2-PCNA; the red rectangle marks the frame of PIPmid. (Right) Quantification of PIP-FUCCI reporter intensities in the cells shown at left. PIPmax, PIPmid, PIPmin, and Gemrise are indicated by circles. Delay of Gemrise relative to both PIPmid is defined as “Gem1-110 lag”, and is an indicator of the relative timing of APCCdh1 inactivation and S phase onset. b) Heat map of the signal intensity values of PIP-mVenus (green) and Geminin1-110 (red) in asynchronously growing T98G cells before EdU labeling in the final 30 minutes. EdU intensity value (right, logarithmic scale) of the individual cells. White dots indicate the points of degradation and re-accumulation of PIP-mVenus. c) PIP-FUCCI signals from a single T98G cell before EdU labeling in early S phase. Cells were labelled with EdU for the final 30 minutes of the experiment. d) (Left) Quantification of the mean Gem1-110 lag in untreated, asynchronous RPE-hTert (n = 56), U2OS (n = 120), and T98G cells (n = 51). Gemrise that precedes S phase onset has a negative value. (Right) Distributions of G1 length in different cell lines as measured by PIP-mVenus dynamics (RPE-hTert n = 56, U2OS n = 120, T98G n = 51). e) Correlation between G1 length and Gem1-110 lag in untreated asynchronous U2OS cells (n = 120). f) Correlation between G1 length and PIP-mVenus S phase offset in U2OS cells (n = 120).
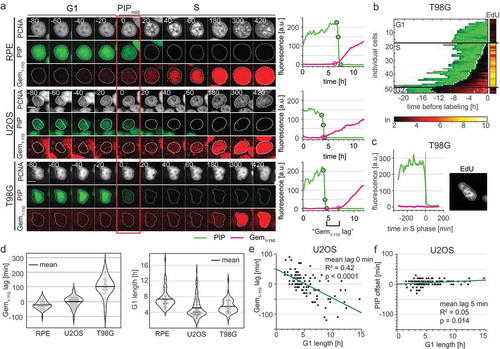
Surprisingly, mCherry-Gem1-110 detection was significantly delayed in comparison to PIP-mVenus in the glioblastoma-derived T98G cell line ( bottom set, , , and positive lag quantified in ). We considered the possibility that the unexpected dynamics of the Gem1-110 APCCdh1 reporter relative to S phase may be either an issue with S phase detection or a technical issue with mCherry-Gem1-110 detection itself. We note that any biosensor that relies on accumulation to mark a biological event is sensitive to artifactual delays from synthesis, fluorophore folding, and imaging conditions that combine to set the threshold of detection. It was possible that mCherry-Gem1-110 reflected S phase dynamics but that PIP-mVenus was degraded prematurely during G1 phase in some cells. To directly test PIP-mVenus in T98G cells with delayed mCherry-Gem1-110 accumulation, we imaged asynchronous T98G cells expressing PIP-FUCCI for 24 hours before adding EdU for the last half hour of imaging. We fixed and stained for DNA synthesis (EdU) and DNA (DAPI). We matched the individual cells pre-fixing and post-fixing and confirmed that PIP-mVenus was expressed throughout the entirety of G1 (). We also found no PIP-mVenus–negative cells that were not also clearly EdU-positive. More importantly, we found multiple examples of EdU-positive cells that did not yet have detectable mCherry-Gem1-110 ( and S3C). Thus, the mCherry-Gem1-110 reporter was indeed detected well after S phase onset in a substantial subpopulation of T98G cells. Furthermore, we detected mCherry-Gem1-110 rise earlier in cells with higher maximum reporter expression (Fig. S4). This correlation further emphasizes that, like the Cdt1-derived SCF reporters, Gem1-110-based reporters are not reliable markers of S phase entry per se.
Discussion
In this report we make three principal contributions: 1) We provide the first comprehensive quantitative and mechanistic analysis of the widely-used FUCCI reporters that are based on human Cdt130-120 fusions; 2) We thoroughly validate a new minimal replication-coupled destruction reporter and compare it to another replication-based reporter, PCNA; and 3) We compare the dynamics of replication-based and APC/C-based reporters at the G1/S transition in multiple cell lines. We describe here some of the implications of these results and suggest strategies for selecting and interpreting mammalian cell cycle reporters.
Interpreting original FUCCI dynamics
The FUCCI Cdt130-120 fusion is a reporter of SCFSkp2 activity per se, but does not precisely define the boundaries of S phase (). The fusion continues to accumulate after S phase starts, and its abundance is generally low from late S through G2 and M phase (). This pattern reflects the abundance and activity of the Skp2 substrate adapter protein, which itself is a substrate of APCCdh1 [Citation52,Citation53]. In that sense, Cdt130-120 is in fact an indirect reporter of APCCdh1. This behavior precludes using Cdt130-120 to mark either of the S phase boundaries. Moreover, the peak of Cdt130-120 relative to S phase time varies with the level of reporter expression in individual cells, so it is not possible to correctly mark S phase by subtracting or adding a constant time from the peak. In other words, investigators can assume that S phase started some time before the Cdt130-120 peak, but they cannot reliably determine the magnitude of this offset in individual cells, even in clonally-selected populations. This behavior may be problematic for studies in which distinguishing G1 cells from early S phase cells is important.
Table 1. Cell cycle reporters for use in mammalian cells.
It is important to note that FUCCI strategies for use in Drosophila melanogaster (“Fly-FUCCI”) and Danio rerio (“zFUCCI”) both contain PIP degrons from dmE2F and zCdt1 respectively [Citation6–Citation8]. These derivatives are subject to replication-coupled destruction similar to the PIP-mVenus reporter here as well as two recent “hCdt1(1/100)” reporters from Sakaue-Sawano 2017. These PIP degron-containing reporters are bona fide S phase indicators and therefore direct cell cycle biosensors. A Cdt1-based cell cycle reporter for use in plants has also been described using a C-terminal fragment of plant Cdt1. This fragment accumulates in S and G2 similar to human Gem1-110, has no readily-identifiable PIP degron, and contains motifs that suggest plant Cdt1 may be an APC/C substrate rather than a CRL4Cdt2 substrate [Citation54].
We also demonstrate here that oscillations of the original FUCCI Cdt130-120 reporter are entirely dependent on a non-native glutamate residue corresponding to position T29 in the human Cdt1 phosphodegron. A reporter lacking the glutamate but retaining the potentially redundant S31 failed to oscillate (), and the inability of S31 to substitute for T29 is consistent with a prior Cdt1 study [Citation20]. We presume that the glutamate is a serendipitous contribution from the vector sequence in the original expression construct. We postulate that the reason the original Cdt130-120 reporter only oscillated when fused to one of the four tested fluorescent proteins is that other expression vectors lacked the phosphomimetic residue. Failure of reporters based on human Cdt130-120 to oscillate in zebrafish or fruit flies may also be related to the vector sequences used in those attempts and not an intrinsic property of either human Cdt1 or the suggested species-specific differences in SCFSkp2 [Citation6,Citation7]. Interestingly, glutamate and threonine at position 29 were equivalent for generating a SCFSkp2 reporter. In native Cdt1, T29 is phosphorylated by Cyclin A/Cdk2 during S phase, and the phosphorylation creates a binding site for the Skp2 substrate targeting subunit of SCF [Citation20]. It was possible that our test reporters with threonine instead of glutamate in that position would have different dynamics since the threonine-bearing reporters integrate both cyclin A-mediated phosphorylation and SCFSkp2 activity whereas the phosphomimetic FUCCI requires only Skp2 activity. The patterns of the FUCCI reporter and both phospho-dependent SCF reporters (Cdt116-120 and FUCCIE29T) were remarkably similar however (, , and ). We suspect therefore that the threonine-bearing reporters are likely fully phosphorylated, at least in the U2OS cells we analyzed, although were unable to test this hypothesis directly. By extension, cyclin A/Cdk2 activity would be delayed from the onset of S phase and is not rate-limiting for targeting by SCFSkp2; this relationship may also apply to endogenous Skp2 targets.
PIP-FUCCI is a precise marker of S phase
Three recent studies used fluorescent fusions to PCNA or a PCNA nanobody to track the formation of DNA replication foci, and thus S phase, in living cells [Citation12,Citation55,Citation56]. These approaches take advantage of the well-established patterns of DNA replication “factories” in mammalian cells that are readily detected as foci of nucleotide incorporation or by probing for replication fork proteins such as PCNA [Citation9,Citation10,Citation57,Citation58]. Changes in PCNA localization are sufficient to mark the boundaries of S phase, and successful use of this strategy can precisely mark all four major cell cycle transitions using a single fluorescence channel. One challenge for analyzing cell cycle progression by PCNA localization patterns is devising an image analysis pipeline that is unbiased, quantitative, and efficient. Burgess et al. quantified the number of PCNA foci within S phase, but this approach requires high magnification and high resolution images. We describe here the use of total PCNA signal variance which is amenable to lower-magnification/lower light-intensity images.
Despite the powerful advantages of using a single localization-based fusion to mark all cell cycle transitions, the requirements for this approach are still beyond what is feasible in some studies. We thus sought to create and thoroughly validate a simple intensity-based cell cycle reporter strategy. The G1/S transition and S/G2 transition reporter in our PIP-FUCCI system leverages a well-characterized replication-coupled destruction pathway in metazoan cells for S phase degradation via CRL4Cdt2. Degradation of the reporter relies solely on interaction of the minimal human Cdt1 PIP degron with PCNA when PCNA is loaded onto DNA. Reporter dynamics are thus a direct physical readout of DNA replication per se. Moreover, the very rapid degradation conferred by the Cdt1 PIP degron should make the G1/S transition particularly easy to identify in low-resolution images or even in tissues or organoids. Of particular importance, PIP-fusion reporter dynamics are unaffected by reporter expression within a broad range. In all analyzed cells where the reporter was expressed above background detection levels, it marked both the G1/S and S/G2 transitions as accurately as PCNA variance did. This robustness is in stark contrast to each of the SCFSkp2 reporters that had very different dynamics in different cells depending on the level of reporter expression. The PIP degron reporter can mark the same transitions as PCNA in time-lapse images, although it does not distinguish early from late S phase. In addition, PCNA is a more robust mark of the S/G2 transition in cells with lower PIP reporter fluorescence intensity, since the PIP reporter level must rise above background to identify the transition to G2.
The near-perfect correlation of PIP-FUCCI dynamics with S phase means that the PIP degron reporter is insensitive to typical levels of endogenously generated DNA damage; note that PIP reporter-negative cells were never EdU-positive () and ), so any endogenous damage was insufficient to induce PIP-mVenus degradation. We could trigger degradation of the PIP-mVenus reporter with relatively high doses of exogenous genotoxin in G1 phase however. Thus, in otherwise proliferating cells, PIP-degron degradation can be interpreted as a mark of S phase onset with confidence. Furthermore, even high doses of NCS could not induce total degradation of the PIP degron reporter in G2 cells. This stability is expected given reports by us and others that the CRL4Cdt2 E3 ligase is inactivated by CDK1 during G2 and M phase [Citation39,Citation40]. Thus, like endogenous Cdt1, the PIP degron reporter accumulates in G2 phase both because PCNA is unloaded from DNA and because CRL4Cdt2 is inactive. We emphasize, however, that the PIP degron reporter is not an accurate biosensor for endogenous full-length human Cdt1 dynamics. Many additional regulatory interactions, including CDK, SCF, and Geminin influence endogenous Cdt1 stability in late S phase and G2, at least in some cell lines and settings [Citation59–Citation62].
Selecting cell cycle reporters
For studies requiring the identification of cell cycle phases in mammalian cells, we provide suggestions for selecting the appropriate fluorescent reporters ( and ). Identifying cell cycle phases in fixed cells requires at least two fluorophores. We recommend either PIP-FUCCI described here or “FUCCI(CA)” from Sakaue-Sawano 2017. Both of these reporter pairs include the Geminin1-110 fragment which is necessary to distinguish G2 cells from G1 cells (e.g. ). The PIP-mVenus fusion contains 17 amino acids from Cdt1 which, to our knowledge, only binds PCNA and Cdt2, and it can be overproduced quite highly to distinguish S from G2 cells without any effect on either cell proliferation or the ability to precisely mark cell cycle transitions. FUCCI (SCA) is human Cdt1 1–100 which contains the strong cyclin A binding motif at amino acids 68–70. This inclusion raises the possibility of the reporter competing with endogenous cyclin A binding partners. The reporter also contains phosphorylation sites of unknown consequence and most of a negative regulatory domain of unknown mechanism that may influence Cdt1 chromatin binding [Citation21,Citation63]. The derivative reporter in the FUCCI(CA) pair, “hCdt1(1–100)Cy(-)”, has fewer of the considerations related to cycling binding, but the minimal PIP degron described here provides particularly robust identification of S phase transitions with no additional known interactions. Including a third reporter ensures that cells are visible even during early S phase when both reporters are quite low. For this third maker, we recommend PCNA or a fusion to histone H2B which mark the subphases of S phase and mitosis respectively.
Figure 7. An illustrated strategy for selecting cell cycle phase reporters for use in mammalian cells. See and Discussion for details.
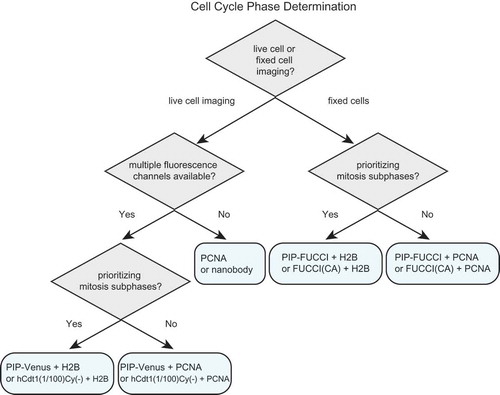
For time-lapse microscopy, several options are now available for dynamic cell cycle phase analysis. If only one fluorescence channel is available or desired, then a PCNA fusion or the PCNA nanobody or alternatively, the PIP degron fusion or hCdt1(1–100)Cy(-) can mark all four cell cycle phases. PCNA localization provides additional information about progression within S phase and does not require an additional channel for cell tracking. Relying on a single cell cycle reporter makes other fluorescence channels available for simultaneous analysis of additional reporters of interest, such as reporters of kinase activity (e.g. CDK, ERK, Akt), transcription (e.g. E2F), ubiquitin ligase activity (e.g. SCFSkp2 or APCCdh1) [Citation4,Citation64–Citation67]. Cell cycle phase analysis by PCNA localization requires time-lapse microscopy of sufficient resolution in cells with regular nuclear morphology to robustly detect the smaller PCNA foci in early S phase, but the dramatic dissolution of large foci at the end of S phase makes it an excellent marker of the S/G2 transition. On the other hand, Geminin1-110 fragment dynamics proved to be an unreliable marker of this transition in some cell lines. Therefore, Geminin1-110 should not be selected as a single biosensor unless activity of APC/C rather than cell cycle phase detection is required. When multiple fluorescence channels are available, we recommend including both a cell cycle phase reporter and a constitutively stable reporter for automated tracking (PCNA or histone H2B). Both the PIP degron reporter (i.e. PIP-mVenus) and Cdt1(1/100)Cy(-) are accurate reporters of the beginning and end of S phase, and the end of S phase is best visualized in cells with high reporter expression since it requires accumulation above the detection threshold.
Because DNA replication is an essentially irreversible step, S phase entry and progression is tightly regulated. Detecting the G1/S transition in living cells is not a simple technological task however. PIP-FUCCI is a precise method for demarcating cell cycle phase transitions in mammalian cells. Relative to first-generation FUCCI reporters, the simplicity of the new PIP-mVenus fragment reduces the number of confounding factors that must be considered when designing and interpreting experiments. PIP-FUCCI reagents are available to researchers for straightforward cell cycle phase determination. We anticipate that the ability to clearly distinguish G1 from S phase and S phase from G2 in both fixed and live cells will be particularly useful for investigations focused on cell proliferation commitment and the maintenance of genome stability.
Materials and methods
Cell culture and cell line construction
HEK293T, T98G, and RPE1-hTert (RPE) cells were obtained from the American Type Culture Collection (ATCC). U2OS cells were a gift from Dr. M. Whitfield. All cells were passaged in Dulbecco’s modified Eagle’s medium (DMEM, Sigma) supplemented with 10% fetal bovine serum (FBS, Sigma), 1x Pen/Strep, and 4mM L-glutamine and incubated at 37°C in 5% CO2. U2OS and RPE-hTert lines were authenticated by STR profiling (ATCC) and all lines were confirmed to be mycoplasma free. Cell lines were selected using the following concentrations of antibiotics: puromycin- 1 µg/mL for U2OS and T98G cells, 5–10 µg/mL for RPE cells; neomycin 100 µg/mL for RPE cells, 500 µg/mL for U2OS and T98G cells; hygromycin 150 µg/mL for U2OS and T98G cells; zeocin 100 µg/mL for U2OS and RPE cells, and blasticidin 10 µg/mL for U2OS, RPE, and T98G cells.
Cell transfection
X-tremeGENE 9 was used to transfect ES-FUCCI into RPE cells using the manufacturers recommended protocol. X-tremeGENE HP was used to transfect ES-FUCCI into U2OS cells following manufacturers recommended protocol. Cells with stable integration of the plasmid were selected using 500 µg/mL G418 (Gibco). Colonies from single cells were selected by visual inspection for even expression of fluorescently tagged proteins.
Cell transduction
To make stable cell lines using viral vectors initially HEK293T cells were transfected with pVSVG, pΔNRF (Gifts from Dr. J. Bear), and the viral vector of interest, using 50 µg/mL Polyethylenimine-Max (Aldrich Chemistry). Viral supernatant was transduced with 8 µg/mL Polybrene (Millipore) into U2OS cells for four hours or into RPE1 or T98G cells overnight.
Plasmid construction
All constructs were made using either the Gateway cloning method (Invitrogen) or by Gibson Assembly (New England Biolabs, NEB) following standard protocols. PCR fragments were amplified using Q5 polymerase (NEB). DNA fragments were isolated using the Qiaprep spin miniprep kit (Qiagen). The Cdt1 mutant used in the overexpression experiment has been described previously [Citation45] and was cloned in a similar fashion for viral transduction with pLenti PGK Neo. Plasmids were transformed into either DH5α or Stbl2. pENTR constructs were combined with the expression constructs: pLenti PGK Hygro DEST (w530-1), pLenti CMV Blast DEST (706–1), pLenti PGK Puro DEST (w529-2), and pLenti PGK Neo DEST (w531-1) were gifts from Eric Campeau and Paul Kaufman (Addgene plasmids # 19,066, 17,451, 19,068, and 19,067 respectively) using LR Clonase (Invitrogen). Plasmids were validated via sequencing (Eton Biosciences) for the desired insert using appropriate primers.
Total lysate
Total lysate was collected via trypsinization. Cells were washed with 1X phosphate buffer solution (PBS) and then centrifuged at 1700 x g. For total protein lysates, cells were lysed on ice in CSK buffer (300 mM sucrose, 100 mM NaCl, 3 mM MgCl2, 10 mM PIPES pH 7.0) with 0.5% triton X-100 and protease and phosphatase inhibitors (0.1 mM AEBSF, 1 mg/mL pepstatin A, 1 mg/mL leupeptin, 1 mg/mL aprotinin, 10 mg/ml phosvitin, 1 mM b-glycerol phosphate, 1 mM Na-orthovanadate). Cells were centrifuged at 13,000 × g at 4°C, then the supernatants were transferred to a new tube for a Bradford Assay (Biorad) using a BSA standard curve. Alternatively, an approximately equal number of cells were collected using SDS loading buffer.
Immunoblotting
Immunoblotting samples were diluted with SDS loading buffer (final: 1% SDS, 2.5% 2-mercaptoethanol, 0.1% bromophenol blue, 50 mM Tris pH 6.8, 10% glycerol) and boiled for 5 min. Samples were run on SDS-PAGE gels, then the proteins transferred onto polyvinylidene difluoride membranes (PVDF) (Thermo-Fisher). Membranes were blocked at room temperature for 1 hr in either 5% milk or 5% BSA in Tris-Buffered-Saline-0.1%-tween-20 (TBST). After blocking, membranes were incubated in primary antibody overnight at 4°C in either 1.25% milk or 5% BSA in 1X TBST. Blots were washed with 1X TBST then incubated in HRP-conjugated secondary antibody in either 2.5% milk or 5% BSA in 1X TBST, washed with 1X TBST, and then membranes were incubated with ECL Prime (Amersham) and exposed using Chemi-Doc (Bio-Rad). Equal protein loading was verified by Ponceau S staining (Sigma-Aldrich). Antibody used for immunoblotting: PCNA (Santa Cruz Biotechnologies, SC-25,250).
Cytometry
Separate cells for EdU-labeled samples versus non-EdU labeled were prepped. For the EdU-labeled samples, cells were incubated for 30 min with 10 uM EdU (Santa Cruz Biotechnology) prior to collection. Following EdU incubation, cells were washed with PBS and collected with trypsin, re-suspended, washed with 500 uL cold PBS (4C), and then fixed with 500 uL 4% paraformaldehyde (PFA) (Electron Microscopy Sciences, Hatfield, PA) in PBS for 15 min at room temperature. To pellet the cells, 1 mL of 1% BSA-PBS was added after 15 min., mixed and cells were centrifuged at 1000 xg for 7 min. Cells were then washed with 500 uL 1% BSA-PBS. Fixed cells were first centrifuged at 1000xg for 5 min., then permeabilized with 1 mL 0.5% triton X-100 in 1% BSA-PBS at room temperature for 15 min, centrifuged again at 1000xg for 5 min before labeling. EdU-labeled samples were centrifuged and incubated in total of 500 uL of PBS with 1 mM CuSO4, 1 mM AlexaFluor647 Azide, and 100 mM ascorbic acid (fresh in dH2O) for 30 min at room temperature in the dark. Following 30 min., 1 mL of 1% BSA-PBS + 0.5% triton X-100 was added, mixed and samples were centrifuged. Lastly, cells were resuspended in 500 uL 1% BSA-PBS + 0.5% triton X-100 with 1 mg/mL DAPI (Life Technologies) and 100 mg/mL RNAse A (Sigma Aldrich) and incubated overnight at 4°C in the dark. Samples were run on a ThermoFisher Attune NxT acoustic focusing cytometer (ThermoFisher, Life Technologies) and analyzed with FCS Express six software (De Novo, Glendale, CA). Cells were gated on FS-A vs SS-A. Singlets were gated on DAPI-A (linear) vs DAPI-H.
In image cytometry experiments the step of collecting pellets was skipped and cells were stained directly while attached to the surface prior to EdU imaging. After fixing and staining the cells were reimaged for EdU incorporation and DAPI staining at the same well locations as in the live cell movie so that the same cells could be used for the movie and fixed imaging analysis. Cells were scored for EdU incorporation vs cell cycle position in the live cell movie.
Live cell imaging
Prior to imaging cells were plated on glass-bottom plates (Cellvis) #1.5 in FluoroBrite DMEM (Invitrogen) supplemented with FBS, L-glutamine, and penicillin/streptomycin (imaging media). Imaging was performed using a Nikon Ti Eclipse inverted microscope using Plan Apochromat dry objective lenses 20x (NA 0.75) or 40x (NA 0.95) and the Nikon Perfect Focus System. Images were captured using an Andor Zyla 4.2 sCMOS detector with 12 bit resolution. Cells were imagined in a humidified chamber (Okolabs) at 37°C with 5% CO2. All filter sets were from Chroma, CFP – 436/20 nm; 455 nm; 480/40 nm (excitation; beam splitter; emission filter), YFP – 500/20 nm; 515 nm; 535/30 nm; and mCherry – 560/40 nm; 585 nm; 630/75 nm. Images were collected either every 6 or 10 minutes using NIS-Elements AR software. No photobleaching or phototoxicity was observed in cells imaged with this protocol.
DNA damage
Cells were treated with Neocarzinostatin (NCS, Sigma) at final concentration of 200 ng/ml (U2OS) or 100 ng/ml (RPE-hTert). To quantify the relative loss of PIP-mVenus signal due to DNA damage, we calculated the ratio of signal intensity 120 minutes after NCS addition to the expected signal intensity calculated by extrapolating the PIP-mVenus signal before treatment. For cells in G1 the expected signal levels in untreated cells were calculated by assuming no change over time. The expected signals for untreated G2 cells were calculated assuming a linear increase in signal intensity over time.
Image analysis
Image analysis was done using Fiji (version 1.51n, ImageJ NIH) software [Citation68].
Tracking and segmentation
Individual cells were segmented and tracked in time-lapse movies by a user-assisted approach. Prior to analysis, all movies were pre-processed using rolling ball background subtraction. Background subtracted movies were kept in a 16-bit format, and residual background values resulting from noise clipping were subtracted in a separate step. Individual tracks were collected using a set of in-house developed ImageJ scripts that facilitate manual tracking by hovering with a mouse cursor over a selected cell while the movie advances at a chosen speed. Using user-defined tracks, nuclear regions of interest (ROI) were segmented automatically based on intensity of selected tracking channel (PCNA) followed by separation of touching nuclei by a watershed algorithm and a set of morphological operations to define oval shaped nuclear ROIs. In case of failed segmentation, the user could choose to provide manually defined polygons as replacement ROIs. The same set of ROIs was used to analyze all fluorescence channels.
PCNA analysis
The PCNA pattern was analyzed within nuclear ROIs as defined by tracking and segmentation (above). Subsequently, images were processed in a series of steps implemented in Fiji (ImageJ): 1. Image smoothing using Gaussian Blur filter of small kernel (to remove high spatial frequency noise); 2. Removal of extensive darker regions corresponding to nucleoli using Remove Outliers algorithm of ImageJ; 3. Edge enhancement by calculation of local neighborhood variance using Variance filter (sigma 2–4 times bigger than the one used in step 1; exact values were adjusted based on cell line and magnification used); 4. Reduction of nuclear regions area to avoid artefacts of detecting nucleus boundaries (60% and 70% of original area in the first and second half of series respectively); 5. Quantification of processed PCNA signal. . A sum of mean and standard deviation of variance image (PCNA variance trace) showed the highest contrast at the beginning and the end of the S phase and was therefore used for cell cycle phase delineation. The beginning and end of S phase were detected automatically using the PCNA variance trace by smoothing this signal with filters of three different kernel sizes and looking for points that consistently showed highest change in value between G1/G2 and S phase. Cells not showing clear a point of phase transitions were manually removed from further analysis.
Phase warping of traces
The beginning and end of S phase were detected automatically based on PCNA variance trace as described above. Based on these values, the median durations of G1, S and G2/M phases were calculated for each analyzed cell population. These median values were used to calculate the percentage of total cell cycle time for each phase and create a cell cycle ‘blueprint’ of the population. Traces of individual cells were divided into G1, S, and G2/M, interpolated linearly within those given phases over the number of time points defined by the corresponding blueprint and then assembled to create a single phase warped signal.
PIP-FUCCI trace annotation
Important points within PIP and Geminin1-110 signals (min, mid, max and rise) were detected automatically in each original trace (without phase warping). The signals were normalized to the maximum observed within a cell cycle. Alternatively, in experiments in which full cycle traces were not available max signal for PIP-mVenus was defined as maximum value observed in G1 phase and for mCherry-Geminin1-110 an arbitrary point of normalization was set at 5 h after the studied event (drug treatment or phase transition as defined by PIP-mVenus). Signals were smoothed with a kernel size 3 before annotation. ‘PIP min’ was defined as the first point within the signal that drops below a 5% threshold while ‘PIP rise’ indicates a point of 2% increase. ‘PIP max’ was set at the point that marks a drop in signal at least 70% as steep as the maximum slope observed in each individual cell. ‘PIP mid’ was set at the point corresponding to 50% difference between ‘PIP min’ and ‘max’. Geminin1-110 ‘rise’ was defined as the first point that shows increase of either 3% over minimum signal or 5 arbitrary intensity units.
PIP signal after NCS treatment
An asynchronous population of PIP-FUCCI U2OS cells was imaged for 20 h before NCS treatment. Cells in G1 or G2 phases at the moment of NCS addition, as classified by PCNA pattern, were selected for analysis (tracking, segmentation of nuclear ROIs followed by PIP intensity measurement). The drop in signal was calculated based on the intensity traces of PIP 2 h after NCS treatment. In G1 cells, the drop was calculated as a change between mean signal before the stimulation and the signal measured 2 h after NCS treatment. In G2 cells it was assumed that PIP signal increases linearly within G2 phase. Signals from cells that showed at least three G2 measurements before NCS treatment were fitted to a linear function, and the parameters obtained were used to predict the signal intensity 2 h after NCS addition. The loss of PIP signal was measured as the difference between this prediction value and the actual measurement. As a control for this approach we analyzed a population of untreated cells in the same way, except that a mock NCS point was chosen randomly for each individual cell.
Statistical analysis
Statistical analysis was performed using Matlab (R2017b, MathWorks). Linear regression was performed using least-squares fit (“fitlm” function) with R2 indicating ordinary coefficient of determination and p-values indicating probability of null hypothesis according to t-statistics.
Supplemental Material
Download Zip (14.3 MB)Acknowledgments
We thank Jeffrey Jones for managerial assistance, Dr. Sam Wolff for microscopy assistance, and Cere Poovey for technical assistance. We also thank Dr. Steven Cappell, Dr. Robert Duronio, Dr. Michael Emanuele, and the members of our labs for helpful discussions.
Disclosure statement
No potential conflict of interest was reported by the authors.
Supplemental material
Supplemental data for this article can be accessed here.
Additional information
Funding
Related Research Data
References
- Davis DM, Purvis JE. Computational analysis of signaling patterns in single cells. Semin Cell Dev Biol. 2015 Jan;37:35–43. PubMed PMID: 25263011; PubMed Central PMCID: PMCPMC4339661.
- Matson JP, Cook JG. Cell cycle proliferation decisions: the impact of single cell analyses. FEBS J. 2017 Feb;284(3):362–375. PubMed PMID: 27634578; PubMed Central PMCID: PMCPMC5296213.
- Spencer SL, Cappell SD, Tsai FC, et al. The proliferation-quiescence decision is controlled by a bifurcation in CDK2 activity at mitotic exit. Cell. 2013 Sep 25. PubMed PMID: 24075009; Eng. DOI:10.1016/j.cell.2013.08.062
- Sakaue-Sawano A, Kurokawa H, Morimura T, et al. Visualizing spatiotemporal dynamics of multicellular cell-cycle progression. Cell. 2008 Feb 8;132(3):487–498. PubMed PMID: 18267078.
- Fukuhara S, Zhang J, Yuge S, et al. Visualizing the cell-cycle progression of endothelial cells in zebrafish. Dev Biol. 2014 Sep 1;393(1):10–23. PubMed PMID: 24975012.
- Sugiyama M, Sakaue-Sawano A, Iimura T, et al. Illuminating cell-cycle progression in the developing zebrafish embryo [Research Support, Non-U.S. Gov’t]. Proc Natl Acad Sci U S A. 2009 Dec 8;106(49):20812–20817. PubMed PMID: 19923430; PubMed Central PMCID: PMC2779202. eng.
- Zielke N, Korzelius J, van Straaten M, et al. Fly-FUCCI: A versatile tool for studying cell proliferation in complex tissues. Cell Rep. 2014 Apr 24;7(2):588–598. PubMed PMID: 24726363.
- Zielke N, Edgar BA. FUCCI sensors: powerful new tools for analysis of cell proliferation. Wiley Interdiscip Rev Dev Biol. 2015 Sep-Oct;4(5):469–487. PubMed PMID: 25827130.
- Wilson KA, Elefanty AG, Stanley EG, et al. Spatio-temporal re-organization of replication foci accompanies replication domain consolidation during human pluripotent stem cell lineage specification. Cell Cycle. 2016 Jul 19. PubMed PMID: 27433885. DOI:10.1080/15384101.2016.1203492
- Leonhardt H, Rahn HP, Weinzierl P, et al. Dynamics of DNA replication factories in living cells. J Cell Biol. 2000 Apr 17;149(2):271–280. PubMed PMID: 10769021; PubMed Central PMCID: PMCPMC2175147.
- Ersoy I, Bunyak F, Chagin V, et al. Segmentation and classification of cell cycle phases in fluorescence imaging. Med Image Comput Comput Assist Interv. 2009;12(Pt 2):617–624. PubMed PMID: 20426163; PubMed Central PMCID: PMCPMC2792925.
- Zerjatke T, Gak IA, Kirova D, et al. Quantitative cell cycle analysis based on an endogenous all-in-one reporter for cell tracking and classification. Cell Rep. 2017 May 30;19(9):1953–1966. PubMed PMID: 28564611; PubMed Central PMCID: PMCPMC5464964.
- Ridenour DA, McKinney MC, Bailey CM, et al. CycleTrak: a novel system for the semi-automated analysis of cell cycle dynamics. Dev Biol. 2012 May 1;365(1):189–195. PubMed PMID: 22387844; PubMed Central PMCID: PMCPMC3322266.
- Overton KW, Spencer SL, Noderer WL, et al. Basal p21 controls population heterogeneity in cycling and quiescent cell cycle states. Proc Natl Acad Sci U S A. 2014 Oct 14;111(41):E4386–93. PubMed PMID: 25267623; PubMed Central PMCID: PMCPMC4205626.
- Spiller DG, Wood CD, Rand DA, et al. Measurement of single-cell dynamics. Nature. 2010 Jun 10;465(7299):736–745. PubMed PMID: 20535203.
- Chiorino G, Metz JA, Tomasoni D, et al. Desynchronization rate in cell populations: mathematical modeling and experimental data. J Theor Biol. 2001 Jan 21;208(2):185–199. PubMed PMID: 11162063.
- Snijder B, Pelkmans L. Origins of regulated cell-to-cell variability. Nat Rev Mol Cell Biol. 2011 Feb;12(2):119–125. PubMed PMID: 21224886.
- Dueck H, Eberwine J, Kim J. Variation is function: are single cell differences functionally important?: testing the hypothesis that single cell variation is required for aggregate function. Bioessays. 2016 Feb;38(2):172–180. PubMed PMID: 26625861; PubMed Central PMCID: PMCPMC4738397.
- Darzynkiewicz Z, Crissman H, Traganos F, et al. Cell heterogeneity during the cell cycle. J Cell Physiol. 1982 Dec;113(3):465–474. PubMed PMID: 6184378.
- Takeda DY, Parvin JD, Dutta A. Degradation of Cdt1 during S phase is Skp2-independent and is required for efficient progression of mammalian cells through S phase. J Biol Chem. 2005 Jun 17;280(24):23416–23423. PubMed PMID: 15855168.
- Hornbeck PV, Zhang B, Murray B, et al. PhosphoSitePlus, 2014: mutations, PTMs and recalibrations. Nucleic Acids Res. 2015 Jan;43(Database issue):D512–20. PubMed PMID: 25514926; PubMed Central PMCID: PMCPMC4383998.
- Sladitschek HL, Neveu PA. MXS-chaining: a highly efficient cloning platform for imaging and flow cytometry approaches in mammalian systems. PLoS One. 2015;10(4):e0124958. PubMed PMID: 25909630; PubMed Central PMCID: PMCPMC4409215.
- Pearlman SM, Serber Z, Ferrell JE Jr. A mechanism for the evolution of phosphorylation sites. Cell. 2011 Nov 11;147(4):934–946. PubMed PMID: 22078888; PubMed Central PMCID: PMCPMC3220604.
- Sakaue-Sawano A, Yo M, Komatsu N, et al. Genetically encoded tools for optical dissection of the mammalian cell cycle. Mol Cell. 2017 Oct 25. PubMed PMID: 29107535. DOI:10.1016/j.molcel.2017.10.001
- Coleman KE, Grant GD, Haggerty RA, et al. Sequential replication-coupled destruction at G1/S ensures genome stability. Genes Dev. 2015 Aug 15;29(16):1734–1746. PubMed PMID: 26272819; PubMed Central PMCID: PMCPMC4561482.
- Havens CG, Walter JC. Docking of a specialized PIP Box onto chromatin-bound PCNA creates a degron for the ubiquitin ligase CRL4Cdt2. Mol Cell. 2009 Jul 10;35(1):93–104. PubMed PMID: 19595719; PubMed Central PMCID: PMCPMC2744448.
- Havens CG, Walter JC. Mechanism of CRL4(Cdt2), a PCNA-dependent E3 ubiquitin ligase [Research Support, N.I.H., Extramural Review]. Genes Dev. 2011 Aug 1;25(15):1568–1582. PubMed PMID: 21828267; PubMed Central PMCID: PMC3182024. eng.
- Kim JH, Lee SR, Li LH, et al. High cleavage efficiency of a 2A peptide derived from porcine teschovirus-1 in human cell lines, zebrafish and mice [Research Support, Non-U.S. Gov’t]. PLoS One. 2011;6(4):e18556. PubMed PMID: 21602908; PubMed Central PMCID: PMC3084703. eng.
- Nishitani H, Shiomi Y, Iida H, et al. CDK inhibitor p21 is degraded by a proliferating cell nuclear antigen-coupled Cul4-DDB1Cdt2 pathway during S phase and after UV irradiation [Research Support, Non-U.S. Gov’t]. J Biol Chem. 2008 Oct 24;283(43):29045–29052. PubMed PMID: 18703516; PubMed Central PMCID: PMC2662008. eng.
- Stuart SA, Wang JY. Ionizing radiation induces ATM-independent degradation of p21Cip1 in transformed cells [Research Support, N.I.H., Extramural]. J Biol Chem. 2009 May 29;284(22):15061–15070. PubMed PMID: 19332548; PubMed Central PMCID: PMC2685688. eng.
- Zhang S, Zhao H, Darzynkiewicz Z, et al. A novel function of CRL4(Cdt2): regulation of the subunit structure of DNA polymerase delta in response to DNA damage and during the S phase [Research Support, N.I.H., Extramural]. J Biol Chem. 2013 Oct 11;288(41):29550–29561. PubMed PMID: 23913683; PubMed Central PMCID: PMC3795253. eng.
- Stivala LA, Prosperi E, Rossi R, et al. Involvement of proliferating cell nuclear antigen in DNA repair after damage induced by genotoxic agents in human fibroblasts. Carcinogenesis. 1993 Dec;14(12):2569–2573. PubMed PMID: 7505725.
- Shivji KK, Kenny MK, Wood RD. Proliferating cell nuclear antigen is required for DNA excision repair. Cell. 1992 Apr 17;69(2):367–374. PubMed PMID: 1348971.
- Hu J, Xiong Y. An evolutionarily conserved function of proliferating cell nuclear antigen for Cdt1 degradation by the Cul4-Ddb1 ubiquitin ligase in response to DNA damage. J Biol Chem. 2006 Feb 17;281(7):3753–3756. PubMed PMID: 16407242.
- Abbas T, Sivaprasad U, Terai K, et al. PCNA-dependent regulation of p21 ubiquitylation and degradation via the CRL4Cdt2 ubiquitin ligase complex [Research Support, N.I.H., Extramural Research Support, Non-U.S. Gov’t]. Genes Dev. 2008 Sep 15;22(18):2496–2506. PubMed PMID: 18794347; PubMed Central PMCID: PMC2546691. eng.
- Aleksandrov R, Dotchev A, Poser I, et al. Protein Dynamics in Complex DNA Lesions. Mol Cell. 2018 Mar 15;69(6):1046–1061 e5. PubMed PMID: 29547717.
- Li R, Waga S, Hannon GJ, et al. Differential effects by the p21 CDK inhibitor on PCNA-dependent DNA replication and repair. Nature. 1994 Oct 6;371(6497):534–537. PubMed PMID: 7935768.
- Arias EE, Walter JC. PCNA functions as a molecular platform to trigger Cdt1 destruction and prevent re-replication [Research Support, Non-U.S. Gov’t]. Nat Cell Biol. 2006 Jan;8(1):84–90. PubMed PMID: 16362051; eng.
- Rizzardi LF, Coleman KE, Varma D, et al. CDK1-dependent inhibition of the E3 ubiquitin ligase CRL4CDT2 ensures robust transition from S Phase to Mitosis. J Biol Chem. 2015 Jan 2;290(1):556–567. PubMed PMID: 25411249; PubMed Central PMCID: PMCPMC4281756.
- Nukina K, Hayashi A, Shiomi Y, et al. Mutations at multiple CDK phosphorylation consensus sites on Cdt2 increase the affinity of CRL4(Cdt2) for PCNA and its ubiquitination activity in S phase. Genes Cells. 2018 Feb 9. PubMed PMID: 29424068. DOI:10.1111/gtc.12563
- Chao HX, Poovey CE, Privette AA, et al. Orchestration of DNA Damage Checkpoint Dynamics across the Human Cell Cycle. Cell Syst. 2017 Nov 22;5(5):445–459 e5. PubMed PMID: 29102360; PubMed Central PMCID: PMCPMC5700845.
- Johmura Y, Shimada M, Misaki T, et al. Necessary and sufficient role for a mitosis skip in senescence induction. Mol Cell. 2014 Jul 3;55(1):73–84. PubMed PMID: 24910096; eng.
- Krenning L, Feringa FM, Shaltiel IA, et al. Transient activation of p53 in G2 phase is sufficient to induce senescence. Mol Cell. 2014 Jul 3;55(1):59–72. PubMed PMID: 24910099.
- Suzuki M, Yamauchi M, Oka Y, et al. Live-cell imaging visualizes frequent mitotic skipping during senescence-like growth arrest in mammary carcinoma cells exposed to ionizing radiation. Int J Radiat Oncol Biol Phys. 2012 Jun 1;83(2):e241–50. PubMed PMID: 22365624.
- Sugimoto N, Tatsumi Y, Tsurumi T, et al. Cdt1 phosphorylation by cyclin A-dependent kinases negatively regulates its function without affecting geminin binding. J Biol Chem. 2004 May 7;279(19):19691–19697. PubMed PMID: 14993212.
- Vaziri C, Saxena S, Jeon Y, et al. A p53-dependent checkpoint pathway prevents rereplication [Research Support, Non-U.S. Gov’t Research Support, U.S. Gov’t, P.H.S.]. Mol Cell. 2003 Apr;11(4):997–1008. PubMed PMID: 12718885; eng.
- Melixetian M, Ballabeni A, Masiero L, et al. Loss of Geminin induces rereplication in the presence of functional p53. J Cell Biol. 2004 May 24;165(4):473–482. PubMed PMID: 15159417; PubMed Central PMCID: PMCPMC2172361.
- Davidson IF, Li A, Blow JJ. Deregulated replication licensing causes DNA fragmentation consistent with head-to-tail fork collision. Mol Cell. 2006 Nov 3;24(3):433–443. PubMed PMID: 17081992; PubMed Central PMCID: PMCPMC1819398.
- Hall JR, Lee HO, Bunker BD, et al. Cdt1 and Cdc6 are destabilized by rereplication-induced DNA damage [Research Support, N.I.H., Extramural Research Support, Non-U.S. Gov’t]. J Biol Chem. 2008 Sep 12;283(37):25356–25363. PubMed PMID: 18617514; PubMed Central PMCID: PMC2533066. eng.
- Klotz-Noack K, McIntosh D, Schurch N, et al. Re-replication induced by geminin depletion occurs from G2 and is enhanced by checkpoint activation. J Cell Sci. 2012 May 15;125(Pt 10):2436–2445. PubMed PMID: 22366459; PubMed Central PMCID: PMCPMC3481538.
- Cappell SD, Chung M, Jaimovich A, et al. Irreversible APC(Cdh1) inactivation underlies the point of no return for cell-cycle entry. Cell. 2016 Jun 30;166(1):167–180. PubMed PMID: 27368103.
- Bashir T, Dorrello NV, Amador V, et al. Control of the SCF(Skp2-Cks1) ubiquitin ligase by the APC/C(Cdh1) ubiquitin ligase. Nature. 2004 Mar 11;428(6979):190–193. PubMed PMID: 15014502.
- Wei W, Ayad NG, Wan Y, et al. Degradation of the SCF component Skp2 in cell-cycle phase G1 by the anaphase-promoting complex. Nature. 2004 Mar 11;428(6979):194–198. PubMed PMID: 15014503.
- Yin K, Ueda M, Takagi H, et al. A dual-color marker system for in vivo visualization of cell cycle progression in Arabidopsis. Plant J. 2014 Nov;80(3):541–552. PubMed PMID: 25158977.
- Burgess A, Lorca T, Castro A. Quantitative live imaging of endogenous DNA replication in mammalian cells. PLoS One. 2012;7(9):e45726. PubMed PMID: 23029203; PubMed Central PMCID: PMCPMC3447815.
- Bajar BT, Lam AJ, Badiee RK, et al. Fluorescent indicators for simultaneous reporting of all four cell cycle phases. Nat Methods. 2016 Dec;13(12):993–996. PubMed PMID: 27798610; PubMed Central PMCID: PMCPMC5548384.
- Ge XQ, Blow JJ. Chk1 inhibits replication factory activation but allows dormant origin firing in existing factories. J Cell Biol. 2010 Dec 27;191(7):1285–1297. PubMed PMID: 21173116; PubMed Central PMCID: PMCPMC3010067.
- Kennedy BK, Barbie DA, Classon M, et al. Nuclear organization of DNA replication in primary mammalian cells. Genes Dev. 2000 Nov 15;14(22):2855–2868. PubMed PMID: 11090133; PubMed Central PMCID: PMCPMC317063.
- Chandrasekaran S, Tan TX, Hall JR, et al. Stress-stimulated mitogen-activated protein kinases control the stability and activity of the Cdt1 DNA replication licensing factor [Research Support, N.I.H., Extramural]. Mol Cell Biol. 2011 Nov;31(22):4405–4416. PubMed PMID: 21930785; PubMed Central PMCID: PMC3209262. eng.
- Clijsters L, Ogink J, Wolthuis R. The spindle checkpoint, APC/C(Cdc20), and APC/C(Cdh1) play distinct roles in connecting mitosis to S phase. J Cell Biol. 2013 Jun 24;201(7):1013–1026. PubMed PMID: 23775192; PubMed Central PMCID: PMCPMC3691463.
- Ballabeni A, Melixetian M, Zamponi R, et al. Human geminin promotes pre-RC formation and DNA replication by stabilizing CDT1 in mitosis. Embo J. 2004 Aug 4;23(15):3122–3132. PubMed PMID: 15257290; PubMed Central PMCID: PMCPMC514931.
- Ballabeni A, Zamponi R, Moore JK, et al. Geminin deploys multiple mechanisms to regulate Cdt1 before cell division thus ensuring the proper execution of DNA replication. Proc Natl Acad Sci U S A. 2013 Jul 23;110(30):E2848–53. PubMed PMID: 23836640; PubMed Central PMCID: PMCPMC3725105.
- Coulombe P, Gregoire D, Tsanov N, et al. A spontaneous Cdt1 mutation in 129 mouse strains reveals a regulatory domain restraining replication licensing. Nat Commun. 2013;4:2065. PubMed PMID: 23817338.
- Hahn AT, Jones JT, Meyer T. Quantitative analysis of cell cycle phase durations and PC12 differentiation using fluorescent biosensors. Cell Cycle. 2009 Apr 1;8(7):1044–1052. PubMed PMID: 19270522; PubMed Central PMCID: PMCPMC2668240.
- Yao G, Lee TJ, Mori S, et al. A bistable Rb-E2F switch underlies the restriction point. Nat Cell Biol. 2008 Apr;10(4):476–482. PubMed PMID: 18364697.
- Regot S, Hughey JJ, Bajar BT, et al. High-sensitivity measurements of multiple kinase activities in live single cells. Cell. 2014 Jun 19;157(7):1724–1734. PubMed PMID: 24949979; PubMed Central PMCID: PMCPMC4097317.
- Maryu G, Matsuda M, Aoki K. Multiplexed fluorescence imaging of ERK and Akt activities and cell-cycle progression. Cell Struct Funct. 2016 Jul 22;41(2):81–92. PubMed PMID: 27247077.
- Schindelin J, Arganda-Carreras I, Frise E, et al. Fiji: an open-source platform for biological-image analysis. Nat Methods. 2012 Jul;9(7):676–682. PubMed PMID: 22743772; PubMed Central PMCID: PMC3855844.