
ABSTRACT
DNA replication during S phase involves thousands of replication forks that must be coordinated to ensure that every DNA section is replicated only once. The minichromosome maintenance proteins, MCM2 to MCM7, form a heteromeric DNA helicase required for both the initiation and elongation of DNA replication. Although only two DNA helicase activities are necessary to establish a bidirectional replication fork from each replication origin, a large excess of MCM complexes is amassed and distributed along the chromatin. The function of the additional MCM complexes is not well understood, as most are displaced from the DNA during the S-phase, apparently without playing an active role in DNA replication. DNA damage response (DDR) kinases activated by stalled forks prevent the replication machinery from being activated, indicating a tight relationship between DDR and DNA replication. To investigate the role of MCM proteins in the cellular response to DNA damage, we used shRNA targeting MCM2 or MCM3 to determine the impact of a reduction in MCM complex. The alteration of MCM proteins induced a change in the activation of key factors of the DDR in response to Etoposide treatment. Etoposide-induced DNA damage affected the phosphorylation of γ-H2AX, CHK1 and CHK2 without affecting cell viability. Using assays measuring homologous recombination (HR) and non-homologous end-joining (NHEJ), we identified a decrease in both HR and NHEJ associated with a decrease in MCM complex.
Introduction
DNA replication during S phase involves thousands of replication forks that must be coordinated to ensure that every DNA section is replicated only once [Citation1]. Cells prevent duplicate DNA replication through a distinct stage that occurs during the G1-phase, when replication origins are “licensed”, by the pre-loading of several proteins involved in DNA replication [Citation2]. The first step of this replication licensing is the loading of MCM (mini-chromosome maintenance) proteins onto DNA, by the origin recognition complex protein (ORC), cell division cycle 6 (CDC6) and Cdc10 dependent transcript 1 (CDT1) proteins [Citation3]. All eukaryotic organisms possess six homologous proteins, MCM2 to MCM7, which belong to the AAA+ family (ATPase associated with various cellular activities) of proteins and share similarities with other helicases [Citation4]. MCM2-7, which forms a heterohexameric ring, is required for both the initiation and elongation of DNA replication [Citation5]. As a critical mechanism aimed at ensuring only a single round of DNA replication, the loading of additional MCM complexes onto replication origins is inhibited by redundant mechanisms after passage into the S-phase [Citation6]. Defects in the regulation of DNA replication result in replicative stress, which can subsequently cause DNA damage. DNA damage response (DDR) kinases activated by stalled forks prevent the replication machinery from being activated, indicating a tight relationship between DDR and DNA replication [Citation7,Citation8].
The MCM complex plays a crucial role in determining cellular replication potential, but also in the cellular response to DNA damage. Indeed, MCM proteins not only interact with S-phase checkpoint regulators, but also with components of DNA repair pathways [Citation9,Citation10]. In yeast, temperature-sensitive MCM mutated cells at restrictive temperature display numerous foci recognized by phosphorylated histone H2AX antibodies [Citation9], suggesting a role in the repair of DNA double-strand breaks. Although only two DNA helicase activities are required to establish a bidirectional replication fork from each origin, a large excess of MCM complexes is loaded at replication origins and is distributed along the chromatin. The function of the additional MCM complexes is not well understood, as most are displaced from the DNA during the S-phase, apparently without playing an active role in DNA replication. This “MCM paradox” was suggested following the observation that in yeast, Xenopus, Drosophila and human cells, a greater than 90% reduction in MCM protein concentrations does not impair DNA replication [Citation11–Citation15], suggesting a role for MCM proteins beyond DNA replication. It has been suggested that excess MCM proteins may provide “dormant” origins that can be activated in response to replicative stress [Citation16].
In response to DNA damage during S phase, cells rapidly block replication initiation in addition to the slowing of the progressing replication forks [Citation17,Citation18]. This checkpoint control is critical to avoid genomic instability, and mutations in checkpoint genes are often associated with cancer [Citation19,Citation20]. The Chk1 kinase and its main upstream activator kinase, ATR, are essential checkpoint effectors in response to a wide variety of genotoxic stresses, and inhibit origin firing by targeting the replication kinases, cyclin-dependent kinase (CDK) and Dbf4-dependent kinase (DDK) [Citation21], while Chk2 and its main upstream activator ATM are primarily associated with the cellular response to double-strand DNA breaks [Citation22]. Whereas Chk1 and Chk2 have initially been reported to be involved in distinct signaling pathways, there is mounting evidence for an extensive crosstalk between ATM-Chk2 and ATR-Chk1 controlled checkpoint responses [Citation23]. Cell-cycle kinases DDK and CDK are required upstream for the activation of the MCM complex and several studies have described the checkpoint-dependent phosphorylation of MCM proteins [Citation24–Citation27], although the effects or requirements for these modifications for activity or stability of the helicase still remain unclear. More importantly, the role and the importance of the MCM complex in different DNA repair pathways have yet to be established.
In order to investigate the role of MCM proteins in the cellular response to DNA damage, we used shRNA targeting MCM2 or MCM3 to determine the impact of the reduction in MCM complex on the DDR. The alteration of MCM proteins induced a change in the activation of important factors of the DDR in response to Etoposide treatment, including affecting the phosphorylation of γ-H2AX, CHK1 and CHK2 following Etoposide-induced DNA damage without inducing changes in cell viability, but resulting in a small decrease in DNA replication. Using assays measuring homologous recombination (HR) and non-homologous end-joining (NHEJ), we identified a decrease in HR and NHEJ associated with a decrease in MCM complex.
Results
Decreasing MCM2 or MCM3 proteins does not affect cell growth
Our previous results showed an involvement of MCM proteins in the DNA damage response through its co-localization with γ-H2AX foci, and through interaction with chromatin remodeling proteins in response to DNA damage induced by the topoisomerase II inhibitor Etoposide [Citation28]. To investigate the role of the MCM proteins in regulating cell growth as well as investigate the signaling of DNA damage, we used shRNAs delivered through lentiviruses targeting MCM2 (shMCM2) or MCM3 (shMCM3) in the U2OS cell line, as well as a non-silencing control (shControl). U2OS cells were infected with the corresponding virus, and cells stably expressing the shRNA were then selected using puromycin. Western blots confirmed that MCM2 and MCM3 were downregulated when expressing the shRNA targeting each protein specifically (). Growth tests were performed on U2OS expressing shControl, shMCM2 or shMCM3 over 72 hours. No significant differences were observed in cell growth in cells downregulated for MCM2 or MCM3 compared to the control ()). Moreover, downregulation of MCM2 or MCM3 did not affect the distribution of cells within the cell cycle as observed by measuring DNA content with propidium iodine staining followed by FACS analysis ()).
Figure 1. Lentivirus-infected cell lines expressing control, MCM2 or MCM3 shRNA. U2OS cells were infected with either a control shRNA, or shRNAs targeting and decreasing MCM2 (a) or MCM3 (b) expression. Cell extracts were resolved by SDS-PAGE and proteins revealed by immunoblotting using MCM2, MCM3 or GAPDH antibodies. The fold reduction compared to the control and normalized with GAPDH is shown on the right. (c) Growth curves of U2OS shControl, shMCM2 and shMCM3 cell lines over 72 h. A total of 100,000 cells were seeded at time 0, and counted every 24 hours (n = 3). (d) FACS analysis of cells expressing shControl, shMCM2 or shMCM3 using propidium iodine staining. (e) Cell extracts from U2OS cells expressing either a control shRNA, or shRNAs targeting MCM2 or MCM3 were resolved by SDS-PAGE and proteins revealed by immunoblotting using MCM2, MCM3, MCM5, MCM7 or GAPDH antibodies. The ratio compared to the control and normalized with GAPDH is shown on the right.
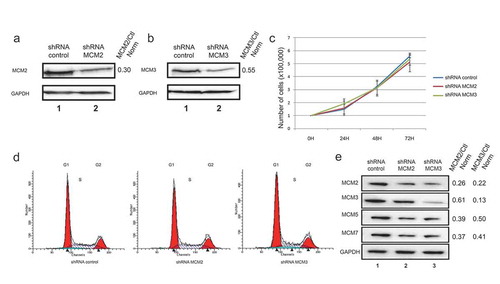
shRNAs targeting MCM2 or MCM3 destabilize the MCM complex
In 2008, Ibarra et al. showed a decrease of all MCM protein expression levels after knockdowns of MCM proteins using siRNA [Citation15]. Herein, the effect of shMCM2 or shMCM3 on the expression of other MCM proteins was verified. The knockdown of MCM2 or MCM3 proteins in U2OS cell lines reduced not only the protein directly targeted by the shRNA, but also MCM3 (or MCM2), MCM5 and MCM7 ()). This result suggests that reducing one of the MCM proteins destabilizes the MCM complex, resulting in other proteins from the MCM complex to be degraded.
One of the initial responses following a DNA double-strand break is the phosphorylation of H2AX on serine 139. Phosphorylation of H2AX results in the activation of HR and NHEJ signaling pathways and the recruitment of their respective DNA repair proteins. In this context, we examined the effects of the MCM complex destabilization on H2AX phosphorylation in response to DNA damage induced by Etoposide. U2OS shControl, shMCM2 and shMCM3 cell lines were treated for 1 hour with 1 or 10 μM Etoposide. A strong increase in H2AX phosphorylation was observed with 10 μM Etoposide in U2OS shControl cells, while a weaker induction of H2AX phosphorylation was observed in cells expressing MCM2 or MCM3 shRNAs (). Thus, the knock-down of the MCM complex results in a reduction in the phosphorylation of H2AX following Etoposide-induced DNA damage.
Figure 2. Phosphorylation of H2AX on serine 139 following Etoposide-induced DNA damage in U2OS cell lines knocked-down for MCM2 or MCM3. U2OS cell lines expressing either a control shRNA, or shRNAs targeting MCM2 or MCM3 were treated or not for 1 hour with 1 or 10 µM Etoposide. Cell extracts were resolved by SDS-PAGE and proteins were revealed by immunoblotting using MCM2, MCM3, γ-H2AX and GAPDH antibodies. The ratio compared to the control and normalized with GAPDH is shown under each band, where applicable.
Knock-down of MCM complex alters the DNA damage response
Downstream signaling events in response to DNA double-stranded breaks includes phosphorylation of CHK2 on Thr68 by ATM [Citation29], and phosphorylation of CHK1 on serine 345 by ATR [Citation30]. We analyzed the activation of these pathways by measuring the levels of phosphorylation using CHK1 and CHK2 phospho-specific antibodies in U2OS shRNA treated or not with 1 or 10 μM Etoposide. In U2OS shControl, CHK2 was strongly phosphorylated on Thr68 following treatment with 10 μM Etoposide for 1 hour (), lanes 1–3). Phosphorylation of CHK2 was conversely decreased in cells expressing shMCM2 or MCM3 (), lanes 4–9), consistent with a reduced phosphorylation of H2AX ()). However, after longer treatments with Etoposide, the phosphorylation on Thr68 of CHK2 was not affected by the reduced MCM complex ()), whereas H2AX remained less phosphorylated in U2OS shMCM2 and U2OS shMCM3 cells ()), as well as in HCT116 cells (Supplementary Figure 1). This reduction was also observed by immunofluorescence microscopy in both the number of γ-H2AX foci, as well as the intensities (Supplementary Figure 3). In addition, 1 μM Etoposide treatment for 19 hours strongly increased Thr68-CHK2 phosphorylation to a level close to that with 10μM treatment () and Supplementary Figure 1(b)) which was not observed for γ-H2AX.
Figure 3. Phosphorylation of H2AX on serine 139 following Etoposide-induced DNA damage in U2OS cell lines knocked-down for MCM2 or MCM3. U2OS cells knocked-down with either a control shRNA, or shRNAs targeting MCM2 or MCM3 were treated or not for 1 hour (a) or 19 hours (b) with 1 or 10 µM Etoposide. Equal amounts of total cell lysates were separated by SDS-PAGE, and the proteins revealed by immunoblotting using the indicated antibodies. The ratio compared to the control and normalized with GAPDH is shown under each band, where applicable.
CHK1 is also involved in cellular DNA damage response, mainly induced by genotoxic stress and single-strand break, although CHK1 can also be phosphorylated later during the double-strand break repair mechanism. The presence of DNA single-strand during this mechanism promotes CHK1 phosphorylation on its Serine 345. As in the case of CHK2, phosphorylation of CHK1 in U2OS shRNA cell lines was observed after treatment with 1 µM or 10 µM Etoposide for 1 h or 19 h. CHK1 was phosphorylated following treatment with 10 μM Etoposide for 1 hour in U2OS shMCM2 or shMCM3 cells compared to U2OS shControl ()), although to a lesser extent. An increase in S345-phosphorylation was observed by increasing the duration of 1 µM Etoposide treatment to a level close to that of 10 μM Etoposide treatment in the three cell lines while also decreasing with shMCM2 or shMCM3 compared to shControl.
Knock-down of MCM proteins does not affect cell sensitivity to Etoposide
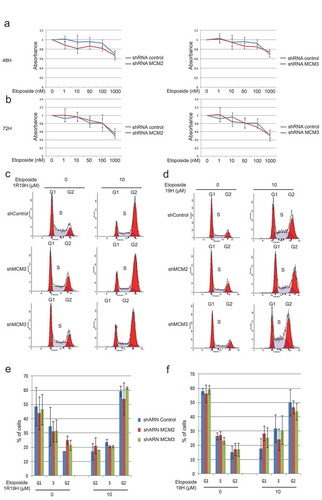
Since U2OS shMCM2 and shMCM3 cells did not show alteration of their cell cycle compared to control cells ()), we investigated whether knock-down of MCM proteins could result in increased sensitivity to Etoposide. Control cells or cells expressing shRNA for MCM2 and MCM3 were treated with increasing concentrations of Etoposide and cell viability was assessed using MTT assays () while distribution within the cell cycle was analyzed by FACS analysis (). Treatment with Etoposide resulted in a decrease in cell viability as determined by MTT assays, whereas no significant differences were observed between cells expressing shMCM2 or shMCM3 when compared to the cells expressing the shControl at 48 h in U2OS cells ()) and 72 h ()), as well as HCT116 cells (Supplementary Figure 2). Treatment with 10 μM Etoposide for 1 hour, followed by a 19-hour recovery period (), as well as treatment for 19 hours () resulted in accumulation of cells in G2, with no significant differences between the cells expressing the shControl when compared with cells knocked-down for MCM2 or MCM3.
Figure 4. Knock-down of MCM proteins does not affect cell sensitivity to Etoposide. Control cells or cells expressing shRNA for MCM2 and MCM3 were treated with increasing concentrations of Etoposide for 48 hours (a) or 72 hours (b), and cell viability was assessed using MTT assays to determine viability and the distribution within the cell cycle was analyzed by FACS analysis (c,d). The cell cycle distribution of three independent FACS analyses showed no significant differences between the cells expressing the shControl when compared with cells knocked-down for MCM2 or MCM3. (e,f) The cell cycle distributions from the three independent FACS analysis were averaged and are displayed as histograms with the percentage of cells in each phases of the cell cycle displayed.
Knock-down of MCM proteins results in a reduction in S-phase entry
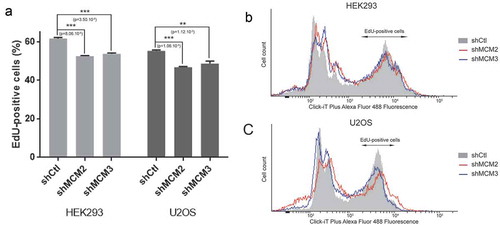
To further determine whether knockdown of MCM proteins affect replication timing and progression through S-phase, we used EdU pulse-labeling to quantify the cells going through S-phase. U2OS or 293 control cells or cells expressing shRNA for MCM2 and MCM3 were pulse-labeled with 10 μM EdU for two hours prior to fixation and FACS analysis (). EdU-positive cells represents cells that are in S-phase or entering S-phase during the incubation with EdU. Quantification of three repeats shows a small but significant reduction in the number of EdU-positive cells when MCM2 or MCM3 are knocked-down (n = 3).
Figure 5. Quantification of S-phase by EdU labeling. 293 and U2OS cells expressing shRNA for MCM2 and MCM3 were incubated with EdU for 2 h, followed by detection of EdU-DNA by Click-iT chemistry (Alex Fluor 488). Fluorescence was measured by FACS analysis by counting 100,000 cells. The experiment was repeated 3 times (n = 3) for each condition.
Destabilization of the MCM complex leads to an alteration in Homologous Recombination and Non-Homologous End Joining
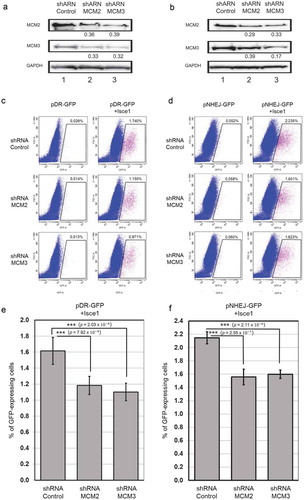
Cells were transfected with pHR-GFP and pNHEJ-GFP plasmids to generate stable cell lines, followed by clonal selection. The clones were selected based on the increase in GFP-positive cells of at least 5-fold as determined by FACS analysis compared to the basal level of GFP-positive cells. Selected clones were then infected with shControl, shMCM2 or shMCM3 lentiviruses, and cells stably expressing shRNAs were selected using puromycin. As in the U2OS cell lines, shRNA targeting MCM2 or MCM3 destabilized the MCM complex in the HEK-293 cells (). The ISce1 plasmid was then transfected for 96 hours to induce specific DSB in the HEK-293 stable cell lines. Expression of ISce1 increased the number of cells expressing GFP in shControl 293-C1 cells (0.026% to 1.74%) ()) after ISce1 transfection ()). The number of GFP-expressing cells increased to only 1.150% or to 0.971% with shMCM2 or shMCM3 respectively ()). Expression of ISce1 increased GFP-expressing cells in shRNA-infected 293-NHEJ cells from 0.052% to 2.235%, 0.058% to 1.501% and 0.060% to 1.623% of total cells with shControl, shMCM2 and shMCM3, respectively ()). Six replicates of each experiment were performed, and significant differences were observed on homologous recombination and non-homologous end joining following a reduction in MCM2 or MCM3 (). These results suggest an involvement of the MCM complex in DNA double-strand breaks repair.
Figure 6. Destabilization of the MCM complex leads to an alteration in Homologous Recombination but not in Non-Homologous End Joining. HEK-293 cells with stable incorporation of pHR-GFP and pNHEJ-GFP plasmids were infected with shControl, shMCM2 or shMCM3 lentiviruses, and cells stably expressing shRNAs were selected using puromycin. ShRNA targeting MCM2 or MCM3 destabilized the MCM complex in HEK-293 cells, as demonstrated by immunoblotting of whole cell lysates (a,b). The ratio compared to the control and normalized with GAPDH is shown under each band. An ISce1-expressing plasmid was transfected and cells were incubated for 96 hours to induce specific DSB in the HEK-293 stable cell lines. GFP-positive cells were counted using FACS analysis for homologous recombination (c) or non-homologous end-joining (d). Three replicates of each experiment were performed (e,f).
Phosphoproteome analysis of cells knocked-down for the MCM complex in response to DNA damage
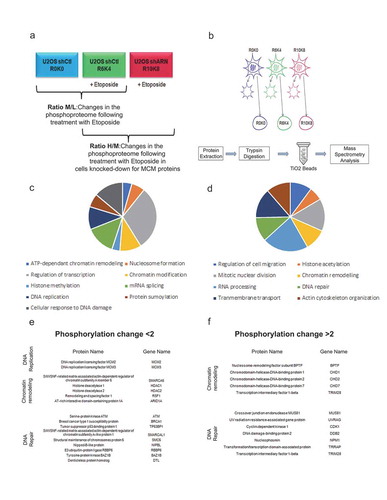
Our previous results showed that a decrease in the MCM complex appeared to result in a decrease in the level of phosphorylation of several proteins involved in the cellular response to DNA damage. We next sought to determine if this decrease could have an impact on the level of phosphorylation of other cellular proteins. A triple SILAC approach of quantitative mass spectrometry was therefore used to identify and quantify the phosphorylated proteins in response to Etoposide following a decrease in the MCM complex. The U2OS shControl cell line was cultured in light (L) SILAC medium (R0K0) or in medium (M) SILAC medium (R6K4) and treated for 1 hour with 10 μM Etoposide. This M/L ratio allows quantifying the phosphorylation changes in response to Etoposide. In the heavy (H) SILAC medium (R10K8), U2OS cells infected with shRNA against MCM2 or MCM3 were cultured and then treated for 1 hour with 10 μM Etoposide. The H/M ratio thus allows quantifying differences in phosphorylation resulting from the decrease in MCM proteins in response to Etoposide () and Supplementary Table 1). Subsequently, fractionation was performed to enrich the nuclear proteins ()). Nuclear proteins from each condition were mixed, digested with trypsin and the phosphopeptides enriched using titanium oxide (TiO2) beads and analyzed by mass spectrometry ()). Of the 14,233 phosphorylated peptides identified, 486 peptides showed a two-fold or greater decrease in the U2OS shMCM2 or shMCM3 lines in response to Etoposide (Supplementary Table 1). In contrast, 367 peptides showed a two-fold or greater increase in phosphorylation. Among the proteins with decreased phosphorylation, gene ontology annotation identified eight enriched signaling pathways including DNA replication, chromatin remodeling or DNA repair (p-values < 0. 01) ()). Amongst the proteins with decreased phosphorylation, a decrease in MCM2 and MCM3 proteins was documented as expected considering that they are direct targets of the shRNAs, but also proteins known to be involved in the remodeling of chromatin. Interestingly, this approach allowed identifying a decrease in phosphorylation of proteins involved in DNA repair mechanisms, in particular those involved in HR, namely ATM, BRCA1 and 53BP1 proteins ()). For proteins with increased phosphorylation, eleven signaling pathways were enriched (p-values < 0.01), again including proteins involved in chromatin remodeling and DNA repair, albeit involved in different processes ()). In particular, an increase was noted in the phosphorylation of several chromodomain helicases (CHD1, CHD2 and CHD7 proteins) involved in chromatin remodeling, or other DNA damage repair proteins including MUS81, UVRAG or DDB2 ()). Thus, it would appear that a decrease in the MCM complex leads to a modulation in phosphorylation of proteins involved in chromatin remodeling and DNA double-strand break repair.
Figure 7. Effects of a decrease in the MCM complex on the phosphoproteome in response to double-strand breaks. U2OS cells infected with shRNAs against MCM2 or MCM3 were cultured in different SILAC media and treated with Etoposide, fractionated and then digested to purify the phosphopeptides. (a) The U2OS shControl cell line was cultured in light SILAC medium (R0K0) and untreated, or cultured in SILAC medium (R6K4) and treated for 1 hour with 10 μM Etoposide. U2OS cells infected with shRNAs against MCM2 or MCM3 were cultured in heavy SILAC medium (R10K8) and subsequently treated for 1 hour with 10 μM Etoposide. (b) The cells were fractionated to isolate the nuclear proteins, after which the proteins were extracted, digested with trypsin and purified on titanium dioxide beads before identification and quantification by mass spectrometry. (c,d) Proteins with a >2-fold increase (c) or >2-fold decrease (d) in phosphorylation were analyzed for gene ontology pathway enrichment using David 2.0. The pathways including at least four proteins and those with a p-value <0.01 for an increase or decrease in phosphorylation are presented. (e,f). Lists of proteins identified and known to play a role in chromatin remodeling, DNA repair or DNA replication mechanisms in response to DNA damage.
Discussion
In the present study, we observed that a reduction in one subunit of the MCM complex using shRNAs results in the destabilization of the entire complex, as reported using siRNA [Citation15]. This is consistent with turnover studies demonstrating that multiprotein complexes are only stable once assembled, and that free proteins or partially assembled complexes show a rapid turnover [Citation31]. Thus, a reduction in one of the MCM proteins results in the destabilization of the whole complex, with the other subunits being reduced as well. We furthermore found that reduction of MCM proteins still allowed DNA replication and cell growth in the absence of any cellular stresses, indicating that as long as a number of MCM proteins are available to occupy the replication origins, cell survival is not affected. This is in agreement with the conclusion that human cells may exhibit an at-least 10-fold excess of chromatin-bound MCM complexes, and proliferate normally as long as the replication of the normal origins is conserved [Citation15,Citation32]. In addition, the MCM complex can be subdivided into two sub-complexes: MCM 2/4/6/7 and MCM 3/5 complexes [Citation33,Citation34], with only the MCM2 and MCM3 proteins having an NLS sequence [Citation35,Citation36], thus allowing translocation of the two sub-complexes to the nucleus. The absence of these two proteins could explain the decrease in the other proteins of the complex following an improper nuclear import leading to their premature degradation.
Given that cells were able to proliferate normally following a reduction in MCM complexes, the consequence of this reduction following DNA damage was investigated to assess whether cells had become increasingly sensitive. We had previously shown that treatment with Etoposide, a Topoisomerase II inhibitor, resulted in the recruitment of MCM complexes to the sites of DNA damage, as well as interaction with chromatin remodeling complexes [Citation28]. Interestingly, a reduction in MCM complexes resulted herein in a decrease in phosphorylation of H2AX on serine 139, suggesting that signalization of DNA breaks was impaired. Downstream events such as phosphorylation of CHK1 and CHK2 were also found to be affected. The decrease in phosphorylation of CHK1 was more prominent after longer treatments with Etoposide, consistent with the interaction between CHK1 and MCM proteins, which regulates CHK1 phosphorylation through recruitment of CHK1 to chromatin [Citation37]. The HR and NHEJ repair assays allowed controlled, site-specific cleavage of DNA to assess the effectiveness of different repair mechanisms in living cells. We observed that both homologous recombination and non-homologous end-joining was significantly affected following knockdown of MCM proteins. The DNA damage induced by Etoposide did not change the checkpoint leading to overall cell cycle arrest as observed by FACS, but we observed a small, but significant reduction in DNA replication using an EdU incorporation assay. Considering that DSBs generated by Topoisomerase inhibitors are resulting from collision with the transcription and replication machinery [Citation38], it is possible that a reduction of MCM proteins resulted in less DSBs being generated, which would also result in a reduction in signaling events leading involved in DNA double-stranded breaks repair pathways. However, knock-down of the MCM proteins in the HR and NHEJ assays are measuring repair mechanisms following DSBs generated by cleavage of I-Sce1, which do not involve TopoII inhibition (). While the precise defect has not been identified, these observations are reminiscent of studies linking the MCM complex with components of both HR such as RAD51, RAD52 [Citation39,Citation40] and ATM, as well as components of NHEJ such as ATR [Citation41], and thus confirm a role for the above excess in MCM complexes in these DNA repair pathways. Interestingly, knockdown of MCM2 or MCM3 resulted in a decrease of HR and NHEJ in these cells, but did not increase cell sensitivity to Etoposide following treatments of cells for 1 h and 19 h. In contrast, the HR and NHEJ assays are performed 96 hours following expression of ISce1, suggesting that the amount of DNA damage may accumulate over several cell cycles. This became apparent after longer incubations with etoposide in HCT116 cells ().
Subsequent to the phosphorylation modifications obtained following a decrease in MCM proteins in response to Etoposide and the lack of changes in cell sensitivity, we quantified changes in the nuclear phosphoproteome by mass spectrometry. Specific enrichment of protein functions whose phosphorylation was observed fell mostly into two categories: proteins involved in DNA repair and those involved in chromatin remodeling. The decrease in MCM proteins appears to cause a decrease in phosphorylation of proteins involved in chromatin remodeling such as the SMARCA5 protein. This ATPase of the ISWI family, and part of the SNF2H/SMARCA5 complex, is involved in chromatin remodeling and is recruited at the sites of damage to facilitate DNA repair by HR [Citation42]. We have also identified a decrease in phosphorylation of the RSF1 protein, known to be involved in HR [Citation43] and also interacting with SNF2H [Citation42]. Consistent with our observations herein on the reduction in phosphorylation of CHK2 and H2AX, we were able to identify a reduction in the phosphorylation of ATM, BRCA1 and 53BP1 proteins in response to Etoposide upon downregulation of the MCM proteins. Thus, proteins with decreased phosphorylation are proteins primarily involved in chromatin remodeling and in the mechanism of HR. In parallel, an increase in phosphorylation in response to Etoposide was equally observed on other proteins involved in chromatin remodeling. In particular, the chromodomain proteins, known to be involved in the repair of DSB by their role in the remodeling of chromatin, were found to display an increase in phosphorylation. It has been shown that CHD2 interacts with PARP1 in favor of NHEJ [Citation44]. Other proteins also involved in NHEJ include UVRAG protein [Citation45], TRRAP [Citation46] or BCLAF1 [Citation47]. Other repair mechanisms are also represented: CHD1 [Citation48,Citation49] or MUS81 [Citation50] involved in the HR, DDB2 [Citation51] in NER, or the CDK1 protein [Citation52] which regulates NHEJ. Overall, these results show a regulation in the activation of proteins involved in homologous recombination, and NHEJ, which could explain the mechanisms of compensation allowing the cells to survive treatment with Etoposide following knock-down of the MCM complex.
Additional MCM family proteins, MCM8 and MCM9, have been reported to be involved in homologous recombination and are recruited to sites of DNA damage, and cells depleted for MCM8 or MCM9 are hypersensitive to ICL-inducing agents [Citation53–Citation56]. These proteins form a distinct complex from MCM2-7, although have been shown to be required for fork elongation and MCM2-7 loading onto origins of replication [Citation57,Citation58]. Interestingly, MCM2-depleted cells activate a DNA damage response but can still maintain DNA synthesis which is dependant of MCM8 and MCM9 [Citation59]. So even though the MCM2-7 and MCM8-9 complexes appear to be distinct, there are some overlapping functions and interactions that may explain the effect on DNA double-strand break repair.
In conclusion, reduction of MCM proteins within cells do not affect cellular growth, as well as short term viability to treatment with DNA damaging agents such as Etoposide. However, knock-down of MCM proteins reduces the potential of cells for undergoing homologous recombination and non-homologous end-joining, suggesting a role for the MCM complex in this DNA repair process.
Materials and methods
Cell culture, lentiviruses production and generation of cell lines stably knocked-down for MCM proteins
U2OS and HEK-293 cells were grown as adherent cells in Dulbecco’s modified eagle medium (DMEM) supplemented with 10% fetal bovine serum, 100 U/ml penicillin/streptomycin and 2 mM GlutaMax. Specific lentiviruses used were pGipz vectors (Dharmacon) targeting MCM2 or MCM3. The shRNAs MCM2 (V3LHS_315340) and MCM3 (V3LHS_409660) were expressed using the mature antisense sequences AGTTGTTGTGATAGATGCC and TTCTTGACCTGCCATGACGT, respectively. The pGIPZ non-silencing lentiviral shRNA was used as control vector (RHS4346). The pGIPZ vectors were modified to replace the GFP by mCherry using Gibson assembly to avoid interference with the GFP-based assays. Viruses were produced in HEK293T cells grown in OptiMEM and transfected with the corresponding pGIPZ plasmid, along with pLP1, pLP2 and pLP-VSVG (ViraPower™ Lentiviral Expression Systems (Life Technologies)) using Lipofectamine 2000 (Life Technologies). After 3 hours, the culture medium was changed and cells were incubated for 2 days. The supernatant was harvested and filtered using 0.45 μm syringe filters. For infection of U2OS and HEK-293 cells, 4 μg/mL of polybrene were added to 1.5 mL of virus-containing supernatant and added to the cell culture medium. At two days post-infection, the culture medium was changed and selection was carried out by the addition of puromycin at a final concentration of 5 µg/ml.
Western blotting and Coomassie staining
Cells were counted using a hemacytometer, and washed 3 times with PBS, lysed directly in Laemmli buffer and incubated at 95°C for 5 min. The same volume of cell lysates was then separated by one-dimensional SDS-PAGE and transferred onto a nitrocellulose blotting membrane (GE Healthcare Life Sciences) which was then incubated with blocking buffer (150mM NaCl, 10mM Tris pH 7.4, 0.1% Tween-20, 5% milk). Membranes were washed 3 times with PBS and incubated with primary antibodies in primary antibody buffer (1% BSA, 10mM Tris pH 7.4, 150mM NaCl, 0.01% NaN3). Secondary antibodies were incubated in secondary buffer (2% BSA, 10mM Tris pH 7.4, 150mM NaCl, 1% milk) and membranes were revealed with Clarity Western ECL substrate (BioRad, cat#170–5061) in a Chemidoc MP imaging system (BioRad). Quantification of immunoblots were performed using ImageJ. The background was first substracted from raw values and then normalized to the GAPDH loading controls. The values displayed under the immunoblots represent the ratio in comparison with the respective untreated signal.
Antibodies
The following antibodies were used: anti-GAPDH (Rabbit polyclonal, Cell Signaling #D16H11), anti-γH2AX (Rabbit polyclonal, Santa Cruz #sc-101696, Dallas, TX), anti-MCM2 (Rabbit polyclonal, Abcam #Ab31159, Cambridge, MA), anti-MCM3 (Santa Cruz #sc-365616, Dallas, TX), anti-MCM5 (Rabbit monoclonal, Abcam #Ab75975, Cambridge, MA), anti-MCM7 (Mouse monoclonal, #Ab2360, Cambridge, MA), anti-CHK2(T68) (Cell Signaling #C13C1, Danvers, MA), anti-CHK1(S345) (Cell Signaling #133D3, Danvers, MA) and anti-P53(S15) (Cell Signaling #16G8, Danvers, MA). Secondary antibodies consisted of anti-mouse IgG-HRP (Goat polyclonal, Cell Signaling #7076S, Danvers, MA) and anti-rabbit IgG-HRP (Goat polyclonal, Cell Signaling #7074S, Danvers, MA).
FACS analysis
Cells were washed with PBS, trypsinized and centrifuged at 1400 rpm for 5 minutes. The cell pellets were washed once with PBS and resuspended in cold 70% ethanol. The cells were washed again once with PBS and resuspended in PBS containing 50 μg/mL propidium iodine and 50 μg/mL RNAse A and incubated for 1 hour. For cells expressing pDRGFP or pimEJ5, cells were washed with PBS, trypsinized and centrifuged at 1400 rpm for 5 minutes. The cell pellets were resuspended in PBS. FACS analysis was performed on a BD Fortessa cytometer (Becton Dickinson).
Cell growth and survival assays
Cells were cultured on 60 mm dishes and counted using a hemacytometer at 24, 48 and 72 hours following the first count to measure cell growth. For the 3-(4, 5-dimethylthiazolyl-2)-2, 5-diphenyltetrazolium bromide assays (MTT assays), the same number of cells were cultured on glass coverslips in six-well plates. After 24 hours, cells were treated with Etoposide or the carrier DMSO as a control at the indicated concentration for 48 or 72 hours. MTT assays consisted in the addition of 100 µL of MTT buffer (10 mg/ml) in each well and incubation at 37°C for 2 hours. Cells were then washed with PBS followed by addition of 200 µL of isopropanol containing 1% HCL. Following up and down, 100 µL were transferred in a 96-well plate for reading at 550nm on a microplate reader (VERSAmax, Molecular Devices).
Click-iT EdU newly synthesized DNA assay
Click-iT EdU Alexa Fluor 488 Flow Cytometry Assay Kit (ThermoFisher Scientific) was used to measure nucleotide incorporation into DNA during S-phase. HEK293 and U2OS cells were incubated with 10 μM EdU for 2 hours at 37°C. Cells are then fixed with 100 µl of Click-iT® fixative solution and permeabilized with 100 μL of 1X Click-iT® saponin-based permeabilization and wash reagent. The click reaction is then carried out with 500 µl de Click-iT® reaction cocktail (CuSO4, fluorescent dye azide, reaction buffer additive, PBS) for 30 minutes at room temperature, protected from light. Analysis by flow cytometry was performed on a BD FACSDiva (BD Biosciences) using the 488 nm excitation green emission filter.
Immunofluorescence microscopy
Cells were cultured in 6-well plates on glass coverslips and fixed with 1% paraformaldehyde in PBS for 10 minutes. The cells were then permeabilized by incubating in 0.5% Triton X-100 in PBS for 10 minutes and labelled with primary antibodies diluted in PBS for one hour, and then washed once in 0.1% Triton X-100 in PBS and twice in PBS. The primary antibodie anti-γH2AX (Rabbit polyclonal, Santa Cruz #sc-101696, Dallas, TX) was detected with an Alexa 488 conjugated secondary antibodies (Molecular Probes). DNA was counterstained with 4.6-diamidino-2-phenylindole (DAPI) and the coverslips were mounted on glass slides on a drop of Shandon Immuno-Mount (Thermo Scientific) prior to imaging using a Leica DM 2500 fluorescence microscope.
Repair assays
pHR-GFP and pNHEJ-GFP are GFP-based chromosomal reporter assays to measure homologous recombination and non-homologous end-joining, respectively, following induction of DNA breaks by I-Sce1 cleavage. These plasmids are based on DR-GFP [Citation60] and EJ5-GFP [Citation61] (Addgene). Due to incompatible resistance with the antibiotics used for selection following lentiviral infection, DR-GFP was modified to replace the puromycin resistance with the G418 resistance cassette from pEGFP-C1. The puromycin resistance gene was removed by digestion with SmaI, and a PCR product including the G418 resistance from pEGFP-C1 was subcloned into the blunt ends left by the SmaI digestion. This plasmid is named pHR-GFP. The EJ5SceGFP cassette from EJ5-GFP was transferred using XhoI and NheI to replace the GFP into the pEGFP-C1 plasmid in which the kanamycin/neomycin resistance gene was also replaced with an ampicillin gene pEGFP-C1amp. For simplicity, this EJ5SceGFP – pEGFP-C1(amp) plasmid was named pNHEJ-GFP. The pCAG-ISce1 plasmid expresses the restriction enzyme I-Sce1 (Addgene).
The pHR-GFP and pNHEJ-GFP plasmids were transfected into HEK-293 cells, and stable incorporation was achieved by selecting resistant cells using G418 at 600 μg/ml. Following selection, individual clones were obtained by limiting dilution. After growth, individual clones were tested by transiently transfecting I-Sce1 followed by FACS analysis. Stable clonal cell lines for pHR-GFP or pNHEJ-GFP were considered positive when the GFP-positive cells increased by at least 5–10 fold following transfection with I-Sce1.
The HR and NHEJ clones were then infected with lentivirus as described above, targeting MCM2, MCM3 or the non-silencing controls. At two days post-infection, the culture medium was changed and selection was carried by the addition of puromycin at a final concentration of 5 µg/ml. The assays for homologous recombination or non-homologous end-joining were performed by transiently transfecting pCAG-ISce1 in these cell lines. After 96 hours, cells were harvested and processed for FACS analysis as described above.
Cell fractionation
Cytoplasmic and nuclear fractions were obtained from U2OS cells using the cell fractionation kit (Cell signaling #9038). Briefly, cells were washed with PBS and trypsinized. Cold medium was added and cells were centrifuged for 5 minutes at 350xg. Cells were washed with cold PBS, resuspended in 500 µL PBS and centrifuged at 4°C for 5 min at 500xg. The pellets were resuspended in 300 µL ClB buffer, incubated on ice for 5 minutes and centrifuged at 4°C for 5 min at 500 xg. The supernatant represents the cytoplasmic fraction. Pellets were then resuspended in 300 µL MlB buffer, incubated 5 minutes on ice and centrifuged at 4°C for 5 minutes at 8000 xg. The supernatant represents the membrane and organelle fraction and was discarded. Pellets were then lysed with HPK2 buffer (1% NP40, 50mM Tris pH 7.5, 300 mM NaCl, 150 mM KCl, 5 mM EDTA, 1mM DTT, 10 mM PMSF, 10% glycerol) for 30 minutes on ice. Cells were then centrifuged at 4°C for 20 minutes at 20000xg. The supernatant constitutes the nuclear fraction.
Peptide preparation and phosphopeptide purification
The nuclear pellets were resuspended in 300µL 10 mM HEPES pH 8.0, 8M urea and sonicated 12 × 5 seconds at 25% intensity. Thereafter, 1.5 µg of DTT was added to 250 µL samples, boiled for 2 minutes at 95°C and incubated for 30 minutes at room temperature (RT)m, after which 7.5 ug of IAA were added for 20 minutes at RT in the dark. The urea concentration was decreased to 2 M by adding 50mM sodium bicarbonate solution (NH4HCO3). One µg/µL of trypsin was added overnight at 30°C. Samples were acidified to a final concentration of 0.1% TriFluoroacetic Acid (TFA).
Peptides were purified with HYPERSEP C18, 100mg/1ml (Thermo Scientific, cat:60108–32) previously washed with 100% acetonitrile followed by 0.1% TFA. After passage of the peptides into the column and 3 other washes with 0.1% TFA, peptides were eluted with 50% acetonitrile-2% formic acid (FA), lyophilized in Speedvac and resuspended in 100µL 2% FA for assay. Acetonitrile and FA were added to a final volume of 500 µL (80% and 2% respectively).
Phosphorylated peptides were enriched using the Pierce Magnetic Titanium Dioxide Phosphopeptide Enrichment Kit. Fifty µL of 20X TiO2 beads (1µL beads for 10 µg whole proteins) were mixed with 950 µL binding solution. Beads were separated with a magnetic separator and washed 4 times with binding buffer and once with washing buffer. Beads were then incubated with 150 µL elution buffer for 10 min at 1250 rpm. The supernatant containing phosphopeptides was collected and lyophilized by Speedvac. Phosphopeptides were resuspended in 25 µL 1% formic acid.
Mass spectrometry and Bioinformatics analysis
The purified phosphopeptides were then loaded and separated using a Dionex Ultimate 3000 nanoHPLC system. 10 µl of the sample in 1% (v/v) formic acid was loaded with a constant flow of 4 µl/min onto a trap column (Acclaim PepMap100 C18 column, 0.3 mm id × 5 mm, Dionex Corporation, Sunnyvale, CA). Peptides were then eluted off to a PepMap C18 nano column (75 µm × 50 cm, Dionex Corporation) with a linear gradient of 5–35% solvent B (90% acetonitrile with 0.1% formic acid) over a four hours gradient with a constant flow of 200 nl/min. Peptides were injected into an OrbiTrap QExactive mass spectrometer (Thermo Fischer Scientific Inc.) using the EasySpray source. The voltage was set to 2.0 kV and the temperature of the column was set to 40°C. Acquisition of the full scan MS survey spectra (m/z 350–1600 was performed at a resolution of 70,000 using the accumulation of 1,000,000 ions. Peptides fragmented by collision-induced dissociation were selected on the ten highest intensities for from the preview scan. The normalized collision energy used was 35% and the resolution was set at 17,500 for 50,000 ions with a filling time set to a maximum of 250 ms for the full scans and 60 ms for the MS/MS scans. Unassigned charge states as well as singly, 7 and 8 charged species for the precursor ions were not analyzed, and a dynamic exclusion list was set to 500 entries over a retention time of 40 seconds under a 10 ppm mass window. The lock mass option was also enabled, and data acquisition was done using Xcalibur version 2.2 SP1.48. Protein identification and quantification were performed using the MaxQuant software package version 1.5.2.8 as described previously [Citation62] with the protein database from UniProtKB (Homo sapiens, 16/07/2013, 88,354 entries). For protein identification, carbamidomethylation on cysteine was used as a fixed modification and phosphorylation of serine, threonine and tyrosine (Phospho STY), as well as methionine oxidation and protein N-terminal acetylation were used as variable modifications. The enzyme was set to trypsin/P (ie no cleavages on lysine or arginine before a proline), with up to two miscleavages allowed. The mass tolerance was 7 ppm for the precursor ions and 20 ppm for the fragment ions. Re-quantification of selected isotopic patterns was allowed to obtain ratios of all SILAC pairs [Citation63]. We set a threshold of 1% for the false discovery rate (FDR). The mass spectrometry data have been deposited to the ProteomeXchange Consortium (http://proteomecentral.proteomexchange.org) via the PRIDE partner repository with the dataset identifier PXD009539.
Statistical analysis of IsceI-induced GFP expression
Numerical results are expressed as means ± standard deviations of the percentage of IsceI-induced GFP expression (100,000 cells count) from at least 3 independent experiments. Statistical analyses were performed using a two-sample t-test with the Perseus software (version 1.5.5.3) (Munich, Germany). A p value <0.05 and <0.01 were deemed significant, and are represented using one or two asterisks, respectively.
Supplemental Material
Download Zip (1.1 MB)Disclosure statement
No potential conflict of interest was reported by the authors.
Supplementary material
Supplemental data for this article can be accessed here.
Additional information
Funding
Related Research Data
References
- Blow JJ, Gillespie PJ. Replication licensing and cancer–a fatal entanglement? Nat Rev Cancer. 2008;8:799–806.
- Blow JJ, Dutta A. Preventing re-replication of chromosomal DNA. Nat Rev Mol Cell Biol. 2005;6:476–486.
- Bell SD, Botchan MR. The minichromosome maintenance replicative helicase. Cold Spring Harb Perspect Biol. 2013;5:a012807.
- Sclafani RA, Fletcher RJ, Chen XS. Two heads are better than one: regulation of DNA replication by hexameric helicases. Genes Dev. 2004;18:2039–2045.
- Bochman ML, Schwacha A. The Mcm complex: unwinding the mechanism of a replicative helicase. Microbiol Mol Biol Rev. 2009;73:652–683.
- Arias EE, Walter JC. Strength in numbers: preventing rereplication via multiple mechanisms in eukaryotic cells. Genes Dev. 2007;21:497–518.
- Allen C, Ashley AK, Hromas R, et al. More forks on the road to replication stress recovery. J Mol Cell Biol. 2011;3:4–12.
- Nam EA, Cortez D. ATR signalling: more than meeting at the fork. Biochem J. 2011;436:527–536.
- Bailis JM, Forsburg SL. MCM proteins: DNA damage, mutagenesis and repair. Curr Opin Genet Dev. 2004;14:17–21.
- Forsburg SL. Eukaryotic MCM proteins: beyond replication initiation. Microbiol Mol Biol Rev. 2004;68:109–131.
- Crevel I, Crevel G, Gostan T, et al. Decreased MCM2-6 in Drosophila S2 cells does not generate significant DNA damage or cause a marked increase in sensitivity to replication interference. PloS One. 2011;6:e27101.
- Crevel G, Hashimoto R, Vass S, et al. Differential requirements for MCM proteins in DNA replication in Drosophila S2 cells. PloS One. 2007;2:e833.
- Lei M, Kawasaki Y, Tye BK. Physical interactions among Mcm proteins and effects of Mcm dosage on DNA replication in Saccharomyces cerevisiae. Mol Cell Biol. 1996;16:5081–5090.
- Oehlmann M, Score AJ, Blow JJ. The role of Cdc6 in ensuring complete genome licensing and S phase checkpoint activation. J Cell Biol. 2004;165:181–190.
- Ibarra A, Schwob E, Mendez J. Excess MCM proteins protect human cells from replicative stress by licensing backup origins of replication. Pro Natl Acad Sci U S A. 2008;105:8956–8961.
- Das M, Singh S, Pradhan S, et al. MCM paradox: abundance of eukaryotic replicative helicases and genomic integrity. Mol Biol Int. 2014;2014:1–11.
- Painter RB, Young BR. Radiosensitivity in ataxia-telangiectasia: a new explanation. Proc Natl Acad Sci U S A. 1980;77:7315–7317.
- Hartwell LH, Weinert TA. Checkpoints: controls that ensure the order of cell cycle events. Science. 1989;246:629–634.
- Bartkova J, Horejsi Z, Koed K, et al. DNA damage response as a candidate anti-cancer barrier in early human tumorigenesis. Nature. 2005;434:864–870.
- Gorgoulis VG, Vassiliou LV, Karakaidos P, et al. Activation of the DNA damage checkpoint and genomic instability in human precancerous lesions. Nature. 2005;434:907–913.
- Smith J, Tho LM, Xu N, et al. The ATM-Chk2 and ATR-Chk1 pathways in DNA damage signaling and cancer. Adv Cancer Res. 2010;108:73–112.
- Ciccia A, Elledge SJ. The DNA damage response: making it safe to play with knives. Mol Cell. 2010;40:179–204.
- Stracker TH, Usui T, Petrini JH. Taking the time to make important decisions: the checkpoint effector kinases Chk1 and Chk2 and the DNA damage response. DNA Repair (Amst). 2009;8:1047–1054.
- Cortez D, Glick G, Elledge SJ. Minichromosome maintenance proteins are direct targets of the ATM and ATR checkpoint kinases. Proc Natl Acad Sci U S A. 2004;101:10078–10083.
- Ishimi Y, Komamura-Kohno Y, Kwon HJ, et al. Identification of MCM4 as a target of the DNA replication block checkpoint system. J Biol Chem. 2003;278:24644–24650.
- Sheu YJ, Stillman B. The Dbf4-Cdc7 kinase promotes S phase by alleviating an inhibitory activity in Mcm4. Nature. 2010;463:113–117.
- Yoo HY, Shevchenko A, Shevchenko A, et al. Mcm2 is a direct substrate of ATM and ATR during DNA damage and DNA replication checkpoint responses. J Biol Chem. 2004;279:53353–53364.
- Drissi R, Dubois ML, Douziech M, et al. Quantitative proteomics reveals dynamic interactions of the minichromosome maintenance complex (MCM) in the cellular response to etoposide induced DNA damage. Mol Cell Proteomics. 2015;14:2002–2013.
- Ward IM, Wu X, Chen J. Threonine 68 of Chk2 is phosphorylated at sites of DNA strand breaks. J Biol Chem. 2001;276:47755–47758.
- Liu Q, Guntuku S, Cui XS, et al. Chk1 is an essential kinase that is regulated by Atr and required for the G(2)/M DNA damage checkpoint. Genes Dev. 2000;14:1448–1459.
- Boisvert FM, Ahmad Y, Gierlinski M, et al. A quantitative spatial proteomics analysis of proteome turnover in human cells. Mol Cell Proteomics. 2012;11:M111 011429.
- Ge XQ, Jackson DA, Blow JJ. Dormant origins licensed by excess Mcm2-7 are required for human cells to survive replicative stress. Genes Dev. 2007;21:3331–3341.
- Bochman ML, Bell SP, Schwacha A. Subunit organization of Mcm2-7 and the unequal role of active sites in ATP hydrolysis and viability. Mol Cell Biol. 2008;28:5865–5873.
- Davey MJ, Indiani C, O’Donnell M. Reconstitution of the Mcm2-7p heterohexamer, subunit arrangement, and ATP site architecture. J Biol Chem. 2003;278:4491–4499.
- Kimura H, Ohtomo T, Yamaguchi M, et al. Mouse MCM proteins: complex formation and transportation to the nucleus. Genes Cells. 1996;1:977–993.
- Liku ME, Nguyen VQ, Rosales AW, et al. CDK phosphorylation of a novel NLS-NES module distributed between two subunits of the Mcm2-7 complex prevents chromosomal rereplication. Mol Biol Cell. 2005;16:5026–5039.
- Han X, Aslanian A, Fu K, et al. The interaction between checkpoint kinase 1 (Chk1) and the minichromosome maintenance (MCM) complex is required for DNA damage-induced Chk1 phosphorylation. J Biol Chem. 2014;289:24716–24723.
- Yan H, Tammaro M, Liao S. Collision of trapped topoisomerase 2 with transcription and replication: generation and repair of DNA double-strand breaks with 5ʹ adducts. Genes (Basel). 2016;7:32.
- Shukla A, Navadgi VM, Mallikarjuna K, et al. Interaction of hRad51 and hRad52 with MCM complex: a cross-talk between recombination and replication proteins. Biochem Biophys Res Commun. 2005;329:1240–1245.
- Bailis JM, Luche DD, Hunter T, et al. Minichromosome maintenance proteins interact with checkpoint and recombination proteins to promote s-phase genome stability. Mol Cell Biol. 2008;28:1724–1738.
- Shechter D, Gautier J. MCM proteins and checkpoint kinases get together at the fork. Proc Natl Acad Sci U S A. 2004;101:10845–10846.
- Vidi PA, Liu J, Salles D, et al. NuMA promotes homologous recombination repair by regulating the accumulation of the ISWI ATPase SNF2h at DNA breaks. Nucleic Acids Res. 2014;42:6365–6379.
- Min S, Jo S, Lee HS, et al. ATM-dependent chromatin remodeler Rsf-1 facilitates DNA damage checkpoints and homologous recombination repair. Cell Cycle. 2014;13:666–677.
- Luijsterburg MS, de Krijger I, Wiegant WW, et al. PARP1 links CHD2-mediated chromatin expansion and H3.3 deposition to DNA repair by non-homologous end-joining. Mol Cell. 2016;61:547–562.
- Zhao Z, Oh S, Li D, et al. A dual role for UVRAG in maintaining chromosomal stability independent of autophagy. Dev Cell. 2012;22:1001–1016.
- Robert F, Hardy S, Nagy Z, et al. The transcriptional histone acetyltransferase cofactor TRRAP associates with the MRN repair complex and plays a role in DNA double-strand break repair. Mol Cell Biol. 2006;26:402–412.
- Lee YY, Yu YB, Gunawardena HP, et al. BCLAF1 is a radiation-induced H2AX-interacting partner involved in gammaH2AX-mediated regulation of apoptosis and DNA repair. Cell Death Dis. 2012;3:e359.
- Kari V, Mansour WY, Raul SK, et al. Loss of CHD1 causes DNA repair defects and enhances prostate cancer therapeutic responsiveness. EMBO Rep. 2016;17:1609–1623.
- Shenoy TR, Boysen G, Wang MY, et al. CHD1 loss sensitizes prostate cancer to DNA damaging therapy by promoting error-prone double-strand break repair. Ann Oncol. 2017;28:1495–1507.
- Boddy MN, Gaillard PH, McDonald WH, et al. Mus81-Eme1 are essential components of a holliday junction resolvase. Cell. 2001;107:537–548.
- Ray A, Milum K, Battu A, et al. NER initiation factors, DDB2 and XPC, regulate UV radiation response by recruiting ATR and ATM kinases to DNA damage sites. DNA Repair (Amst). 2013;12:273–283.
- Hentges P, Waller H, Reis CC, et al. Cdk1 restrains NHEJ through phosphorylation of XRCC4-like factor Xlf1. Cell Rep. 2014;9:2011–2017.
- Lee KY, Im JS, Shibata E, et al. MCM8-9 complex promotes resection of double-strand break ends by MRE11-RAD50-NBS1 complex. Nat Commun. 2015;6:7744.
- Lutzmann M, Grey C, Traver S, et al. MCM8- and MCM9-deficient mice reveal gametogenesis defects and genome instability due to impaired homologous recombination. Mol Cell. 2012;47:523–534.
- Nishimura K, Ishiai M, Horikawa K, et al. Mcm8 and Mcm9 form a complex that functions in homologous recombination repair induced by DNA interstrand crosslinks. Mol Cell. 2012;47:511–522.
- Park J, Long DT, Lee KY, et al. The MCM8-MCM9 complex promotes RAD51 recruitment at DNA damage sites to facilitate homologous recombination. Mol Cell Biol. 2013;33:1632–1644.
- Lutzmann M, Mechali M. MCM9 binds Cdt1 and is required for the assembly of prereplication complexes. Mol Cell. 2008;31:190–200.
- Maiorano D, Cuvier O, Danis E, et al. MCM8 is an MCM2-7-related protein that functions as a DNA helicase during replication elongation and not initiation. Cell. 2005;120:315–328.
- Natsume T, Nishimura K, Minocherhomji S, et al. Acute inactivation of the replicative helicase in human cells triggers MCM8-9-dependent DNA synthesis. Genes Dev. 2017;31:816–829.
- Pierce AJ, Johnson RD, Thompson LH, et al. XRCC3 promotes homology-directed repair of DNA damage in mammalian cells. Genes Dev. 1999;13:2633–2638.
- Bennardo N, Cheng A, Huang N, et al. Alternative-NHEJ is a mechanistically distinct pathway of mammalian chromosome break repair. PLoS Genet. 2008;4:e1000110.
- Cox J, Mann M. MaxQuant enables high peptide identification rates, individualized p.p.b.-range mass accuracies and proteome-wide protein quantification. Nat Biotechnol. 2008;26:1367–1372.
- Cox J, Matic I, Hilger M, et al. A practical guide to the MaxQuant computational platform for SILAC-based quantitative proteomics. Nat Protoc. 2009;4:698–705.