
ABSTRACT
We have shown that cytoplasmic actin isoforms play different roles in neoplastic cell transformation. β-Cytoplasmic actin acts as a tumor suppressor, affecting epithelial differentiation, cell growth, cell invasion and tumor growth of colon and lung carcinoma cells. In contrast, γ-cytoplasmic actin enhances malignant features of tumor cells whose actin network regulation is carried out via the γ-actin isoform. The goal of this study was to describe the role of cytoplasmic actins in cell cycle regulation of breast cancer cell lines MCF-7 and MDA-MB-231. The distinct roles of each cytoplasmic actin in the cell cycle driving were observed. β-Actin as well as γ-actin down-regulation inhibited proliferation of breast cancer cells, but only down-regulation of β-actin induced a significant decrease in diploid cell population and accumulation of tetraploid cells. Down-regulation of β-actin stimulated cyclin A2, B1 and D3 expression, whereas down-regulation of γ-actin reduced expression of these cyclins in both cell lines. Moreover, cyclin B1 and γ-actin were co-localized in mitotic control and β-actin-deficient cells. In mitotic MCF-7 cells down-regulation of β-actin caused an enrichment of prophase/metaphase population compared with control. γ-Actin down-regulation induced telophase enrichment.
ERK1/2 and γ-actin co-localization and possible selective binding were revealed in MCF7 cells. β-Actin down-regulation induced ERK1/2 activation, while γ-actin down-regulation led to reduction of p-ERK1/2. A direct interaction of ERK1/2 with γ-actin and cyclin A2 in the same protein complex was also discovered. We suggest that γ-actin down-regulation leads to decrease of cyclin A2 level, inhibits ERK1/2 signaling and deceleration of breast cancer cells proliferation.
KEYWORDS:
Introduction
The modulation of cell shape during cell cycle progression needs coordinated interaction between reorganization of cytoskeletal system and cell signaling molecules. Different reagents were used to perturb the actin cytoskeleton and to study their effects on cell cycle progression. The contribution of the actin cytoskeleton to cell cycle progression and the role of different actin binding and regulatory proteins in this process were found and summarized [Citation1–Citation4].
Previous studies provide evidence of important roles of actin and its regulatory proteins in cell division [Citation3]. However, the relative contribution of the non-muscle actin isoforms to mitotic progression and cell cycle regulation was not investigated. Considering clear segregation and different distribution of actin isoforms in anaphase-telophase of normal mitotic epithelial cells [Citation5], also taking into account functional difference between β- and γ-actins in immortalized keratinocytes and carcinoma cells proliferation [Citation5,Citation6], we performed this study to link cytoplasmic actin isoforms with cell cycle regulation in carcinoma cells.
The studies using small interfering RNA (siRNA) reported that knockdown of γ-actin more dramatically impaired motility of human subcutaneous fibroblasts, spontaneously immortalized keratinocytes, and neuroblastoma SHEP cells than did knockdown of β-actin [Citation5,Citation7–Citation10] in 2D test systems. It is accepted that the enhanced motility of cancer cells is crucial for invasion. The results of our 3D – migration/invasion analysis [Citation6,Citation11] on A549 lung and MCF-7 breast carcinoma cells suggest an important role of γ-actin in this process. Motility (invasion and metastasis) of tumor cells and proliferation stages could be in different time/space of tumour development, nevertheless both stages are important for cancer progression.
Results
Down- and up-regulation of actin isoforms alter the phenotypes of cancer cell lines
To study mechanisms of actin isoforms individual participation in carcinoma cells proliferation, we obtained MCF-7 ()) and MDA-MB-231 ()) derivatives with silenced β- and γ-actins. shRNAs depletions were specific for each of cytoplasmic actin isoforms (). β-Actin depletion in MCF-7 and MDA-MB-231 cells was accompanied by γ-actin up-regulation. γ-Actin down-regulation resulted in β-actin enhancement. The compensatory mechanism for cytoplasmic actin isoforms expression acts both on mRNA and protein levels [Citation6,Citation7,Citation12].
Figure 1. Down-regulation of β- or γ-actin expression by corresponding shRNAs in breast cancer cells leads to phenotypical changes; (a, b). Immunofluorescent staining of MCF-7 (a) and MDA-MB-231 (b) cells with β- or γ-actin depletion by corresponding shRNAs. Both β- and γ-actin depletion induce major and different morphological changes. Bar, 10 µm; (c, d) Down-regulation of cytoplasmic actins in MCF-7 (c) and MDA-MB-231 (d) cells. WB analysis. Graphs represent relative actins expression (Mean ± SEM).
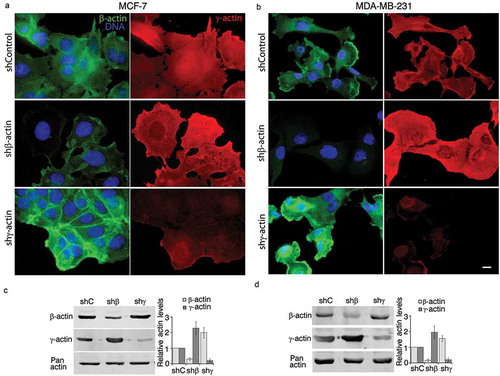
Parental MCF-7 ()) and MDA-MB-231 ()) cultures have moderate or low levels of β-actin staining, mainly presented by disorganized β-actin bundles and evenly moderate level of γ-actin cortical staining with an enrichment of both isoforms at the leading edge. In MCF-7 ()) and MDA-MB-231 ()) cells further β-actin down-regulation induced more mesenchymal (spread and motile) cell phenotype and γ-actin down-regulation induced more epithelial phenotype with epithelial islets formation ().
Growth kinetics in cell culture: individual down-regulation of actin isoforms influences carcinoma cells proliferation in vitro
Silencing of γ-actin or β-actin in mammary gland carcinoma cell lines MCF-7 and MDA-MB-231 led to significant alterations in proliferation in vitro (). The latter phenomenon could be explained by impaired cytokinesis in β-actin-depleted cells [Citation5] and that both actins isoforms are necessary for mitotic process, while total inactivation β- or γ-actins causes abnormal cell division.
Figure 2. The effects of β/γ-actin down-regulation on cell growth and cell cycle in vitro. (a, b) MCF-7 and MDA-MB-231 cells with β- or γ-actin depletion by corresponding shRNAs were cultured after 2 d of infection for the time indicated to analyze the effect on cell growth. (c) After 4 d of β- or γ-actin depletion by corresponding shRNAs the MCF-7 cells were stained with propidium iodide, and cell cycle distributions were analyzed by flow cytometry. (d) High content analysis of cell cycle distributions of flow cytometric data was performed after 6 d of β- or γ-actin depletion by corresponding shRNAs in the MCF-7 cells. (e) The effects of β- or γ-actin depletion on mitotic phases were also analyzed. The Y-axis indicates the percentage of cells in different phases of mitosis.
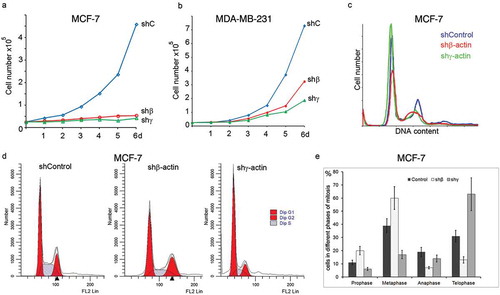
To determine whether actins depletion induced inhibition of cell proliferation of the breast cancer cells via cell cycle delay, we investigated the effect of actin’s down-regulation on the cell cycle of MCF-7 and MDA-MB-231 cells. Flow cytometry data () showed that 4–6 d of β- or γ-actins down-regulation in MCF-7 cells resulted in an obvious inhibition of cell cycle progression. There was an increase in the G2/M, which was accompanied by a decrease in the G0/G1 fraction in β-actin depleted cells compared with sh-control (treated with control shRNA). A decrease in the G2/M phase fraction was accompanied by an increase in the G0/G1 fraction in γ-actin deficient cell cultures.
Cell cycle analysis using a high-content system ()) showed that in control MCF-7 culture practically all cells were diploid (96.5 ± 3.5 %). Among them 47.2 ± 8.7 % were in G0/G1, 20.3 ± 3.2 % in G2/M and 32.5 ± 4.5 % of cells in S phases. In β-actin depleted MCF-7 culture 82.3 ± 2.4% of cells were diploid including 49.4 ± 5.8 % of cells in G0/G1, 27.7 ± 2.3 % in G2/M and 22.9 ± 3.4 % of cells in S phase populations. Similarly, for MDA-MB-231 cells β-actin depletion led to an obvious increase in the number of cells in G2/M phase from 17.5 ± 2,8% (sh-control) to 27.3 ± 4.4% (Supplemental ). In addition to diploid cells, aneuploid cells were detected (9.7 ± 4.6 %) in β-actin depleted MDA-MB-231 cells.
In γ-actin depleted MCF-7 culture all cells were diploid including 69.4 ± 8.2 % of cells in G0/G1, 14.9 ± 0.8 % in G2/M and 15.7 ± 2.4 % of cells in S phases ()). For MDA-MB-231 cells γ-actin depletion led to an obvious decrease in the number of cells in S phase from 22.2 ± 2.8% (sh-control) to 9.6 ± 0,8% (Supplemental ).
We also analyzed the mitotic phases in MCF-7 cultures at the same early treatment conditions (4 d of actin’s down-regulation) by IF cytometry ()). MCF-7 cells with γ-actin (β-actin depleted) had an enrichment of prophase/metaphase stage compared with control, whereas γ-actin down-regulation induced an enrichment of telophase stage.
We show here that in investigated breast cancer cell cultures β-actin depletion targets cell cycle regulation, as increased G2/M and decreased the G1 fraction were found in treated cells.
Taken together, the above results indicated that the inhibitory effect of β-actin depletion on the proliferation of MCF-7 and MDA-MB-231 cells correlated with G2/M phase accumulation, whereas γ-actin down-regulation caused G0/G1 delay of cell cycle in both breast cancer cell lines.
β-actin and γ-actin differently regulate cell cycle-related proteins in breast cancer cells
The mechanism by which β/γ-actin depletion partially inhibits the cell cycle might involve a direct effect on the expression of cell cycle regulators. Thus, we investigated the effects of cytoplasmic actins depletion on cell cycle-related proteins in breast cancer cells. The protein complex formed by cyclin B1 and cdc2 (also called CDK1) is a specific regulator of G2/M phase progression. We analyzed the amount of cyclin B1 in MCF-7 and MDA-MB-231 cells after β/γ-actin reduction via western blotting. In both cell lines the protein level of cyclin B1 increased after β-actin down-regulation and decreased after γ-actin down-regulation ()). Several studies have demonstrated that cyclin A is also involved in the G2/M transition, and that the cyclin A/CDK1 complex promotes the activation of the cyclin B1/CDK1 complex. Our data show that cyclin A2 is upregulated in β-actin-depleted and down-regulated in γ-actin-depleted cells in breast cancer cells (). Immunofluorescence analysis of cyclins A2 and B1 after β/γ-actin down-regulation is shown for MDA-MB-231 cells ()). Proximity Ligation Assay (PLA) [Citation13,Citation14] revealed cyclin B1 and γ-actin co-localization in mitotic control and β-actin-deficient cells. Comparative fluorescent signals of cyclin B1−γ-actin PLA dots are shown in control and actins-depleted MCF-7 cells ()). PLA of cyclin B1 and β-actin had fluorescent signals on the level of background.
Figure 3. Cyclins are regulated by β-/γ-actins level. (a, b) WB analysis of MCF-7 (a) and MDA-MB-231 (b) cells with down-regulated β- or γ-actins. (c) Subcellular localization of Cyclin A2 (red) and cyclin B1 (green) by immunofluorescence staining of MDA-MB-231 cells with down-regulated β- or γ-actins. (d) Cyclin B1/γ-actin PLA analysis of MCF-7 cells with down-regulated β- or γ-actins. Graph represents relative fluorescence intensity (Mean ± SEM). (e) Cyclin D3 (red) immunofluorescence images of MDA-MB-231 cells with down-regulated β- or γ-actins. F. Cyclin H (green) and β-actin (red) immunofluorescence images of MCF-7 cells with down-regulated β- or γ-actins. (g) Cyclin H (green) immunofluorescence images of MDA-MB-231 cells with down-regulated β- or γ-actins. DAPI/DNA staining (blue). Bar, 10 μm.
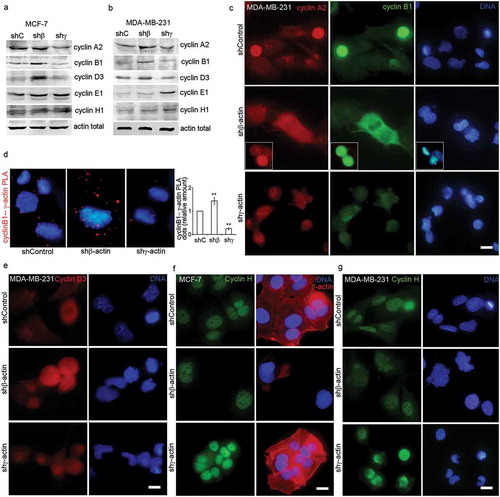
Cyclin D3 is upregulated in β-actin-depleted cells compared with control in both cell lines (). Cyclins E1 and H1 were increased after γ-actin down-regulation in western blotting analysis in MDA-MB-231 only ()), while IF nuclear staining of cyclin H1 was increased in both cell lines with reduction of γ-actin ().
Interplay between γ-actin and ERK1/2 in breast cancer cells
It is well established that cell proliferation in vitro is stimulated by growth factors activating the canonical MAPK pathway. In most cell types, activation of the Ras/Raf/MEK/ERK pathway leads to stimulation of proliferation. Constitutive activity of this pathway is measured in different cancers [Citation15]. It is important to take into account, that nuclear translocation of ERK1/2 is necessary for cells to enter the cell cycle [Citation16]. We have previously shown reciprocal regulation between actin isoforms and ERK1/2 MAP-kinases. Our experiments showed for the first time that active ERK1/2 could interact with γ-actin in neoplastic epithelial cells of lung and colon carcinoma cell lines [Citation6].
Here we investigated the pattern of ERK1/2 activation using confocal Laser Scanning Microscope (LSM) ()). Control MCF-7 cells exhibited moderated level of cytoplasmic and low level of nuclear phosphorylated ERK1/2 (p-ERK1/2) staining. Silencing of β-actin led to γ-actin increase and induced both cytoplasmic p-ERK1/2 enhancement and nuclear accumulation of p-ERK1/2, while silencing of γ-actin reduced p-ERK1/2 staining ()). LSM revealed nuclear and cytoplasmic co-localization of γ-actin and p-ERK1/2 especially in β-actin-deficient cells. According to western blot analysis ()), down-regulation of β-actin was associated with ERK1/2 activation.
Figure 4. ERK1/2 activity is regulated by γ-actin. (a) Laser Scanning Microscopy (LSM) of MCF-7 cells with down-regulated β- or γ-actins with β-actin (green), γ-actin (purple) or p-ERK1/2 (red) immunofluorescent staining. DAPI/DNA staining (blue). Scale bars represent 10 µm. (b)WB analysis of p-ERK1/2 in MCF-7 cells with down-regulated β- or γ-actins by corresponding shRNAs. (c) p-ERK1/2 immunoprecipitation analysis of MCF-7 cells with down-regulated β- or γ-actins. (d) p-ERK1/2/γ-actin PLA analysis of MCF-7 and MDA-MB-231 cells with down-regulated β- or γ-actins. Immunofluorescence images of p-ERK1/2/γ-actin PLA dots at nuclear (green) and lamellar (red) z-levels in MCF-7 (upper panel) and MDA-MB-231(lower panel) cells with down-regulated β- or γ-actins. Bar, 10 µm. Graphs represent relative amount of PLA dots at nuclear (green) and lamellar (red) z-levels (Mean ± SEM).
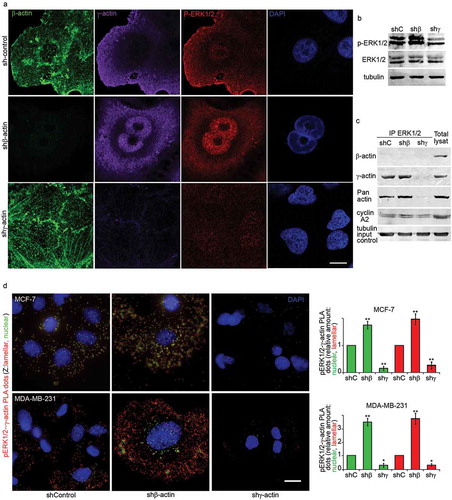
We confirmed ERK1/2 and γ-actin binding by co-immunoprecipitation ()) in MCF-7 cells with silenced β- or γ-actins. γ-Actin and cyclin A2 were both detected in Co-IP by ERK1/2 antibodies suggesting possible direct interaction between these proteins. Negative control for IP using isotype specific antibodies matched no signal.
PLA verified p-ERK1/2 and γ-actin co-localization. PLA for γ-actin and p-ERK1/2 demonstrated highly specific and strong signals as multiple cytoplasmic dots in control and β-actin-deficient cells ()). Comparative fluorescent signals of p-ERK1/2−γ-actin PLA dots are shown in control and actins-depleted MCF-7 and MDA-MB-231 cells (), left). Dots at the nuclear z-levels are shown in green pseudo-color in order to separate these signals from the others summarized z-levels (shown in red). Separated quantification of PLA dots for lamellar and nuclear regions is shown in red and green, respectively (), diagrams). PLA for β-actin and p-ERK1/2 antibodies had fluorescent signals on the level of background (data not shown).
Discussion
We have shown that silencing of γ-actin or β-actin in mammary gland carcinoma cell lines MCF-7 and MDA-MB-231 led to significant alterations in proliferation in vitro. Based on flow cytometric data, we have found that β–actin depletion, unlike the control or γ–actin depletion, caused accumulation of cells in G2/M phase in tested cancer cell lines. Cell cycle analysis using a high-content system showed that the percentage of cells in G2/M phase was increased after β–actin down-regulation. We analyzed mitotic cells via immunofluorescence to gain insight into mechanisms of cell cycle perturbation induced by actin isoform’s depletion. This cytometry analysis had revealed that β/γ–actins disproportion induced a delay of mitotic stages in breast cancer cells.
Dysregulation of the cell cycle is correlated with proliferation of cancer cells [Citation15,Citation17,Citation18]. The primary cyclins (A, B1, D1, D3 and E) are crucial for cell cycle progression. Cyclin A2 is a crucial protein that is required for cell cycle transition from S phase to G2/M phase. After cells’ entrance to G2/M phase, cyclin A2 is replaced by cyclin B. Once cyclin B is activated, cyclin A is no longer needed and is subsequently degraded through the ubiquitin pathway [Citation19]. We have confirmed here, that human cyclins A and B are differentially located in the cell and undergo cell cycle-dependent nuclear transport [Citation20]. This translocation results in suppression of cell cycle progression and G2/M phase delay (based on flow cytometric analysis of cellular DNA content).
Our results indicated that both cell lines displayed an increase in the protein levels of cyclins B1 and A2 after β-actin down-regulation and a decrease after γ-actin down-regulation in both cell lines, which is consistent with the delay in G2/M or G1 phases, respectively. Over-expression of cyclin A was highly associated with poor prognosis in breast cancer patients [Citation21,Citation22]. Prognostic and clinico-pathological significance of cyclin B expression in patients with breast cancer were also evaluated [Citation23]. The meta-analysis of multiple data concluded that there are significant associations between cyclin B overexpression and poor survival in patients with breast cancer, indicating that cyclin B may be a potential biomarker in breast cancer. Secondary cyclins (C and H) have putative indirect effects on cell cycle progress.
Our immunofluorescence and immunoblot results revealed upregulation of both cyclin A2 and cyclin B1 after down-regulation of β-actin and indicated that MCF-7 and MDA-MB-231 cells had completed the transition from S to G2/M phase. Cdc2, as a member of the cyclin-dependent kinase 1 (CDK1) complex with cyclin B1, plays an important role in G2 into M phase transition control [Citation19]. We analyzed whether β-actin depletion–induced mitotic delay occurred in pre-anaphase by evaluating the expression of cyclin B1, a protein that is rapidly degraded at the metaphase-anaphase transition [Citation24]. During a normal cell cycle, the progression of cells from G2 to M phase is triggered by activation of cyclin B1-dependent Cdc2 kinase [Citation25–Citation27], which is regulated by a series of phosphorylation-dephosphorylation events and protein-protein interactions [Citation28–Citation30]. In general, a cell with suppressed cyclin B1/Cdc2 activity would tend to be delayed in G2 phase, whereas a cell with an elevated cyclin B1/Cdc2 activity would be favored to enter mitosis. This general principle is supported by a large body of experimental observations. To maintain genome integrity and reduce the incidence of aneuploidy, the mitotic checkpoint delays anaphase and exit from mitosis until all kinetochores are attached to microtubules. MCF-7 cells are delayed in G2/M in experimental conditions of strong β-actin depletion, despite cyclins A and B overexpression. In MDA-MB-231 cells β-actin decrease did not detained G2/M significantly and induced aneuploidy. Cell cycle checkpoint could be overcome through p53 mutation, as we have seen in MDA-MB-231 cells. It should be noted that moderate β-actin decrease did not induce complete cell cycle arrest of breast cancer and other types of carcinoma cells [Citation6].
Our experiments with lung and colon carcinoma cell lines [Citation6] showed that active ERK1/2 could interact with γ-actin in neoplastic epithelial cells. Moreover, ERK1/2 activation lead not only to stimulation of cell proliferation, but also to alterations in β- and γ-actins levels, i.e. to reciprocal regulation. The present study was designed to investigate the molecular mechanisms involved in actin isoforms–dependent regulation of cancer cells proliferation. We studied an influence of individual actin isoforms alterations on activity of ERK1/2 MAP-kinases which play a key role in stimulation of cell proliferation [Citation31–Citation33] to understand possible mechanisms of growth suppression. According to our immunofluorescence labeling, confocal microscopy and PLA analysis, loss of γ-actin triggered a considerable increase of p-ERK1/2 in the nucleus and lamella. We have discovered previously that γ-actin predominance led to ERK1/2 activation. It was also found a direct ERK1/2 and γ-actin interaction [Citation6]. Activation of ERK1/2 kinases in response to activation of various oncogenes was observed in human cancers, so we assumed that γ-actin and ERK1/2 interaction may be important for proliferative features of carcinomas. We also discovered a direct interaction of ERK1/2 with γ-actin and cyclin A2 in the same protein complex. Possible interaction of γ-actin with cyclins B1 and D3, as well as regulation of their expression by down-regulation of β-actin isoform were shown. Due to γ-actin interaction with p-ERK1/2 it acts as a scaffold for a “proliferation signaling complex” assembly. As for lung and colon cancer [Citation6], here we discovered a new role of γ-actin in tumorigenesis: γ-actin isoform predominance enhances the probability of the interactions, necessary for mitogenic signaling in breast cancer cell lines. However, strong down-regulation of β-actin blocks G2/M phase and cell cycle progression, reducing late cyclins. ERK1/2 activation throughout G1 is required for cell proliferation to proceed [Citation33,Citation34], especially as direct activation of ERK1/2 leads to its oncogenic role [Citation35].
In conclusion, we demonstrated the role of β-actin in later mitotic stages and G1 more than in G2/M, as β-actin depletion caused delay in G2/M progression and led to accumulation of poly-nucleated cells. γ-Actin depletion also caused proliferation block. Unlike β-actin depletion, γ-actin depletion caused a dramatic cell cycle delay in G1 phase. It is interesting to note, that down-regulation of γ-actin stimulated cyclins E1, H1 (and D1, not shown) in our experiments with MDA-MB-231 cells. This type of cell cycle delay had been described by other research groups. Whereas cyclins A2 and B1 were down-regulated during irreversible G1 delay, D- and E-type cyclins were expressed at a high level, and cyclin D1 was proposed as a marker of senescent cells [Citation36–Citation38]. Future experiments will reveal the main mechanism of cell cycle regulation by β- or γ-actin or corroborate multiple mechanisms.
Materials and methods
Cell lines
Human breast adenocarcinoma MCF-7 cell line (ATCC® HTB22™) and human breast cancer MDA-MB-231 cell line (ATCC® HTB-26™) were used. For MCF-7 cells Eagle’s MEM (11-040-1, Biological Industries) supplemented with European Grade 10% FBS (04-007-1A, Biological Industries) and 20 µg/ml gentamicin (03-035-1B, Biological Industries), as for MDA-MB-231 cells high glucose D-MEM (11-055-1, Biological Industries) supplemented with the same 10% FBS and 20 µg/ml gentamicin were used. Both cell lines were incubated temperature at 37°C in humidified, concentrated CO2 (5%) atmosphere. 0.05%Trypsin/0.02%EDTA in DPBS solution (03-054-1A, Biological Industries) as detaching agent was used.
Viral cell infection
pLKO.1 lentiviral DNA constructs together with the pΔR8.2 (#12263, Addgene) and pVSV-G (#8454, Addgene) packaging plasmids were transfected into 293FT packaging cells (R70007, ThermoFisher) using TurboFect Transfection Reagent (R0531, Thermo Scientific). Virus-containing supernatants were collected 24 to 48 h after transfection and used to infect the recipient cells in the presence of 8 μg/mL polybrene (SIGMA). Infected cell cultures were selected for 4–5 days in medium containing 1 µg/mL puromicin (SIGMA) for pLKO.1-puro constructs. All experiments were performed 4–6 days after vector-mediated gene transfer.
DNA constructs
Previously selected and verified [Citation6] for MCF7 and MDA-MB-231 cells β- and γ-actins specific siRNA-expressing constructs were used. Briefly, for β- and γ- actins si-dependent repression 21 nt target sequences 5´-CAAATATGAGATGCGTTGTTA-3´ corresponding to 1465–1475 of β-actin mRNA ref|NM_001101.3| and 5´-CAGCAACACGTCATTGTGTAA-3´ corresponding to 2057–2077 of γ-actin mRNA ref|NM_001199954.1 included in hairpin structures were cloned into pLKO.1 (SIGMA) lentiviral vector. pLKO.1-shGFP-puro targeting eGFP (GenBank Accession No.pEGFP U55761) was used as a control. To prove of β- and γ- actins mRNAs repression caused by si-RNA expression, total mRNA was isolated with SV Total RNA Isolation System (Promega) according to the manufacturer’s protocols and mRNA amounts of β- and γ-actin by routine PCR were tested. The following primers were used: β-actin forward 5´-ACAGAGCCTCGCCTTTGC-3´, reverse 5´GAGGCGTACAGGGATAGCAC-3´; γ-actin forward 5´-CAAAAGGCGGGGTCGCAA-3´, reverse 5´-TGGGGTACTTCAGGGTCAGG-3´; α-tubulin forward 5´GTTGGTCTGGAATTCTGTCAG-3´, reverse 5´-AAGAAGTCCAAGCTGGAGTTC-3´. The quantification of mRNA bands was performed using Chemi-Smart 3000 Imaging System (Vilber Lourmat) and TotalLab v.2.01 software (data not shown). Oligonucleotides synthesis and DNA sequencing was performed by Evrogen (www.evrogen.com). Further, actin isoforms specific repression was tested by western-blot analysis.
Cell cultures growth rate
2,5 × 10⁴ MCF-7 and MDA-MB-231 cells were seeded into 6-well plates at 2 d after infection and cell count was performed each 24 h using the hemocytometer (three wells per time point). The measurement proceeded till 6 d.
Cell cycle analysis
After 4 d of β- or γ-actin depletion by corresponding shRNAs MCF-7 and MDA-MB-231 cells were collected for cell cycle analysis. The cells were harvested, washed with PBS and fixed with ice-cold 80% ethanol (wash cells with PBS, resuspend cell pellet (1 × 10⁶ to 1 × 10⁷) in 0.5 ml PBS, add 9,5 ml of ice-cold 80% ethanol) incubated overnight at 4°C and stored at −20°C until analyzed by flow cytometry. Briefly, the cells were spun down to remove the ethanol, washed with PBS and stained with 30 µg/ml Propidium Iodide (MP Biomedicals, France) and 10 ng/ml RNase A (Fermentas/Thermo Scientific, USA) in PBS for 45 min at 37°C in the dark. Cells were analyzed using Beckman Coulter Cytomics FC500 flow cytometer and cell cycle distribution was analyzed with ModFit LT (Verity Software House) software.
The percentage of mitotic cells in different mitotic phases was analyzed by cellular staining for DNA by DAPI. Increase/decrease of the percentage was observed by microscopic analysis of DAPI-stained cells by scoring cells with condensed chromosomes (mitotic) in β – or γ–actin depleted cells.
Western blot analysis
Whole cell extracts were lysed in ice-cold RIPA buffer (50 mM Tris-HCl pH 7.4, 150 mM NaCl, 1% deoxycholate Na, 1% NP-40, 0.1% SDS, 100 mM PMSF, 1 mM pepstatin A and 1 mM E64). Protein concentration in the extracts was determined with a protein assay system (BioRad). 5–20 µg of protein was separated on 8–12% SDS polyacrylamide gel and transferred to PVDF membrane (IPFL00010, Millipore). The membranes were blocked with SuperBlock Blocking Buffer (Thermo Scientific) and then probed with antibodies specific to corresponding proteins. Membranes were treated with Alexa488-conjugated secondary antibodies (A11029, Invitrogen), band detection was performed using variable mode imager Typhoon9410 (GE Healthcare).
Detergent extraction
Equal amounts of cells were washed with HBSS buffer containing MgCl2 and CaCl2. Then cells were covered with minimal volume of HBSS buffer containing 0,05% or 0,02% detergent Triton-X-100 for 1 min with gentle shaking. Supernatants were collected and diluted with 2xGLB buffer. Residuary cells also were lysed in GLB buffer. Tubulin detection in obtained lysates was analyzed using western blot analysis.
Immunoprecipitation
For co-immunoprecipitation assay cells washed with PBS were lysed in ice-cold Pierce IP buffer (25 mM Tris-HCl pH7.4, 150 mM NaCl, 1 mM EDTA, 1% NP-40, 5% glycerol) with proteases and phosphatases inhibitors (Roche). Lysates were cleared by 10 min centrifugation at 12000 g. Overnight precipitation was performed with 2 µg of mouse monoclonal antibodies to ERK1/2 (4695, Cell Signaling), isotype specific antibodies (3900, Cell Signaling) at the same concentration were used as negative IP control. 500 µg of cell lysates pre-cleaned with normal horse serum and 50 µl of 50% Protein a/g Agarose (Invitrogen). Agarose beads were washed 5 times with IP buffer with centrifugation at 2000 g and boiled in SDS-loading buffer. Not precipitated lysate aliquots were used as loading control.
Antibodies
Mouse monoclonal antibodies to: β-actin (MCA5775GA, AbD Serotec); γ-actin (MCA5776GA, AbD Serotec); pan actin (4968, Cell Signaling); α-tubulin (2144, Cell Signaling); p-p44/42 (T202/Y204) (4370, Cell Signaling); ERK1/2 (4695, Cell Signaling); cyclin A2 (4656, Cell Signaling); cyclin D3 (2936, Cell Signaling); cyclin E1 (4129, Cell Signaling). Rabbit monoclonal antibodies: cyclin B1 (4138, Cell Signaling); cyclin D1 (2978, Cell Signaling); cyclin E2 (4132, Cell Signaling); cyclin H (2927, Cell Signaling).
The following secondary antibodies were used: AlexaFluor488-, AlexaFluor594, AlexaFluor647- conjugated goat anti-mouse IgG, IgG1, IgG2b and goat anti-rabbit IgG (Jackson ImmunoResearch Laboratories. Inc).
Immunofluorescence and confocal laser scanning microscopy
Cells were grown on cover slips, rinsed with DMEM containing 20 mM Hepes at 37°C, fixed in 1% PFA in pre-warmed DMEM/Hepes for 15 min and treated for 5 min with MeOH at −20°C. Cells were incubated with primary and secondary antibodies. DAPI (Life technologies) was applied for nuclear staining. Immunofluorescence was observed using Axioplan microscope with 100×/1.3 Plan-Neofluar lenses (Carl Zeiss). Immunofluorescent images were also acquired using AxioVision software (Carl Zeiss Imaging Systems). Confocal images were acquired using scanning laser confocal microscope with 405 nm 5 mW, 488 nm 10 mW, 555 nm 10 mW, 639 nm 5 mW lasers (LSM700, Zeiss, Oberkochen, Germany) equipped with oil immersion objective “Plan-Apochromat” 63×/1.4 (Zeiss) and image software (Zen 2011, Carl Zeiss MicroImaging GHBH, Jena, Germany). Single optical sections were scanned with ~1 μm thickness near the basal level of the cell or at the nuclear level.
In situ proximity ligation assay (PLA)
The assay was conducted according to manufacturer’s instructions (Sigma-Aldrich). In brief, PFA methanol-fixed cells were incubated with pairs of primary antibodies (e.g. cyclin-B1/γ-actin, cyclin-B1/β-actin, p-p44/42/γ-actin or β-actin), washed and incubated with secondary antibodies conjugated with oligonucleotides (PLA probe MINUS and PLA probe PLUS). A proximity-dependent ligation and synthesis of an amplifiable DNA reporter molecule followed. Amplification of the reporter molecule was established via rolling circle amplification and the resulting rolling circle products (dots) were visualized by hybridization with a complementary fluorescence-labeled oligonucleotide probe. The signal was visualized with fluorescent microscopy. Immunofluorescence images of pERK1/2/γ-actin PLA dots at nuclear and lamellar (red) z-levels were used for cells with down-regulated β- or γ-actins. Images from nuclear z-levels were put into green channel, whereas images from lamellar z-levels were put into red channel of RGB figure for the same cell. Relative amount of PLA dots at nuclear (green) and lamellar (red) z-levels were calculated.
Statistical analysis
Data obtained were analyzed statistically with Image J 1,37C (NIH, http://rsb.info.nih.gov/ij/). Statistical analysis was done with unpaired Student’s t tests, and data are expressed as Mean ± SEM as indicated in figure legends. P values (*) ≤ 0.05 and (**) ≤ 0.01 were considered as significant. All the experiments were performed for at least three times.
Supplemental Material
Download Zip (236.5 KB)Disclosure statement
No potential conflict of interest was reported by the authors.
Supplementary material
Supplemental data for this article can be accessed here.
Additional information
Funding
Related Research Data
References
- Euteneuer U, Schliwa M. Evidence for an involvement of actin in the positioning and motility of centrosomes. J Cell Biol. 1985;101:96–103.
- Heng Y-W, Koh C-G. Actin cytoskeleton dynamics and the cell division cycle. Int J Biochem Cell Biol. 2010;42:1622–1633.
- Lancaster OM, Baum B. Shaping up to divide: coordinating actin and microtubule cytoskeletal remodelling during mitosis. Semin Cell Dev Biol. 2014;34:109–115.
- Po‘Uha ST, Kavallaris M. Gamma-actin is involved in regulating centrosome function and mitotic progression in cancer cells. Cell Cycle. 2015;14:3908–3919.
- Dugina V, Zwaenepoel I, Gabbiani G, et al. Beta and gamma-cytoplasmic actins display distinct distribution and functional diversity. J Cell Sci. 2009;122:2980–2988.
- Dugina V, Khromova N, Rybko V, et al. Tumor promotion by γ and suppression by β non-muscle actin isoforms. Oncotarget. 2015;6:14556–14571.
- Bunnell TM, Ervasti JM. Delayed embryonic development and impaired cell growth and survival in Actg1 null mice. Cytoskeleton (Hoboken). 2010;67:564–572.
- Shum MSY, Pasquier E, Po’uha ST, et al. γ-Actin regulates cell migration and modulates the ROCK signaling pathway. FASEB J. 2011;25:4423–4433.
- Lechuga S, Baranwal S, Li C, et al. Loss of γ-cytoplasmic actin triggers myofibroblast transition of human epithelial cells. Mol Biol Cell. 2014;25:3133–3146.
- Tondeleir D, Lambrechts A, Müller M, et al. Cells lacking β-actin are genetically reprogrammed and maintain conditional migratory capacity. Mol Cell Proteomics. 2012;11:255–271.
- Dugina V, Alieva I, Khromova N, et al. Interaction of microtubules with the actin cytoskeleton via cross-talk of EB1-containing +TIPs and γ-actin in epithelial cells. Oncotarget. 2016;7:72699–72715.
- Lyubimova A, Bershadsky AD, Ben-Ze’ev A. Autoregulation of actin synthesis requires the 3ʹ-UTR of actin mRNA and protects cells from actin overproduction. J Cell Biochem. 1999;76:1–12.
- Söderberg O, Gullberg M, Jarvius M, et al. Direct observation of individual endogenous protein complexes in situ by proximity ligation. Nat Methods. 2006;3:995–1000.
- Weibrecht I, Leuchowius K-J, Clausson C-M, et al. Proximity ligation assays: a recent addition to the proteomics toolbox. Expert Rev Proteomics. 2010;7:401–409.
- Hanahan D, Weinberg RA. Hallmarks of cancer: the next generation. Cell. 2011;144:646–674.
- Brunet A, Roux D, Lenormand P, et al. Nuclear translocation of p42/p44 mitogen-activated protein kinase is required for growth factor-induced gene expression and cell cycle entry. Embo J. 1999;18:664–674.
- Hanahan D, Weinberg R. The hallmarks of cancer. Cell. 2000;100:57–70.
- Sherr CJ. Cancer cell cycles. Science. 1996;274:1672–1677.
- Malumbres M, Barbacid M. Cell cycle, CDKs and cancer: a changing paradigm. Nat Rev Cancer. 2009;9:153–166.
- Pines J, Hunter T. Human cyclins A and B1 are differentially located in the cell and undergo cell cycle-dependent nuclear transport. J Cell Biol. 1991;115:1–17.
- Bukholm IRK, Bukholm G, Nesland JM. Over-expression of cyclin a is highly associated with early relapse and reduced survival in patients with primary breast carcinomas. Int J Cancer. 2001;93:283–287.
- Husdal A, Bukholm G, Bukholm IRK. The prognostic value and overexpression of cyclin A is correlated with gene amplification of both cyclin A and cyclin E in breast cancer patient. Cell Oncol. 2006;28:107–116.
- Sun X, Zhangyuan G, Shi L, et al. Prognostic and clinicopathological significance of cyclin B expression in patients with breast cancer. Medicine (Baltimore). 2017;96:e6860.
- Clute P, Pines J. Temporal and spatial control of cyclin B1 destruction in metaphase. Nat Cell Biol. 1999;1:82–87.
- Morgan DO. Principles of CDK regulation. Nature. 1995;374:131–134.
- Baldin V, Ducommun B. Subcellular localisation of human wee1 kinase is regulated during the cell cycle. J Cell Sci. 1995;108:2425–2432.
- Ohi R, Gould KL. Regulating the onset of mitosis. Curr Opin Cell Biol. 1999;11:267–273.
- McGowan CH, Russell P. Cell cycle regulation of human WEE1. Embo J. 1995;14:2166–2175.
- Mueller PR, Coleman TR, Kumagai A, et al. Myt1: a membrane-associated inhibitory kinase that phosphorylates Cdc2 on both threonine-14 and tyrosine-15. Science. 1995;270:86–90.
- Lew DJ, Kornbluth S. Regulatory roles of cyclin dependent kinase phosphorylation in cell cycle control. Curr Opin Cell Biol. 1996;8:795–804.
- Dhillon AS, Hagan S, Rath O, et al. MAP kinase signalling pathways in cancer. Oncogene. 2007;26:3279–3290.
- Roberts PJ, Der CJ. Targeting the Raf-MEK-ERK mitogen-activated protein kinase cascade for the treatment of cancer. Oncogene. 2007;26:3291–3310.
- Yamamoto T, Ebisuya M, Ashida F, et al. Continuous ERK activation downregulates antiproliferative genes throughout G1 phase to allow cell-cycle progression. Curr Biol. 2006;16:1171–1182.
- Jones SM, Kazlauskas A. Growth-factor-dependent mitogenesis requires two distinct phases of signalling. Nat Cell Biol. 2001;3:165–172.
- Smorodinsky-Atias K, Goshen-Lago T, Goldberg-Carp A, et al. Intrinsically active variants of Erk oncogenically transform cells and disclose unexpected autophosphorylation capability that is independent of TEY phosphorylation. Mol Biol Cell. 2016;27:1026–1039.
- Leontieva OV, Blagosklonny MV. CDK4/6-inhibiting drug substitutes for p21 and p16 in senescence: duration of cell cycle arrest and MTOR activity determine geroconversion. Cell Cycle. 2013;12:3063–3069.
- Leontieva OV, Natarajan V, Demidenko ZN, et al. Hypoxia suppresses conversion from proliferative arrest to cellular senescence. Proc Natl Acad Sci U S A. 2012;109:13314–13318.
- Geng Y, Sicinski P. Differences in regulation and function of E-cyclins in human cancer cells. Cell Cycle. 2013;12:1165.