
ABSTRACT
The acidic extracellular microenvironment, namely acidosis, is a biochemical hallmark of solid tumors. However, the tumorigenicity, metastatic potential, gene expression profile and chromatin accessibility of acidosis-adapted colorectal cancer cells remain unknown. The colorectal cancer cell SW620 was cultured in acidic medium (pH 6.5) for more than 3 months to be acidosis-adapted (SW620-AA). In comparison to parental cells, SW620-AA cells exhibit enhanced tumorigenicity and liver metastatic potential in vivo. Following mRNA and lncRNA expression profiling, we validated that OLMF1, NFIB, SMAD9, DGKB are upregulated, while SESN2, MAP1B, UTRN, PCDH19, IL18, LMO2, CNKSR3, GXYLT2 are downregulated in SW620-AA cells. The differentially expressed mRNAs were significantly enriched in DNA remodeling-associated pathways including HDACs deacetylate histones, SIRT1 pathway, DNA methylation, DNA bending complex, and RNA polymerase 1 chain elongation. Finally, chromatin accessibility evaluation by ATAC-sequencing revealed that the differentially opened peaks were enriched in pathways such as small cell lung cancer, pathways in cancer, ErbB signaling, endometrial cancer, and chronic myeloid leukemia, which were mainly distributed in intergenic regions and introns. These results suggest that the chromatin accessibility changes are correlated with enhanced growth and liver metastasis capacity of acid-adapted colorectal cancer cells.
Introduction
Colorectal cancer (CRC) is the third most common cancer and the fourth leading cause of tumor associated death in the world [Citation1]. The five-year survival rate of CRC patients remains about 50%. The majority of CRC-related death is caused by distant metastasis, and the five-year survival rate of patients with distant metastasis reduces to 10–20% [Citation1]. Liver is the most common target organ of CRC metastasis. Accumulating evidence proved that tumor microenvironment plays a critical role in the development and progression of tumors [Citation2]. The aerobic glycolysis and poor vasculature makes the extracellular fluid of solid tumors acidic, with the pH value of the extracellular fluid dropping from 7.2–7.4 in the physiological state to 6.2–6.9 in solid tumors [Citation2,Citation3]. The acidic extracellular microenvironment, namely acidosis, is a biochemical hallmark of cancer [Citation4]. At present, acidosis contributes to the genetic instability of tumor cells and profoundly changes their transcriptomic profiles, leading to phenotypes that are particularly suitable for survival, growth, and even metastasis in the acidic environment [Citation5].
Both the acute effect and chronic effect of acidosis on tumor biology has been revealed by recent works. Acidic priming for a short time can enhance metastatic potential of rat prostate cancer cells [Citation6] and melanoma cells [Citation7,Citation8]. Acute acidosis exposure has also been reported to promote evasion of apoptosis of lymphoma cells [Citation9], induce autophagy of breast cancer cells [Citation10], and enhance invasion of CRC cells [Citation11]. In addition, acute acidosis exposure can promote the stemness of glioma cells in vitro, and facilitate tumor growth in orthotopic transplantation model [Citation12]. Chronic acidosis elicits a selection pressure for cancer cell somatic evolution in a Darwinian manner. Estrella and colleagues found that the regions of highest tumor invasion correspond to most acidic areas using intravital microscopy [Citation13]. Although the proliferation of breast cancer cells is inhibited by acute acidic exposure, acid-adapted breast cancer cells restore their proliferative capacity with elevated autophagy [Citation10]. Consistently, the acid-adapted cervical cancer SiHa cells, pharynx cancer FaDu cells and CRC HCT116 cells grew at the same rate under acidic environment as their parental cells do in normal medium, but these acid-adapted cells prefer glutamine metabolism [Citation14]. One recent work by the same group show that the mitochondrial proteins are hyperacetylated in these acid-adapted cells due to a metabolism shift from glucose metabolism to fatty acid catabolism [Citation15]. The acidic-adapted pancreatic cancer cells also tend to take advantage of glutamine to fuel the respiration [Citation16]. Furthermore, it has been reported that the acid-adapted breast cancer cells grow faster in vivo and exhibit invasive phenotype [Citation17].
Although we have previously demonstrated that acute acidosis enhanced the invasion of CRC cells, the tumorigenicity, metastatic capacity, gene expression profile and chromatin accessibility of acid-adapted CRC cells have yet to be explored. In the present study, CRC cells were cultured in acidic medium (pH 6.5) for more than 3 months to be acidosis-adapted. We found that acid-adapted SW620 cells (SW620-AA) cells exhibit enhanced tumorigenicity and metastatic potential in vivo. The mRNA and lncRNA expression profiling showed that the differentially expressed mRNAs in SW620-AA cells were mainly enriched in DNA remodeling-associated pathways. Following gene expression profiling, we validated that MARCKS, VEPH1, LPHN2, OLMF1, NFIB, SMAD9, DGKB are upregulated, while PTHLH, SESN2, CD24, MAP1B, CALB, ITPR2, GRB10, UTRN, PCDH19, IL18, ATF3, CCL20, LMO2, ENC1, CNKSR3, GXYLT2 are downregulated in SW620-AA cells. Finally, chromatin accessibility of SW620-AA cells was evaluated by ATAC-seq. The results revealed that the differentially opened peaks, which were mainly distributed in intergenic regions and introns, were enriched in pathways such as small cell lung cancer, pathways in cancer, ErbB signaling. All together, these results suggest that the enhanced growth and liver metastasis capacity of SW620-AA cells correlates with chromatin accessibility changes.
Results
Enhanced growth of acid-adapted SW620 cells in vivo
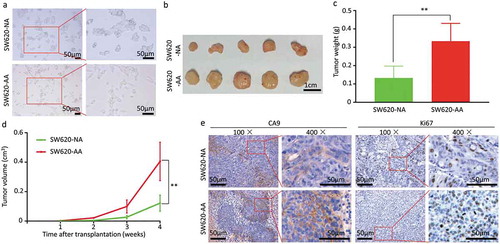
The SW620 cells were cultured in acidic medium (pH 6.5) for more than three months to be acid-adapted. The acid-adapted and none-adapted SW620 cells were respectively named as SW620-AA and SW620-NA. In line with a previous study [Citation18], we failed to get acid-adapted SW480 cells as SW480 proliferates very slowly under acidic environment. As shown in , SW620-NA cells presented with spindle-shaped adherent growth, while the SW620-AA cells presented with elongated spindle shape. To evaluate the tumorigenicity of SW620-AA and SW620-NA cells, both of them were subcutaneously transplanted to nude mice. The images of the tumors were shown in . The tumors originated from SW620-AA cells were significantly heavier than those from SW620-NA cells (). The growth curve of the tumors showed that the SW620-AA originated tumors grown faster than SW620-NA originated tumors (). The Ki67 and CA9 were respectively applied to reflect the proliferation index and the acidic environment in the tumors in IHC staining [Citation19]. Although the CA9-positive acidic areas in SW620-AA originated tumors were larger than SW620-AA originated tumors (, left panel), the proliferation index was higher in SW620-AA originated tumors (, right panel). These results reveal that the tumorigenicity of SW620-AA cells was dramatically enhanced compared with SW620-NA cells.
Figure 1. Enhanced growth of acid-adapted SW620 cells in vivo (a) The morphology of SW620-NA and SW620-AA cells. (b) The images of subcutaneous xenografts originated from SW620-NA and SW620-AA cells. (c) Comparison of tumor weight between SW620-NA and SW620-AA group using student’s t-test. (d) Tumor growth curves of SW620-NA and SW620-AA group. (e) Representative images showing immunohistochemical staining of Ki67 and CA9 in xenografts. Scale bar: 50μm if not indicated. *, <0.05; **,<0.01
Increased invasion and liver metastasis capacity of acid-adapted SW620 cells
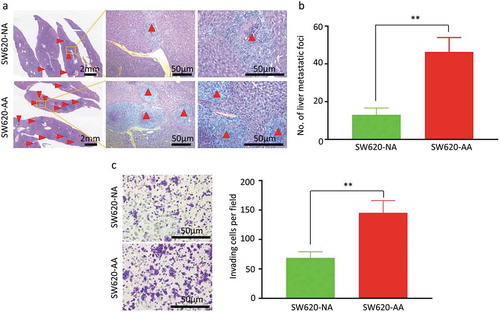
As the morphological change of SW620-AA cells shown in implied that these cells might have more invasive and metastatic potential. We then evaluated the invasion capacity in the Transwell invasion assay and the metastasis capacity in the spleen-xenografted model. Representative images of the liver metastatic foci were showed in . The metastatic foci from both SW620-AA cells and SW620-NA cells contain typical necrotic lesions without stromal response. The SW620-AA cells resulted in more liver metastatic foci than SW620-NA cells (). Consistently, the SW620-AA cells exhibited stronger invasion capacity in the cell invasion assay (). These results demonstrated that the SW620-AA cells exhibited stronger invasion and metastasis capacity than SW620-NA cells.
Figure 2. Increased invasion and liver metastasis of acid-adapted SW620 cells (a) Representative images showing the liver metastatic foci from SW620-NA and SW620-AA group. (b) Analysis of the number of metastatic foci by student,s t-test. (c) Representative image showing the invaded cells. (d) Analysis of the number of cells per fied by student,s t-test. *, <0.05;**,<0.01
The differentially expressed mRNAs in acid-adapted SW620 cells are associated with DNA remodeling
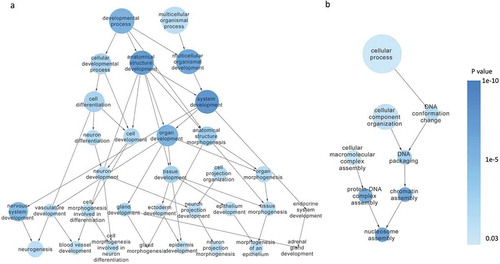
To explore the molecular difference between SW620-AA and SW620-NA cells, the mRNA and lncRNA expression profile was determined by the mRNA+lncRNA expression microarray. There were 1389 mRNAs that were up-regulated and 1650 mRNAs that were down-regulated in SW620-AA cells (). The expression of the top 23 deregulated mRNAs which are associated with tumor biology (PTHLH, SESN2, CD24, MAP1B, CALB, ITPR2, GRB10, UTRN, PCDH19, IL18, ATF3, CCL20, LMO2, ENC1, CNKSR3, GXYLT2, MARCKS, VEPH1, LPHN2, OLMF1, NFIB, SMAD9, DGKB) was further validated with RT-PCR. Twenty-two mRNAs were validated to have the same change trend with the microarray results among the 23 mRNAs with MARCKS as the only exception (). Disease enrichment analysis showed that the significant differentially expressed mRNAs were associated with solid tumors such as prostate cancer, stomach cancer, hepatocellular carcinoma and adenocarcinoma (). These mRNAs were then subjected to KOBAS analysis. Moreover, the top15 significant enriched GO terms included DNA bending complex, nucleosome, DNA replication−dependent nucleosome organization, DNA replication−dependent nucleosome assembly, DNA packaging complex, DNA methylation on cytosine (). The top15 significant enriched pathway terms included RMTs methylate histone arginines, HDACs deacetylate histones, HDMs demethylate histones, SIRT1 negatively regulates rRNA Expression, RNA Polymerase I Promoter Opening, DNA methylation, PRC2 methylates histones and DNA, Condensation of Prophase Chromosomes, RNA Polymerase I Chain Elongation (). Hierarchical analysis showed that the differentially expressed mRNAs were enriched in development process and DNA confirmation changes (). These results demonstrated that the differentially expressed mRNAs between SW620-AA cells and SW620-NA cells are associated with remodeling of DNA structure.
Figure 3. Gene expression profiling of acid-adapted SW620 cells (a) Volcano plot showing the gene expression profile of SW620-NA and SW620-AA cells. (b) Validation of the differential expression genes in SW620-NA and SW620-AA cells by RT-PCR. (c) David disease enrichment analysis of the differential genes. (d) The top 15 significant enriched Go terms of the differential genes. (e) The top 15 significant enriched Pathway terms of the differential genes
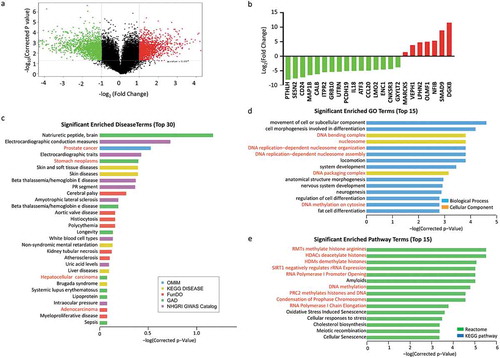
Figure 4. Hierarchical analysis of the differentially expressed mRNAs Hierarchical analysis showed that the differentially expressed mRNAs were significantly enriched in developmental process (a) and DNA conformation changes (b)
Target prediction of deregulated mRNA/lncRNA pairs in acid-adapted SW620 cells
The lncRNA expression profile showed that 5564 up-regulated lncRNAs and 2344 down-regulated lncRNAs in SW620-AA cells (). The significant correlated mRNA/lncRNA pairs were screened with the criterion: correlation coefficient larger than 0.99 or smaller than −0.99. The significantly correlated mRNA/lncRNA pairs among which the mRNAs were validated by RT-PCR as mentioned above were shown in . The significant correlated mRNA/lncRNA pairs were then subjected to target prediction. Target prediction was carried out by cis-prediction and trans-prediction. Cis-prediction aims to screen mRNA/lncRNA pairs whose genomic location interval was less than 10kb. Trans-prediction aims to screen mRNA/lncRNA pairs which have similar sequence. The top 20 predicted mRNA/lncRNA pairs in which the mRNA might be the target of the lncRNA according to the fold change of mRNA were listed in . These results reveal that the lncRNA expression profile of SW620-AA cells was also remarkably different from SW620-NA cells and provide the potential targets of deregulated lncRNAs.
Chromatin accessibility changes of acid-adapted SW620 cells
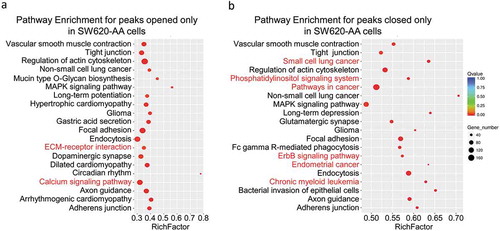
As mentioned in , the deregulated mRNAs between SW620-AA and SW620-NA cells were associated with remodeling of DNA structure. Chromatin accessibility, or the genome-wide accounting of loci accessible for transcription factor binding, has been identified as perhaps the single most relevant genomic characteristic correlated with biological activity at a specific locus [Citation20]. Assay for transposase accessible chromatin-sequencing (ATAC-seq) is a novel technique to efficiently map the chromatin accessibility genome-wide using Tn5 transposase [Citation21]. The SW620-AA and SW620-NA cells were subsequently subjected to ATAC-seq. There are 10,671 peaks detected only in SW620-AA cells, 22,681 peaks detected only in SW620-NA cells, and 5005 common peaks in both cells. In consistence with the mRNA expression profile results, the upregulated DGKB gene region was only opened in SW620-AA cells, and the downregulated PCDH19, CNKSR3, GXYLT2, IL8, UTRN gene regions were closed in SW620-AA cells (). The differentially opened peaks were mainly distributed in intergenic regions and introns (). Homer known motif enrichment for detected peaks showed that the peaks unique for SW620-AA cells might bind with NFY, Sp-1, Jun-AP1, and Fosl transcription factors (), while the peaks unique for SW620-NA cells might bind with Bach2, CTCF, Jun-AP1, and Fosl transcription factors (). The genes which are associated with SW620-AA-specific peaks were mainly enriched in pathways such as tight junction, regulation of actin cytoskeleton, MAPK signaling pathway, ECM-receptor interaction, calcium signaling pathway (). On the other hand, the genes which are associated with SW620-NA-specific peaks were mainly enriched in pathways such as small cell lung cancer, phosphatidylinositol signaling system, pathways in cancer, and ErbB signaling pathway (). Taken together, these results reveal the remarkable changes in chromatin accessibility between SW620-AA and SW620-NA cells.
Figure 5. Target prediction of deregulated mRNA/lncRNA pairs in acid-adapted SW620 cells (a) Volcano plot showing the lncRNA expression profile in SW620-NA and SW620-AA cells. (b) The significantly correlated mRNA/lncRNA pairs among which the mRNAs were validated by RT-PCR to be dramatically deregulated. (c) The top 20 predicted mRNA/lncRNA pairs in which the mRNA might be the target of the lncRNA according to the fold change of mRNA
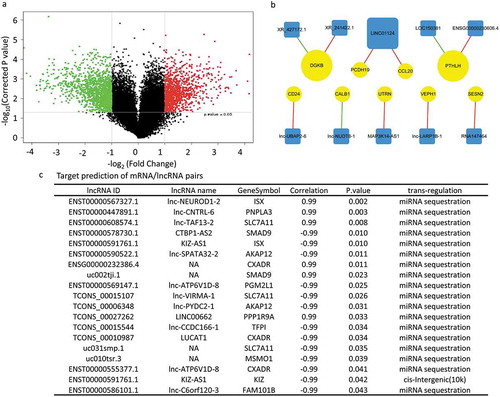
Figure 6. Chromatin accessibility changes of acid-adapted SW620 cells The SW620-NA and SW620-AA cells were subjected to ATAC-seq. The differential peaks were then analyzed. (a) The upregulated DGKB gene region is only opened in SW620-AA cells, and the downregulated PCDH19, CNKSR3, GXYLT2, IL8, UTRN gene regions were closed in SW620-AA cells. (b) Distribution of peaks only opened in SW620-AA cells, only opened in SW620-AA cells, and the peaks without changes. (c) Homer known motif enrichment for peaks detected in SW620-AA cells. The top 10 enriched transcription factors were listed. (d) Homer known motif enrichment for peaks detected in SW620-NA cells. The top 10 enriched transcription factors were listed
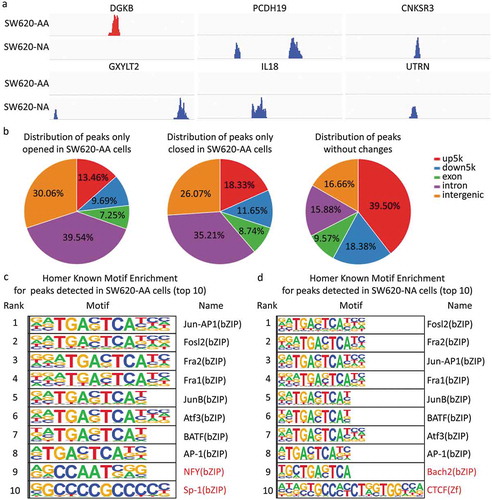
Figure 7. Pathway Enrichment for detected peaks (a) Pathway enrichment for the peaks opened only in SW620-AA cells. (b) Pathway enrichment for peaks opened only in SW620-NA cells
Discussion
Acidosis, a biochemical hallmark of solid tumors, plays essential role in tumor progression. The effects of acidosis on solid tumors can be summarized as follows: 1) promoting cell invasion and metastasis; 2) inducing autophagy and reducing apoptosis; 3) leading to metabolism shift; 4) enhancing angiogenesis [Citation22,Citation23]; 5) favoring escape from immune surveillance; 6) stimulating resistance to radiotherapy or chemotherapy [Citation24]. Moreover, the acidic environment of solid tumors has recently been proposed to provide a niche for dormant cells based on these features [Citation24]. The present study showed that the acid-adapted SW620 cells have stronger tumorigenicity in subcutaneous transplantation model, which is consistent with a previous study showing that the acid adapted breast cancer cells grow faster in vivo [Citation17]. In addition to higher proliferating index, the SW620-AA-originated tumors showed high expression of CA9, reflecting more acidic areas in these tumors. It is reasonable to conclude that the SW620-AA cells are resistant to acidic environment in vivo. We then found that these acid-adapted cells form more liver metastatic foci than non-adapted cells using a spleen-xenografted model.
Following gene expression profiling, we validated that MARCKS, VEPH1, LPHN2, OLMF1, NFIB, SMAD9, DGKB are upregulated, while PTHLH, SESN2, CD24, MAP1B, CALB, ITPR2, GRB10, UTRN, PCDH19, IL18, ATF3, CCL20, LMO2, ENC1, CNKSR3, GXYLT2 are downregulated in SW620-AA cells. Among the upregulated genes, LPHN2 has been implied to induce cisplatin resistance in gastrointestinal cancer [Citation25]. The nuclear factor NFIB promotes metastasis of small cell lung cancer by inducing chromatin accessibility changes [Citation20,Citation26]. Among the repressed genes, LMO2 is significantly downregulated in CRC and breast cancer tissues, which inhibits cell proliferation and induces apoptosis through Wnt signaling [Citation27]. SESN2, a conserved antioxidant protein, is also downregulated in CRC tissues. Overexpression of SESN2 inhibited cell proliferation through AMPK/mTORC1 pathway [Citation28]. Moreover, GRB10 has been reported to inhibit growth of hepatocellular carcinoma by repressing the function of GPC3 [Citation29]. The expression of PCDH19, a member of the protocadherin family, is reduced in hepatocellular carcinoma tissues due to promoter hypermethylation [Citation30]. High expression of PCDH19 correlates with favorable prognosis [Citation30]. In addition, high expression of CNKSR3 associates with longer survival time of patients with melanoma [Citation31]. Moreover, we found that the lncRNA expression profile is significantly altered in SW620-AA cells. The exact role and underlying molecular mechanisms of these genes in the development and progression of CRC should be further demonstrated in the future work. We then found that these differentially expressed mRNAs are remarkably enriched in DNA remodeling-associated pathways, which tempted us to detect the chromatin accessibility by ATAC-seq. The results showed that the DGKB gene region is specifically opened in SW620-AA cells, and the gene regions of PCDH19, CNKSR3, GXYLT2, IL18, and UTRN are only opened in SW620-NA cells. The differentially opened peaks were mainly distributed in intergenic regions and introns, implying that epigenetic mechanisms might be involved in the gene expression changes. One main limitation of ATAC-seq analysis is how to determine the chromatin accessibility when one gene region contains some opened regions as well as some closed regions. It should be also noted that two unique peaks may reflect the same gene because one gene region may contain many detected peaks. As a result of these reasons, we found only 705 mRNAs that change as the way their chromatin accessibility does (data not shown).
Finally, the high tumor selectivity of acidosis compared with healthy tissues which are neutral reminds us that targeting acidosis will be safer than conventional chemotherapy and universal to many kinds of cancers [Citation2]. The results of one recent randomized clinical study were encouraging, showing that bicarbonate markedly enhanced the anticancer activity of transarterial chemoembolization for large hepatocellular carcinoma [Citation32]. This clinical research showed us that targeting the acidic environment might be a promising therapeutic method for cancer therapy. In our opinion, there are currently four strategies to target acidosis for cancer therapy: 1) interfering the pH-regulating system; 2) buffering the acidic environment with alkaline solution; 3) disturbing the proton-sensing system; 4) developing pH-sensing drugs. All together, the present study suggests that the chromatin accessibility changes are correlated with enhanced growth and liver metastasis capacity of acid-adapted CRC cells.
Materials and methods
Cell culture
The human CRC cell line SW480 and SW620 was obtained from the American Type Culture Collection. The SW480 originates from the primary CRC, and the SW620 originates from the lymph node metastatic foci of the same patient. The cells were maintained in Dulbecco’s Modified Eagle Medium (DMEM; Gibco, Carlsbad, CA), supplemented with 10% fetal bovine serum (FBS; Gibco, Carlsbad, CA), 2 U/mL penicillin-streptomycin, vitamins, 1 mmol/L sodium pyruvate, 2 mmol/LL-glutamine, and nonessential amino acids (Thermo Scientific, Watertown, MA) at 37℃ in 5% CO2. The medium was further supplemented with 25Mm HEPES and PIPES (Solarbio, Beijing, China) and the pH was adjusted to 6.5. Both SW480 and SW620 cells were cultured in the acidic medium for more than three months to be acid-adapted.
RNA extraction and RT-PCR
Total RNA was extracted from cultured cells with Trizol Reagent (TaKaRa, Dalian, China). The concentration and integrity of extracted RNA was examined by UV spectrophotometer. The High Fidelity RNA PCR Kit and SYBR Primescript RT-PCR Kit were purchased from TaKaRa Biotech (Dalian, China). Primers for quantitative PCR were designed using Primer Premier 5.0 software according to the sequence data in the GeneBank. The primers used in this study were listed in Supplementary table 1. The results of three independent experiments were analyzed using the ΔΔC[t] method [Citation33].
LncRNA and mRNA microarray analysis
Total RNAs were isolated from cells using Trizol reagent (TaKaRa, China) and quantified by Nanodrop 2000 spectrophotometer and Qubit 3.0 fluorometer (Termo Scientific, USA). Their quality was also evaluated using Agilent 2100 Bioanalyzer and all RNA samples had RNA integrity numbers ≥8. The samples were then labeled with cy3 and hybridized to Capitalbio Agilent LncRNA + mRNA Human Gene Expression Microarray V4.0 microarray (CapitalBio, China). The differentially expressed mRNAs and lncRNAs were identified using GeneSpring software version 13.0 (Agilent, CA) after expression data of mRNAs and lncRNAs were filtered and normalized. The functional enrichment analysis was carried out using the KEGG Orthology Based Annotation System (KOBASS). In order to predict the potential regulatory effects of differentially expressed lncRNAs on mRNAs, an lncRNA-mRNA co-expression network was conducted by bioinformatics analysis.
Atac-seq assay
Assay for transposase accessible chromatin (ATAC) followed by sequencing was performed as following [Citation20].1 × 105 cells were collected and centrifuged. The cell pellets were resuspended in 50 mL of lysis buffer (Tris HCl 10mM, NaCl 10mM, MgCl2 3mM, Igepal 0,1%) and centrifuged for 25 min at 4°C. Nuclei were resuspended in 50 mL of reaction buffer (Tn5 transposase 2.5 mL, TD buffer 22.5 mL and 25 mL H2O – Nextera DNA sample preparation kit, Illumina) for 30 min at 37°C. DNA was purified using the MinElute purification kit (QIAGEN). Peaks were called on the merged set of all ex vivo ATAC-seq reads using MACS2 and filtered to remove putative copy number altered regions. Differential accessibility was assessed using DESeq2. Regions were called differentially accessible if the absolute value of the log2 fold change was 0.5 at an FDR <0.1. Peak-related genes were then subjected to KEGG and GO annotation, and Homer-motif analysis.
Cell invasion assay
The invasion of SW620 cells was evaluated in transwells (BD Falcon, Franklin Lakes, NJ). 2 × 10⁴ cells were seeded into MatrigelTM (BD Biosciences, Franklin Lakes, NJ)-coated upper chambers. After incubation for 24 hours at 37°C, the remaining cells left in the upper chamber were removed and the cells in the lower chambers were fixed and stained with crystal violet. The number of cells was counted in 5 distinct areas at ×400 magnification. The results represent the average cell number in 3 wells per cell line.
Animal models
All animal experiments were performed in accordance with Institutional Animal Care and Use Committee approved protocols. To evaluate the in vivo tumorigenic effects, 2.5 × 10⁵ SW620 cells were suspended in serum-free-DMEM/Matrigel mixture (1:1 volume) and injected subcutaneously into the back of BALB/c nude mice. After 4 wk, mice were euthanized, and xenografts were harvested and weighed. For in vivo liver metastasis assay, 1 × 10⁶ cells suspended in 50μL serum-free-DMEM/Matrigel mixture (1:1 volume) were injected into the distal tip of the spleen. The animals were euthanized after 4 wk, and the livers were dissected out and fixed with formalin for pathological examination. Sections (5-μm thickness) of the livers were made at 10 different layers to cover the entire organ and stained with hematoxylin and eosin (H&E). Metastatic nodules were counted under microscopy in a double-blinded manner.
Immunohistochemical staining
The procedure was described previously [Citation34]. Following deparaffinization and rehydration, tumor sections of 4 μm were incubated in 0.3% H2O2 in methanol for 30 minutes at 37°C to block endogenous peroxidase. The sections were then boiled in 10 mmol/L citrate buffer (pH 6.0) for 15 minutes in a microwave oven. The antibodies against CA9 or Ki-67 (MXB Biotechnologies, China) were added, and the sections were incubated at 4°C overnight. The sections were visualized using the diaminobenzidine solution (MXB Biotechnologies, China) and were then lightly counterstained with hematoxylin. Sections without incubation with primary antibody served as negative controls. The results were verified by two histopathologists independently.
Statistical analysis
All experiments were conducted at least three times and the results were from representative experiments. Data were expressed as mean values±standard deviation (SD), and the statistical significance between testing and control groups was analyzed with SPSS18.0 statistical software. When two groups were compared, the unpaired Student,s t-test was used. P value less than 0.05 was considered statistically significant.
Conflict of Interest
The authors declare no conflict of interest.
Supplemental Material
Download MS Word (14.3 KB)Acknowledgments
We thank for the unselfish help from Pro. Xiu-Wu Bian (Institute of Pathology and Southwest Cancer Center, Southwest Hospital, Third Military Medical University, China) and Pro. Feng Gong (Department of Tissue Engineering, Beijing Institute of Transfusion Medicine, Beijing, China).
Disclosure statement
No potential conflict of interest was reported by the authors.
Supplemental material
Supplemental data for this article can be accessed here.
Additional information
Funding
Related Research Data
References
- Ferlay J, Soerjomataram I, Dikshit R, et al. Cancer incidence and mortality worldwide: sources, methods and major patterns in GLOBOCAN 2012. Int J Cancer J Inter Du Cancer. 2015;136:E359–E86.
- Corbet C, Feron O. Tumour acidosis: from the passenger to the driver’s seat. Nat Rev Cancer. 2017;17:577–593.
- Wang L, Fan Z, Zhang J, et al. Evaluating tumor metastatic potential by imaging intratumoral acidosis via pH-activatable near-infrared fluorescent probe. Int J Cancer. 2015;136:E107–E16.
- Flinck M, Kramer SH, Schnipper J, et al. The acid-base transport proteins NHE1 and NBCn1 regulate cell cycle progression in human breast cancer cells. Cell Cycle. 2018;17:1056–1067.
- Chen JL, Lucas JE, Schroeder T, et al. The genomic analysis of lactic acidosis and acidosis response in human cancers. PLoS Genet. 2008;4:e1000293.
- Riemann A, Schneider B, Gundel D, et al. Acidic priming enhances metastatic potential of cancer cells. Pflugers Arch. 2014;466:2127–2138.
- Moellering RE, Black KC, Krishnamurty C, et al. Acid treatment of melanoma cells selects for invasive phenotypes. Clin Exp Metastasis. 2008;25:411–425.
- Rofstad EK, Mathiesen B, Kindem K, et al. Acidic extracellular pH promotes experimental metastasis of human melanoma cells in athymic nude mice. Cancer Res. 2006;66:6699–6707.
- Ryder C, McColl K, Zhong F, et al. Acidosis promotes Bcl-2 family-mediated evasion of apoptosis: involvement of acid-sensing G protein-coupled receptor Gpr65 signaling to Mek/Erk. J Biol Chem. 2012;287:27863–27875.
- Wojtkowiak JW, Rothberg JM, Kumar V, et al. Chronic autophagy is a cellular adaptation to tumor acidic pH microenvironments. Cancer Res. 2012;72:3938–3947.
- Zhou ZH, Song JW, Li W, et al. The acid-sensing ion channel, ASIC2, promotes invasion and metastasis of colorectal cancer under acidosis by activating the calcineurin/NFAT1 axis. J Exp Clin Cancer Res. 2017;36:130.
- Filatova A, Seidel S, Bogurcu N, et al. Acidosis acts through HSP90 in a PHD/VHL-independent manner to promote HIF function and stem cell maintenance in glioma. Cancer Res. 2016;76:5845–5856.
- Estrella V, Chen T, Lloyd M, et al. Acidity generated by the tumor microenvironment drives local invasion. Cancer Res. 2013;73:1524–1535.
- Corbet C, Draoui N, Polet F, et al. The SIRT1/HIF2alpha axis drives reductive glutamine metabolism under chronic acidosis and alters tumor response to therapy. Cancer Res. 2014;74:5507–5519.
- Corbet C, Pinto A, Martherus R, et al. Acidosis drives the reprogramming of fatty acid metabolism in cancer cells through changes in mitochondrial and histone acetylation. Cell Metab. 2016;24:311–323.
- Abrego J, Gunda V, Vernucci E, et al. GOT1-mediated anaplerotic glutamine metabolism regulates chronic acidosis stress in pancreatic cancer cells. Cancer Lett. 2017;400:37–46.
- Damaghi M, Gillies R. Phenotypic changes of acid-adapted cancer cells push them toward aggressiveness in their evolution in the tumor microenvironment. Cell Cycle. 2017;16:1739–1743.
- Zhao M, Liu Q, Gong Y, et al. GSH-dependent antioxidant defense contributes to the acclimation of colon cancer cells to acidic microenvironment. Cell Cycle. 2016;15:1125–1133.
- Pellegrini P, Strambi A, Zipoli C, et al. Acidic extracellular pH neutralizes the autophagy-inhibiting activity of chloroquine: implications for cancer therapies. Autophagy. 2014;10:562–571.
- Denny SK, Yang D, Chuang CH, et al. Nfib promotes metastasis through a widespread increase in chromatin accessibility. Cell. 2016;166:328–342.
- Buenrostro JD, Wu B, Chang HY, et al. ATAC-seq: a method for assaying chromatin accessibility genome-wide. Curr Protoc Mol Biol. 2015;109(1):21–29.
- Fukumura D, Xu L, Chen Y, et al. Hypoxia and acidosis independently up-regulate vascular endothelial growth factor transcription in brain tumors in vivo. Cancer Res. 2001;61:6020–6024.
- Peppicelli S, Bianchini F, Contena C, et al. Acidic pH via NF-kappaB favours VEGF-C expression in human melanoma cells. Clin Exp Metastasis. 2013;30:957–967.
- Peppicelli S, Andreucci E, Ruzzolini J, et al. The acidic microenvironment as a possible niche of dormant tumor cells. Cell Mol Life Sci. 2017;74:2761–2771.
- Jeon MS, Song SH, Yun J, et al. Aberrant epigenetic modifications of LPHN2 function as a potential cisplatin-specific biomarker for human gastrointestinal cancer. Cancer Res Treat. 2016;48:676–686.
- Semenova EA, Kwon MC, Monkhorst K, et al. Transcription factor NFIB is a driver of small cell lung cancer progression in mice and marks metastatic disease in patients. Cell Rep. 2016;16:631–643.
- Liu Y, Huang D, Wang Z, et al. LMO2 attenuates tumor growth by targeting the Wnt signaling pathway in breast and colorectal cancer. Sci Rep. 2016;6:36050.
- Wei JL, Fang M, Fu ZX, et al. Sestrin 2 suppresses cells proliferation through AMPK/mTORC1 pathway activation in colorectal cancer. Oncotarget. 2017;8:49318–49328.
- Cheng W, Huang PC, Chao HM, et al. Glypican-3 induces oncogenicity by preventing IGF-1R degradation, a process that can be blocked by Grb10. Oncotarget. 2017;8:80429–80442.
- Zhang T, Guan G, Chen T, et al. Methylation of PCDH19 predicts poor prognosis of hepatocellular carcinoma. Asia Pac J Clin Oncol. 2018;14(5):e352–e358.
- Lake SL, Damato BE, Kalirai H, et al. Single nucleotide polymorphism array analysis of uveal melanomas reveals that amplification of CNKSR3 is correlated with improved patient survival. Am J Pathol. 2013;182:678–687.
- Chao M, Wu H, Jin K, et al. A nonrandomized cohort and a randomized study of local control of large hepatocarcinoma by targeting intratumoral lactic acidosis. eLife. 2016;5:e15691.
- Zhou ZH, Rao J, Yang J, et al. SEMA3F prevents metastasis of colorectal cancer by PI3K-AKT-dependent down-regulation of the ASCL2-CXCR4 axis. J Pathol. 2015;236:467–478.
- Yang B, Zhou ZH, Chen L, et al. Prognostic significance of NFIA and NFIB in esophageal squamous carcinoma and esophagogastric junction adenocarcinoma. Cancer Med. 2018;7:1756–1765.