
 ?Mathematical formulae have been encoded as MathML and are displayed in this HTML version using MathJax in order to improve their display. Uncheck the box to turn MathJax off. This feature requires Javascript. Click on a formula to zoom.
ABSTRACT
To investigate the differential expression of microRNA-150-5p (miR-150-5p) and early growth response 1 (EGR1) in myocardial fibrosis (MF) cells, and determine the effect between miR-150-5p and EGR1 on MF. Human MF cells were generated via Trypanosoma cruzi (T. cruzi) infection, a mouse model of MF was generated via angiotensin II. The expression levels of miR-150-5p and EGR1 were detected by quantitative real-time polymerase chain reaction (qRT-PCR) and western blot assay. The correlation between miR-150-5p and EGR1 was confirmed by a luciferase reporter assay. The viability, proliferation, and apoptotic rate were detected by cell counting kit-8 (CCK-8), colony-formation and flow cytometry assays. Hematoxylin-eosin (HE) staining and Masson staining visualized the degree of MF. Echocardiography was performed to obtain the levels of left ventricle fractional shortening (LVFS) and left ventricle ejection fraction (LVEF), computer algorithms and a videographics program were used to obtain the levels of left ventricular systolic pressure (LVSP), left ventricular end diastolic pressure (LVEDP) and ±left ventricular dp/dt maximum (LV dp/dtmax). We found that the expression of miR-150-5p in MF cells was lower than normal cardiomyocytes, while the expression level of EGR1 in MF cells were higher than normal cardiomyocytes. Cell experiments demonstrated that EGR1 and miR-150-5p could influence the development of MF, and the expression of EGR1 in cardiomyocytes was regulated by miR-150-5p directly. Lastly, we confirmed that sh-Egr1 would decrease the severity of MF, while miR-150-5p antagomir could aggravate MF. Our results illustrate the mechanism of MF development, and provide a potential target for MF treatment.
KEYWORDS:
Introduction
Myocardial fibrosis (MF) is a hallmark of several cardiovascular diseases and can even be fatal [Citation1]. The development of many cardiovascular diseases, such as heart failure, myocardial infarction, and atrial fibrillation, is usually companied by myocardial structure remodeling [Citation2]. For this reason, MF is considered to be a driver of heart failure and adverse ventricular remodeling since MF is responsible for many kinds of cardiac injuries. Myocardial infraction (MI) is one of the most common cardiac injuries that induces MF [Citation3]. Moreover, MF takes part in many cardiac pathophysiologic processes; the proliferation and accumulation of cardiac fibroblast would prevent damage to the ventricular wall, but the increased fibrotic reaction would result in the progressive impairment of cardiac function or even sudden cardiac arrest [Citation4]. Myofibroblasts are the most important effector cells in MF and can express contractile proteins and perform many functions such as migration, proliferation, and secretion [Citation5]. However, currently, there are no effective therapeutic approaches for suppressing the development of MF. Therefore, studying the mechanisms responsible for MF is extremely important in developing anti-fibrotic therapies for patients with cardiovascular diseases [Citation5,Citation6].
MicroRNAs are short noncoding RNAs that are encoded by the genome inducing the degradation or suppress the translation of mRNAs by binding to the 3ʹUTR (untranslated region) of mRNAs [Citation7]. For this reason, recent studies about the functions and regulatory mechanisms of miRNAs in diseases with high incidence, such as epilepsy, pancreatic cancer, myocardial infraction and other heart diseases, usually investigate the roles of mRNAs [Citation8–Citation10]. Previous studies have suggested that miRNAs are closely related to myocardial infraction and fibrosis; the research of SG Dong et al. investigated the upregulation of miR-21 in cardiac fibrosis and heart failure [Citation11]. Y Hong et al. reported that miR-22 could suppress the fibrogenesis of cardiac fibroblasts by targeting TGFR1 [Citation12]. Moreover, some researchers have revealed that miR-150 participates in many cardiovascular diseases and the expression level of miR-150was found to change significantly in acute myocardial infraction [Citation13,Citation14]. Therefore, it is necessary to study the role of miR-150-5p in MF.
The expression of early growth response (EGR) proteins could be promoted in many cell types in response to injury, and the EGR transcriptional regulator gene family has been shown to participate in the occurrence of fibrosis [Citation15]. Among EGR family, the role of early growth response gene 1 (EGR1) has been considered specific. EGR1 is a zinc finger transcription factor and an immediate-early master-regulator gene [Citation16]. Its role in tumor is vital since it could not only act as an oncogene but also a suppressor in tumor [Citation17]. Also, it has been reported that EGR1 is involved in the pathogenesis of ischemia-reperfusion injuries and the neointima formation after vascular injury [Citation18]. Recently, the function of EGR1 in the diseases within the cardiovascular system has been widely explored, especially its function in myocardial injury in mouse model. EGR1 might also be implicated in cardiac fibrosis and vasculopathy since it has been revealed to modulate many biological processes related to endothelial cell growth and muscle development [Citation19]. EGR1 was reported to be involved in fibrosis; however, the relationship between miR-150-5p and EGR1 remains unknown. In addition, whether the effects of miR-150-5p on MF are carried out by targeting EGR1 also requires further investigation.
Our study mainly investigated the effects of miR-150-5p and EGR1 in MF. We demonstrated that miR-150-5p and EGR1 were differentially expressed in human MF cells and the effect of mir-150-5p/EGR1 interaction on MF cells. We also provided the first evidence about the biological effect of EGR1 and miR-150-5p on a MF. Together, our results suggest that miR-150-5p could regulate the expression of EGR1 and serve as a novel biomarker of MF.
Materials and methods
Microarray analysis
MiRNA and mRNA expression data of the three gene chips (accession number: GSE75821, GSE104150 and GSE43967) were obtained from the National Center for Biotechnology Information (NCBI) Gene Expression Omnibus (GEO) database. The gene chips were analyzed using GPL11532, GPL20712 and GPL6885 platforms, respectively. GSE75821 contains three primary human cardiomyocytes (PHCM) control groups and six T. cruzi-induced PHCM groups (two groups were exposed to T. cruzi for 60 min, two other groups were exposed for 90 min and the remaining two groups were exposed for 120 min). GSE104150 contains nine groups of ex vivo blood samples to investigate the correlation between the specific miRNA and MF; the other seven groups are control groups. GSE43967 contains four wild-type mouse left ventricle groups and four SCN5A delta/+ mouse left ventricle groups. The R software package was used to preprocess RNA sequencing and microarray data. Differentially expressed mRNAs and miRNAs were screened with a t-test (P < 0.05) accompanied with |FC (fold change)| >2. Heatmaps were generated to visualize the results. P value was adjusted by the Benjamini-Hochberg procedure.
Cell culture
AC16 (primary human cardiomyocytes; PHCM), human embryonic kidney 293 T (HEK-293T) cells and HL-1 (mouse cardiomyocytes) were purchased from BeNa Culture Collection (BNCC, No: 335,797, Beijing, China). AC16 cell line and HEK293T cells were cultured in DMEM/F‐12 medium (PromoCell, Heidelberg, Germany), supplemented with 10% fetal bovine serum (FBS, Diagnovum) and 1% penicillin–streptomycin solution (Sigma-Aldrich, St. Louis, MO, USA). HL-1 cells were cultured in Claycomb medium (Sigma-Aldrich) supplemented with 10% FBS, 1% penicillin/streptomycin (Sigma-Aldrich) and glutamine (2 mM). Cells were cultured at atmosphere of 95% air plus 5% CO2 at 37ºC.
T. cruzi-infected primary human cardiomyocytes
The inoculation and pre-infection experiment were conducted based on the study of Udoko AN et al [Citation19]. In terms of infection assays, AC16 confluent monolayers were cultured in Hank’s Balanced Salt Solution (HBSS) containing 30 mM N’-a-hydroxyethylpiperazine-N’- ethanesulfonic acid (HEPES), and followed by the addition of invasive T. cruzi trypomastigotes at 2 × 10⁷ parasites/ml for 2 h at 37°C in the presence of 5% CO2. Parasites were washed and AC16 cells were cultured in fresh medium for further investigation. The extraction of total RNA at 72 h was achieved to perform qRT-PCR and western blot assay. Mock-infected AC16 were prepared as control group in each time point.
Cell transfection
Before the transfection processes, 2 × 10⁵ AC16 cells were inoculated in 6-well plates with a supplement of 2 mL complete medium and were incubated overnight to reach 90% confluency. The transfection procedure was performed based on the instruction of the Lipofectamine® 2000 (Invitrogen, Carlsbad, CA, USA). Transfected MF cells were divided into four groups: (1) the NC group: negative control. (2) the miR-150-5p mimics + EGR1 group: cells transfected with miR-150-5p and EGR1. (3) The EGR1 group: cells transfected with EGR1. (4) the miR-150-5p mimics group: cells transfected with miR-150-5p mimics. All the transfected cells were resuspended and stored in an incubator for 24 to 72 h before detection; transfection efficiency was detected by a western blot assay.
Cell viability assay (CCK-8 assay)
Cell viability was detected by the Cell Counting Kit-8 (CCK-8, MedChem Express, China) with the utilization of highly water-soluble tetrazolium salt. The cell suspension (100 μL/well) was inoculated into a 96-well plate, and the plate was preincubated in a humidified incubator (37°C for 24 h). Then, 10 μL of the CCK-8 solution was added into each well of the plate (taking care not to generate bubbles in the wells). Subsequently, the plate was placed into the incubator for 0 h to 72 h; the absorbance was measured at 450 nm using microplate reader (Molecular Devices, Shanghai, China).
Colony-forming assay
After the transfection of MF cells, four groups of cells were cultured, respectively. Cells were collected in the logarithmic phase to be digested with 0.25% trypsin (Thermo Fisher Scientific; USA). After digestion, single cells were seeded onto 6-well plates (Multi Sciences; Hangzhou, China) contained RPMI 1640 medium (Thermo Fisher Scientific; USA) with a concentration of 1 × 10³ cells per well. The cells culture was stored at incubator under 37°C with 5% CO2 atmosphere for 1 to 2 weeks until visible colonies formed. After discarding the supernatant and washing with PBS buffer (Lonza, Verviers, Belgium) twice, then colonies were fixed with 4% paraformaldehyde for 15 min. Then, crystal violet (Beyotime Institute of Biotechnology; Shanghai, China) was used to stain the colonies for 15 min. After the discarding of stain, cells were washed using PBS buffer twice and dried in air. Colonies counting was achieved directly under visual inspection and imaged were saved.
Flow cytometry assay
Cells were lysed using cell dissociation solution and washed twice in PBS buffer (Lonza, Verviers, Belgium). Approximately, 2 × 10⁵ cells were collected and added into 96-well plates (Multi Sciences; Hangzhou, China) with a blocking reagent (Sigma-Aldrich). Then, cells were stained with FITC-conjugated Annexin V (BD, USA) for 10 min incubation. After that, cells were stained with propidium iodide (PI; BD, USA) for 5 min. Incubation was conducted in room temperature away from light. After each staining PBS buffer was added twice to wash off the stain. Apoptosis rates were detected with FACS Calibur Flow cytometry (BD, CA, USA) according to manufacturer’s recommendations.
Quantitative real time polymerase chain reaction (qRT-PCR) for measuring the expression of mir-150-5p and EGR1
For the detection of the miRNA and mRNA expression levels, total RNA was extracted using TaqMan® microRNA assays (Applied Biosystems) and Invitrogen® Trizol® (Invitrogen) respectively, following the manufacturers’ instructions. The reverse transcription was achieved with BioScript III reverse transcriptase (Junfeng Bioengineering, Hangzhou, China) following the manufacturers’ protocols. Samples prepared without reverse transcription were treated as negative controls. MiRNA expression was normalized with U6, and the target mRNA expression was normalized to glyceraldehyde-3-phosphate dehydrogenase (GAPDH). All the reactions were performed in triplicate using ABI PRISM® 7700 Sequence Detection System (Thermo Fisher Scientific). The primer sequences used for qRT-PCR are shown in . Differences between the samples were quantified based on the 2−∆∆Ct method.
Table 1. Primer sequences for qRT-PCR.
Western blot assay
First, 100 μg of each total protein were extracted from cells or tissues and isolated by 12% sodium dodecyl sulfate (SDS-)polyacrylamide gel electrophoresis; the isolated proteins were transferred onto polyvinylidene fluoride (PVDF) membranes. The blocked membranes were incubated with primary antibodies for Egr1 (ab133695, 51/1,000 dilution, Abcam, USA), Matrix metallopeptidase 13 (MMP-13, ab39012, 1/3000, Abcam), Collagen I (ab34710, 1/1000 dilution, Abcam), Collagen III (ab7778, 1/5000 dilution, Abcam) and horseradish peroxidase (HRP)-conjugated monoclonal antibody for GAPDH (ab9485, 1/2500 dilution, Abcam) at 4°C overnight. After washing three times with TBST, the membranes were incubated with secondary antibody, goat anti-rabbit IgG H&L (HRP) (ab97040, 1/5000 dilution, Abcam) at 37°C. The proteins were detected by a chemiluminescence detection kit (Beit Haemek, ISRAEL). The expressions levels of proteins were normalized to GAPDH expression, and the whole assay was repeated three times.
Dual-luciferase reporter assay
HEK293T and HL-1 cells were employed for the dual-luciferase reporter assay. To confirm EGR1 as the target gene of miR-150-5p, the 3ʹUTR segments of human EGR1 were inserted into the downstream multiple cloning sites of the firefly luciferase gene in the pMIR-REPORT luciferase reporter system (Ambion, Inc.) to form chimeric plasmid. Site-directed mutagenesis was developed on the wild-type EGR1 3ʹUTR (wt-EGR1 3ʹUTR) to form a mut-group. In terms of the transfection process, the cells were cotransfected with 0.05 μg of reporter construct (wt-group or mut-group) and miR-150-5p mimics using Lipofectamine 2000 (Invitrogen, USA) following the manufacturer’s protocol. After 48 h of cotransfection, the luciferase activity was detected by a dual-luciferase reporter assay system (Promega, USA). Firefly luciferase was normalized by renilla luciferase.
Construction of mouse model with MF
Eighteen 8-week-old male C57BL/6 mice (20–30 g) were used in this study and were purchased from SPF biotechnology (Beijing, China). All animal experiments were authorized by the Ethics Committee of Children’s Hospital, Zhejiang University School of Medicine,, Hangzhou China. Animals were kept in a controlled room with a 12:12 h light-dark cycle, with free access to standard chow and tap water for 1 week before experimentation. Preoperative fasting was required, and the mice were anesthetized with 3 mg/kg chloral hydrate. A mini-osmotic pump (ALZET, DURECT Corporation, CA, USA) that contained Ang II was implanted into the subcutaneous tissue of the mice and infused continuously for 4 weeks (making sure that the mini-osmotic pump was upright at the time of preloading Ang II and preventing the generation of bubbles in the wells). Mice were divided into four groups (n = 6 each):for control group (group A), we inserted 0.9% saline, and for the other five treatment groups, Ang II (435 ng/(kg·min)) was inserted. One week after the establishment of the MF mouse model, the four treatment groups were injected with sh-Egr1 lentivirus (LV) carrying a green fluorescent protein (GFP) or LV-shNC (5 × 10⁷ TU/ml), and miR-NC or miR-150-5p antagomir. The details of dispose are as follow. Group B were treated with Ang II (435 ng/(kg·min)). Group C were treated with LV-shNC & miR-NC, group D were treated with sh-Egr1 & miR-NC, group E were injected with LV-shNC & miR-150-5p antagomir, and group F were injected with sh-Egr1 & miR-150-5p antagomir. The lentivirus-mediated shRNA for Egr1 (sh-Egr1) and the lentivirus carrying overexpressed Egr1 were synthesized by Bio&Link (Shanghai, China). The sequence of shRNA was 5ʹ-GGACAAGAAAGCAGACAAA-3ʹ and the promoter was CMV. The pLV-UbC-GFP-Egr1 vector (NM_007913.5) for mRNA overexpression was purchased from Vigene Biosiences (Jinan, China). During the surgery and recovery, the mice were maintained at a normal body temperature by using controlled heating pads. Mice were sacrificed after 2 weeks by using an overdose of halothane, and the hearts were collected and stored at −70 °C until use.
Determination of cardiac function
An echocardiography system (LISENDD 880, Japan) was used after the anesthetization of mouse and the standard lime lead ECG was recorded continuously by ECG recorder (Jinco Medical Equipment, Beijing, China). The cardiac functions and dimensions were measured by M-mode echocardiography. Left ventricular shortening fraction (LVFS) and left ventricular ejection fraction (LVEF) were calculated according to the digital images based on the standard formula from previous studies [Citation20]. The LV systolic pressure (LVSP), LV end-diastolic pressure (LVEDP) and the first derivative of the LV pressure (±LV dp/dtmax) were obtained by using computer algorithms and a video graphics program.± LV dp/dtmax means the maximum changing rate of Left ventricle inner pressure, a decrease in± LV dp/dtmax exhibited markedly impaired cardiac dysfunction [Citation21] (where + LV dp/dtmax indicated systolic function and – LV dp/dtmax indicated diastolic function).
Hematoxylin-Eosin (H&E) staining
The LV of the mouse heart samples were added into a formaldehyde solution (10%), and an ethanol gradient was used to dehydrate the samples. The dehydrated tissues were embedded in paraffin. Then, 4 μm-thick heart sections were prepared for following steps. For staining, paraffin sections were stored for 20 min in 60°C incubation for the next deparaffinization and hydration using dimethylbenzene and ethanol respectively. Then heart sections were stained using hematoxylin and eosin, neutral gum was used for seal at the end. Tissue slices were observed under a light microscope (Leica Microsystems Wetzlar GmbH) (nuclei were stained with hematoxylin and cytoplasm was stained with eosin Y).
Masson’s trichrome staining
Heart samples from the mouse model were fixed in 4% PFA and embedded in paraffin. Then, 5μm-thick heart sections were stained with Masson’s trichrome following the standard procedure. Acid fuchsin was used to stain muscles fibers red, while Aniline blue could stain collagenous fiber blue. Images of the left ventricular of the mice were obtained using a Nikon model (200× magnification) with a Spot Insight camera. Image Pro Plus 6.0 software was used to quantify the fibrotic tissues in each section.
Statistical analysis
As mentioned above, each experiment in this study was repeated three times for accuracy. The data were analyzed using GraphPad 6.0 software and are expressed as the mean standard deviation (SD). The significant differences between two groups were analyzed by t-tests; differences among more than two groups were analyzed by a one-way analysis of variance (ANOVA). P < 0.05 was considered statistically significant.
Results
Determination of an upregulated EGR1 profile in human MF cells
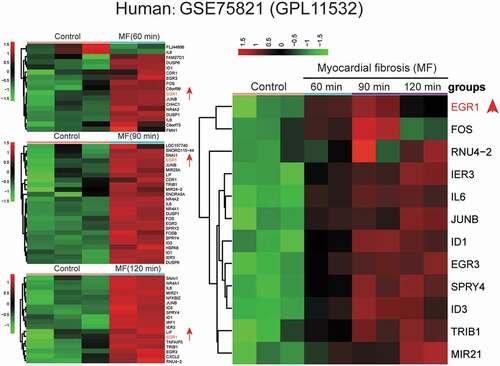
GSE75821 was used for the analysis of mRNA expression profiles at three-time points (60 , 90 , and 120 min) (). All the highly expressed mRNAs in human MF cells were screened out and developed into a heatmap (). We found that EGR1 was up-regulated in T. cruzi-induced human MF cells.
Figure 1. Microarray analysis of human MF cells.
Validation of T. cruzi-induced human MF cells and the expression of EGR1
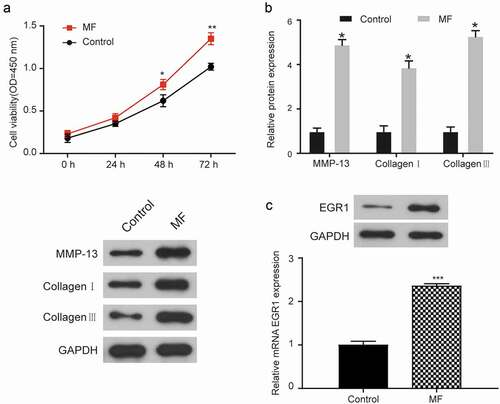
A CKK-8 assay was developed to detect the cell viability of MF cells and normal cells (). The cell viability of the MF group was significantly higher than that of the control group at the 48 and 72 h time points (P < 0.05). To determine the severity of the degree of MF, three proteins (MMP-13, Collagen I, and Collagen III) were detected by western blot assay (). The western blot showed that MMP-13, collagen I, and collagen III were more highly expressed in the MF group than in the control group (P < 0.05) (the results of western blot assay were normalized to GAPDH expression). QRT-PCR and western blot assay were performed to analyze the differential expression of EGR1 in the MF group (2.36 ± 0.02) and the control group (1.00 ± 0.08) (). The results showed that the expression of EGR1 was significantly higher in MF group than in the control group (P < 0.001).
Figure 2. EGR1 expression in T. cruzi-induced human MF cells.
Microarray analysis and validation of the target relationship between miR-150-5p and EGR1
The screening criterion was the same as that of a previous assay (|FC|>2 and P < 0.05). GSE104150 was used to analyze miRNA expression in healthy human and end-stage heart failure (HF) patients. The miRNAs with the 10 highest and lowest expression levels were selected, and we found that miR-150-5p was downregulated in MF (). MicroRNA.org software could predict specific miRNA that may target EGR1. There were 42 miRNAs that potentially targeted EGR1, and there were 30 differentially expressed miRNAs that were identified in the microarray analysis. Only miR-150-5p showed potential binding sites to EGR1 (). The relationship between miR-150-5p and EGR1 was further confirmed by a luciferase reporter assay.
Figure 3. The target relationship between miR-150-5p and EGR1.
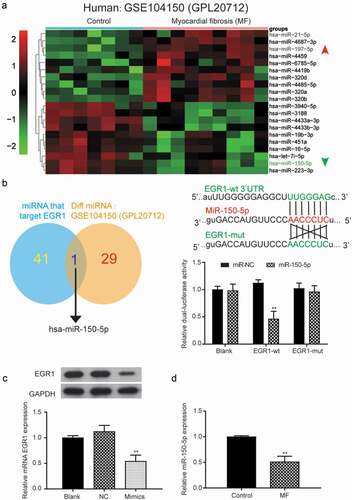
The luciferase activity of the cells transfected with miR-150-5p+EGR1 (0.47 ± 0.14) was significantly lower than that of cells transfected with miR-NC+EGR1 (1.12 ± 0.07) in the EGR1-wt group (P < 0.01) (). What’s more, miR-150-5p mimics was transfected into infected AC16 cells, and ) showed the expression of EGR1 in mimics group (0.54 ± 0.13) were significantly lower than NC group (1.12 ± 0.10) (P < 0.01), indicating that miR-150-5p could directly bind to EGR1 and downregulate its mRNA and protein expression. ) was the result of the qRT-PCR analysis of miR-150-5p expression The results showed that the expression level of miR-150-5p was dramatically lower in MF groups (0.53 ± 0.10) than in the control group (1.00 ± 0.03) (P < 0.01), which was in lined with the bioinformatic analysis of GSE104150
Determination the functions of mir-150-5p and EGR1 in MF cells
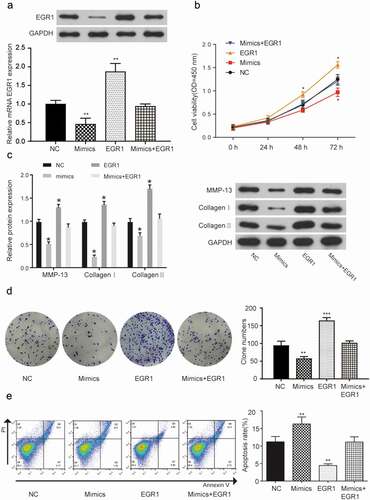
To determine the effect of miR-150-5p/EGR1 interaction, MF cells (AC16 cells is infected by T. cruzi for 120 min) were respectively transfected with miR-150-5p mimics, EGR1 and miR-150-5p mimics + EGR1. EGR1 expression level was detected () and compared with that in negative control group, the results indicated that EGR1 expressed was higher in the EGR1 group (1.85 ± 0.21) and lower in the mimic group (0.44 ± 0.19) (P < 0.01). The EGR1 expression levels in the NC group (0.99 ± 0.12) and mimics+EGR1 group (0.96 ± 0.03) was almost the same. The CCK-8 assay () demonstrated that the cell viability was higher in theEGR1 group, while it was dramatically lower in the mimics group than in the NC group (P < 0.05). The expression levels of three relative proteins (MMP-13, Collagen I, and Collagen III) were detected again by a western blot assay () to analyze the fibrosis degree of MF cells. MF cells transfected with EGR1 expressed more of related proteins than cells that underwent lipofection transfection (P < 0.05), and the western blot assay showed that the bands of the three proteins in the mimics group were much weaker than that of NC group. A colony formation assay was performed to estimate the effects of miR-150-5p and EGR1 on cells proliferation (). The number of cells in the EGR1 group (162.93 ± 11.45) was higher than in the NC (94.80 ± 10.26) group (P < 0.01), and the number of cells in the mimics group (58.35 ± 6.56) was lower than in the NC group (P < 0.01). ) shows the result of the flow cytometry assay, which showed that the apoptosis rate of MF cells transfected with miR-150-5p mimics (16.47% ± 1.75) was higher than that of the NC group (11.41% ± 1.25) (P < 0.01), and the apoptosis rate of the cells transfected with EGR1 (4.37% ± 0.50) was lower than that of the NC group (P < 0.01). Altogether, the results indicated that miR-150-5p could suppress cell viability and promote cell apoptosis, and retard the progression of MF. What’s more, the upregulation of miR-150-5p could reverse the negative effect of EGR1 in MF. The possible mechanism may be through a direct restrain of EGR1 expression.
Figure 4. MiR-150-5p suppresses MF by targeting EGR1.
The positive control of Egr1 in the mouse model of MF
GSE43967 was utilized to analyze mRNA expression profiles in the mouse model of MF, and the 10 most upregulated and the 10 most downregulated mRNAs in the MF mouse model were used to generate a heatmap. The results showed that Egr1 was also upregulated in the SCN5A delta/+ mouse left ventricle and were consistent with the results of human (). Further, a targeted relationship between miR-150-5p and Egr1 was found by comparing the gene sequences of miR-150-5p and Egr1. Consistent with our findings, luciferase reporter assay showed that miR-150-5p could directly target Egr1 (). The transfection efficiency of sh-Egr1 in vivo and in vitro was analyzed by detection the level of GFP protein. Western blotting showed that GFP was highly expressed in GFP group (sh-RNA lentivirus) (Figure S1A, B).
Figure 5. Animal experiments for validating the influence of Egr1 on MF.
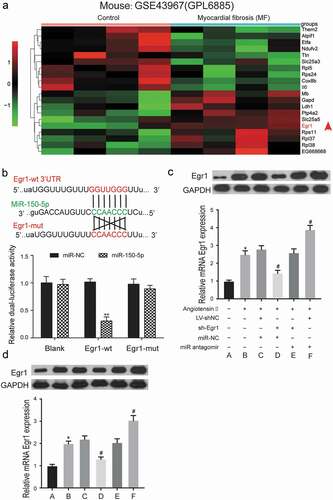
After transfection, Egr1 expression level was determined in vitro and in vivo, as was shown in ), the protein level of Egr1 was decreased in group D, compared with group C. MiR-150-5p antagomir increase the protein expression of Egr1. Importantly, we got the similar results in vivo (). What’s more, MMP-13, collagen I and collagen III expression in the six groups were analyzed by western blot (), and the results showed that knockdown of Egr1 increased the expression level of relative proteins, and antagonizing miR-150-5p could increase their expression. These results indicate that the interaction between miR-150-5p/Egr1 may affect the MF of mouse model.
Figure 6. The effects of miR-150-5p and Egr1 on hemodynamics in left ventricle.
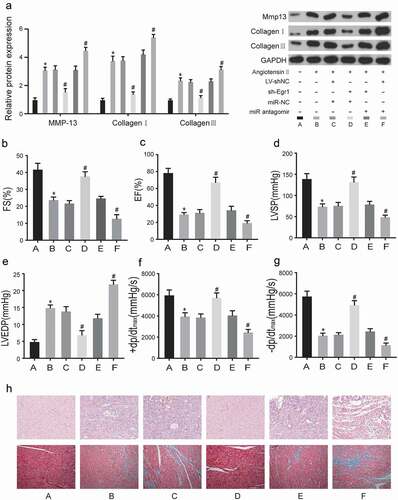
The effects of miR-150-5p and Egr1 on left ventricular hemodynamics
Cardiac function was estimated by echocardiography in an angiotensin II-induced mouse model. ,c) showed that the LVFS and LVEF were increased in the sh-Egr1 group (group D) (P < 0.05). These results indicated that suppressing the expression of Egr1 would relieve the severity of MF, while transfection of miR-150-5p antagomir significantly worsen the MF, counteracting the effect of sh-Egr1. The knockdown of Egr1 also reversed the effects of angiotensin II on LVSP () and LVEDP () Comparing with the group C, sh-Egr1 group expressed higher lower LVSP and lower LVEDP (P < 0.05). What’s more, antagonizing miR-150-5p could offset the positive effect of sh-Egr1. Therefore, our results illustrated that sh-EGR1 could not only promote systolic function in MF, but also recover diastolic function. In ), the maximum rate of LV dp/dtmax was significantly higher in the sh-Egr1 group (P < 0.01 compared with group C), and was significantly lower in the miR-150-5p antagomir group (P < 0.05 compared with group C). To visualize the degree of MF in the mouse model, heart samples from the six groups were stained by H&E staining and Masson’s trichrome staining, respectively (). The results showed that the knockdown of Egr1 in mice could retard the development of MF, while reducing the expression of miR-150-5p could aggravate MF. Therefore, these results indicated that reducing the expression of Egr1 remarkably improved the heart function, reducing the expression of miR-150-5p severe heart function of MF mice.
Discussion
EGR family has been proved to play a great role in fibrosis and heart failures [Citation15]. As a member of EGR family, EGR1 has been shown to modulate wide range of biological processes in vivo, including muscle development, endothelial cell growth [Citation19]. In present study, the data from the mRNA microarray (GSE75821) showed that EGR1 was highly expressed in T. cruzi-infected PHCM at three different time points (60, 90, and 120 min).Our study was corresponded with the results of Aniekanabassi N. Udoko et al., in which the authors also identified EGR1 to be up-regulated in T. cruzi-infected PHCM [Citation19], but none following experiments were conducted and the regulation mechanism of EGR1 was remained unclear. Therefore, we aimed to find its upstream microRNA that may directly target EGR1 to regulate its expression. MiR-150-5p was identified through bioinformatics analysis, more vitro experiments were conducted. We found that miR-150-5p was down-regulated in MF cells. And the direct interaction between miR-150-5p and EGR1 are vital to the viability and apoptosis of MF cells, also are great modulator to MF development. This finding could provide great complement on previous research, and shed light on future research. Most of the previous studies of miRNAs focused on its role in specific heart disease and heart function. For example, studies have revealed that circulating miR-150 might become a novel biomarker of heart failure than other markers used clinically (brain natriuretic peptide) [Citation22,Citation23]. And the study of Tang et al. reported that miR-150 was down-regulated in acute myocardial infraction (AMI) patients and miR-150 knockout could exacerbate MI-induced dysfunction [Citation24]. In our study, through putting our focus on the histopathology of heart dysfunction and disease, we identify the role miR-150-5p plays in MF. However, Ranganathan et al. revealed that the deletion of miR-150 could suppress MI-induced interstitial fibrosis after surgery [Citation25]. We surmised that the effects of miR-150 on the fibrosis of different organs might be different. Therefore, more in vivo experiments are needed to validate its role.
To improve the accuracy or our results, the expression levels of some related proteins, such as MMP-13, collagen I, and collagen III were detected, which were used to determine the severity of the MF. The results showed that the expression levels of these proteins increased dramatically in the EGR1 group while the decreased significantly in the miR-150-5p mimic group, which demonstrated that the inhibitory effect of miR-150-5p on EGR1 could contribute to retarding the development of MF. It’s consistent with our results, Meijuan Zou et al., reported that the cardiac extracellular matrix such as Collagen I and fibronectin were accumulated in MF [Citation26]. In conclusion, our study identified the interaction between miR-150-5p and EGR1 could be potential target for MF treatment.
Conclusion
This study illustrated the direct target relationship between miR-150-5p and EGR1. The differentially expressed levels of miR-150-5p and EGR1 in normal and MF cells were noted in this study, and miR-150-5p and Egr1 expression was further confirmed in the animal model. Meanwhile the inhibitory effects of miR-150-5p on MF via EGR1/Egr1 were verified in vitro and in vivo. Our study revealed that the inhibition of EGR1 by miR-150-5p might become an effective method for MF therapy.
Date availability statement
The date that support the findings of this study are available from the corresponding author upon reasonable request.
Ethical approval
All animal experiments were authorized by the Ethics Committee of Children’s Hospital, Zhejiang University School of Medicine, Hangzhou China. This study follows the principles of the Declaration of Helsinki.
Supplemental Material
Download Zip (587.8 KB)Disclosure statement
No potential conflict of interest was reported by the authors.
Supplementary material
Supplemental data for this article can be accessed here.
Additional information
Funding
Related Research Data
References
- Tao L, Bei Y, Chen P, et al. Crucial role of miR-433 in regulating cardiac fibrosis. Theranostics. 2016;6:2068–2083.
- Liang H, Zhang C, Ban T, et al. A novel reciprocal loop between microRNA-21 and TGFbetaRIII is involved in cardiac fibrosis. Int J Biochem Cell Biol. 2012;44:2152–2160.
- Viereck J, Bang C, Foinquinos A, et al. Regulatory RNAs and paracrine networks in the heart. Cardiovasc Res. 2014;102:290–301.
- Fan Z, Guan J. Antifibrotic therapies to control cardiac fibrosis. Biomater Res. 2016;20:13.
- Zhu WS, Tang CM, Xiao Z, et al. Targeting EZH1 and EZH2 contributes to the suppression of fibrosis-associated genes by miR-214-3p in cardiac myofibroblasts. Oncotarget. 2016;7:78331–78342.
- Zhou Y, Deng L, Zhao D, et al. MicroRNA-503 promotes angiotensin II-induced cardiac fibrosis by targeting Apelin-13. J Cell Mol Med. 2016;20:495–505.
- Zhou C, Cui Q, Su G, et al. MicroRNA-208b alleviates post-infarction myocardial fibrosis in a rat model by inhibiting GATA4. Med Sci Monit. 2016;22:1808–1816.
- Henshall DC, Hamer HM, Pasterkamp RJ, et al. MicroRNAs in epilepsy: pathophysiology and clinical utility. Lancet Neurol. 2016;15:1368–1376.
- Singh PK, Brand RE, Mehla K. MicroRNAs in pancreatic cancer metabolism. Nat Rev Gastroenterol Hepatol. 2012;9:334–344.
- Em S, En O. Pervasive roles of microRNAs in cardiovascular biology. Nature. 2011;469:336–342.
- Dong S, Ma W, Hao B, et al. microRNA-21 promotes cardiac fibrosis and development of heart failure with preserved left ventricular ejection fraction by up-regulating Bcl-2. Int J Clin Exp Pathol. 2014;7:565–574.
- Hong Y, Cao H, Wang Q, et al. MiR-22 may suppress fibrogenesis by targeting TGFbetaR I in cardiac fibroblasts. Cell Physiol Biochem. 2016;40:1345–1353.
- Zhang R, Lan C, Pei H, et al. Expression of circulating miR-486 and miR-150 in patients with acute myocardial infarction. BMC Cardiovasc Disord. 2015;15:51.
- Devaux Y, Vausort M, McCann GP, et al. MicroRNA-150: a novel marker of left ventricular remodeling after acute myocardial infarction. Circ Cardiovasc Genet. 2013;6:290–298.
- Bhattacharyya S, Fang F, Tourtellotte W, et al. Egr-1: new conductor for the tissue repair orchestra directs harmony (regeneration) or cacophony (fibrosis). J Pathol. 2013;229:286–297.
- Khachigian LM. Early growth response-1 in cardiovascular pathobiology. Circ Res. 2006;98:186–191.
- Verduci L, Azzalin G, Gioiosa S, et al. microRNA-181a enhances cell proliferation in acute lymphoblastic leukemia by targeting EGR1. Leuk Res. 2015;39:479–485.
- Bhindi R, Fahmy RG, McMahon AC, et al. Intracoronary delivery of DNAzymes targeting human EGR-1 reduces infarct size following myocardial ischaemia reperfusion. J Pathol. 2012;227:157–164.
- Udoko AN, Johnson CA, Dykan A, et al. Early regulation of profibrotic genes in primary human cardiac myocytes by trypanosoma cruzi. PLoS Negl Trop Dis. 2016;10:e0003747.
- Li Y, Garson CD, Xu Y, et al. Quantification and MRI validation of regional contractile dysfunction in mice post myocardial infarction using high resolution ultrasound. Ultrasound Med Biol. 2007;33:894–904.
- Li CJ, Lv L, Li H, et al. Cardiac fibrosis and dysfunction in experimental diabetic cardiomyopathy are ameliorated by alpha-lipoic acid. Cardiovasc Diabetol. 2012;11:73.
- Devaux Y, Vausort M, McCann GP, et al. A panel of 4 microRNAs facilitates the prediction of left ventricular contractility after acute myocardial infarction. PLoS One. 2013;8:e70644.
- Ellis KL, Cameron VA, Troughton RW, et al. Circulating microRNAs as candidate markers to distinguish heart failure in breathless patients. Eur J Heart Fail. 2013;15:1138–1147.
- Tang Y, Wang Y, Park KM, et al. MicroRNA-150 protects the mouse heart from ischaemic injury by regulating cell death. Cardiovasc Res. 2015;106:387–397.
- Ranganathan P, Jayakumar C, Tang Y, et al. MicroRNA-150 deletion in mice protects kidney from myocardial infarction-induced acute kidney injury. Am J Physiol Renal Physiol. 2015;309:F551–8.
- Zou M, Wang F, Gao R, et al. Autophagy inhibition of hsa-miR-19a-3p/19b-3p by targeting TGF-beta R II during TGF-beta1-induced fibrogenesis in human cardiac fibroblasts. Sci Rep. 2016;6:24747.