
ABSTRACT
Aging is a risk factor for various acute and chronic kidney injuries. Kidney aging is accompanied by the secretion of growth factors, proteases, and inflammatory cytokines, known as the senescence-associated secretory phenotype (SASP). These factors accelerate the aging process and senescence-associated changes. Delaying kidney senescence may prevent acute and chronic kidney injury. Methionine restriction (MR) was found to be an effective intervention for delaying senescence. However, the mechanism of MR remains unclear. In this study, we investigated the effect of MR on the survival rate and renal aging of C57BL/6 mice and examined the relevant mechanisms. MR increased the survival rate and decreased the levels of senescence markers in the aging kidney. Both in vivo and in vitro, MR upregulated the transsulfuration pathway to increase H2S production, downregulated senescence markers and the SASP, and activated AMPK. The ability of MR to delay aging was reduced when AMPK was inhibited. These results suggest that MR may slow animal aging and kidney senescence through H2S production and AMPK pathway activation.
Abbreviations: DR: diet restriction; MR: methionine restriction; SASP: senescence-associated secretory phenotype; AL: ad libitum; CKD, chronic kidney disease; AKI: acute kidney disease; TSP: transsulfuration pathway; CGL: cystathionine g-lyase; H2S: hydrogen sulfide; AMPK: AMP-activated protein kinase; mTOR: mammalian target of rapamycin; IS: indoxyl sulfate; CC: compound C.
Introduction
Aging is an inevitable physiological process during which the senescence-associated secretory phenotype (SASP) accelerates senescence and influences the microenvironment surrounding senescent cells. The kidneys undergo many changes during aging, such as renal cortex thinning, glomerular sclerosis, interstitial fibrosis, tubular atrophy, renal arteriosclerosis, and dysfunction. Surveys from the US and China show that the prevalence of chronic kidney disease (CKD) is high in the elderly population [Citation1,Citation2] which has led to controversy about whether aging-associated CKD is a purely biological phenomenon linked to organ senescence [Citation3]. CKD can occur in combination with cardiovascular and cerebrovascular disease and lead to death [Citation4]. Moreover, aging kidneys are more susceptible to acute kidney injury (AKI) [Citation5]. Therefore, delaying the aging and senescence of the kidney is important for preventing acute and chronic kidney injury.
Interventions for the aging process have been widely explored. Dietary restriction (DR) has been known to increase lifespan [Citation6]. Recently, researchers have begun to explore whether amino acid restriction plays a primary role in the life-extending benefits of DR. Promising DR regimens involve a decrease in the level of one essential amino acid, methionine. The lifespan of rats fed a low-methionine diet was extended compared to that of rats fed increased dietary levels of methionine [Citation7]. Both the maximum and median life spans of mice were extended when a low-methionine diet was started at 12 months of age [Citation8]. However, the mechanism of methionine restriction (MR) is still unclear. Some studies show that MR decreases mitochondrial reactive oxygen species (ROS) generation and ameliorates oxidative damage to hepatic mitochondrial DNA and proteins [Citation9,Citation10]. MR slows down aging in human cells by modulating mitochondrial protein synthesis and respiratory chain assembly [Citation11] and increases insulin sensitivity in mice [Citation12]. Recently, Hine and colleagues used a mouse model of DR-mediated stress resistance to show that sulfur amino acid (SAA) restriction increased the expression level of cystathionine g-lyase (CGL), an enzyme in the transsulfuration pathway (TSP); this effect increased hydrogen sulfide (H2S) production and protected against hepatic ischemia reperfusion injury [Citation13]. Although toxic at high levels, H2S produced at low concentrations due to cysteine (Cys) or homocysteine degradation by CGL has a beneficial effect on the vasculature and the brain; at low concentrations, H2S acts as a signaling molecule to reduce blood pressure [Citation14] and prevent neurodegeneration [Citation15]. Exogenous H2S can also extend the lifespan of worms [Citation16] and induce suspended animation in mammals [Citation17]. These actions of H2S may play a key role in the benefits of MR, such as extended life spans.
However, no study has reported the impact of MR on natural kidney aging and the SASP. In this study, we investigated the effects of a lifelong MR diet (started at 3 months of age) on survival rates in C57BL/6 mice as well as the relevant mechanisms. We analyzed whether MR can slow aging and suppress the SASP in the kidneys by increasing the production of endogenous H2S.
Aging and aging-related kidney diseases are closely related to the senescence of renal tubular epithelial cells [Citation18]. Large numbers of aging renal tubular epithelial cells have been found in the aging kidneys of humans and animals, and these aging cells are an important cause of the structural and functional changes in aging kidneys [Citation19]. Therefore, delaying renal tubular epithelial cell aging is important for slowing kidney senescence. Indoxyl sulfate (IS) is the most abundant indole compound that accumulates in uremic patients and can reportedly induce senescence in human proximal tubular cells (HK-2 cells) [Citation20]. Here, we used IS-induced HK-2 cells as a model system to determine whether MR can slow the IS-induced senescence of renal tubular epithelial cells by improving endogenous H2S production. In addition, we evaluated the effect of H2S on the AMPK/mTOR pathway in vivo and in vitro.
Materials and methods
Animals
All animal procedures carried out in this study were approved by the Animal Care and Use Committee of Chinese PLA General Hospital and conducted in accordance with the Guide for the Care and Use of Laboratory Animals published by the US National Institutes of Health (NIH publication no. 85–23, revised 2011). Two-month-old C57BL/6 mice were purchased, housed at the Experimental Animal Center of the Chinese PLA General Hospital and fed a standard chow diet until 3 months of age. Then, the mice were randomized into control (ad libitum, AL) and experimental (methionine restriction, MR) diet groups. The AL group was fed normal mouse chow that contained 0.86% methionine, while the MR group was fed a modified chow diet that contained 0.15% methionine. The two types of chow contained the same number of calories. All animals were given free access to food and water and were maintained under a 12-h light/dark cycle throughout the study. A separate cohort consisting of 20 animals (male = 10, female = 10) per diet group was used to assess lifespan characteristics, and survival was measured by assessing mortality each week.
To study the effects of MR on kidney senescence, we constructed another MR model. We used male C57BL/6J mice in which the MR diet was initiated at 20 months of age. The mice were randomly divided into two groups and fed the AL or MR diet (OAL and OMR groups, respectively). At 22 months of age, six mice per group were euthanized with sodium pentobarbital (45 mg/kg, i.p.). Blood was collected from the inner canthus. Kidney tissues were removed and perfused with ice-cold, isotonic phosphate-buffered saline (PBS) to remove any remaining blood. The tissues were immediately frozen in liquid nitrogen and stored at −80°C until further processing.
Serum biochemistry analysis
Serum samples were collected by centrifugation at 3,000 rpm for 10 min and stored at −80°C before analyses. Serum biochemical parameters were measured using an autoanalyzer (Cobas8000, Roche, Germany).
Renal histopathological studies
Kidneys were excised, fixed in 4% paraformaldehyde and embedded in paraffin. For light microscopy, paraffin-embedded renal sections (4 mm thick) were stained with periodic acid-Schiff (PAS) solution and examined under a microscope. Histological examinations were performed independently in a blinded fashion by two observers. All group samples were evaluated, and after scoring 10 randomly selected fields from each sample at a total magnification of 400x, the average scores were calculated. The four main indicators were (1) tubular epithelial cell degeneration, (2) tubular atrophy, (3) interstitial inflammatory cell infiltration, and (4) interstitial fibrosis. Scoring was based on the percentage of lesions mentioned above in the renal interstitial area: 0% was counted as 0 points, 0–25% was counted as 1 point, 25–50% was counted as 2 points, 50–75% was counted as 3 points, and >75% was counted as 4 points.
Cell culture
HK-2 cells and NRK-52E cells were cultured in Dulbecco’s Modified Eagle’s Medium (DMEM) supplemented with 5% fetal bovine serum (FBS) in a humidified atmosphere of CO2/air (5%/95%) at 37°C. In vitro, MR was achieved by incubating the cells in DMEM (lacking methionine) supplemented with 5% dialyzed FBS and 6 mg/L methionine for up to 48 h. IS-induced senescence was achieved by incubating the cells with IS (250 μM) for 48 h.
Measurement of senescence-associated β-galactosidase (SA β-gal) activity
Serum-starved cells were incubated with or without IS for 48 h. Positive cells were measured using a Senescence Detection Kit (Abcam) according to the manufacturer’s instructions. The cells were cultured in three wells for every group. SA-β-gal staining was quantified by light microscopy and by a researcher who was blinded to the treatments. The cells were rinsed with PBS, and three microscopic fields were counted in each well to determine the percentage of SA-β-gal-positive cells.
Western blot analysis and antibodies
The frozen kidney tissues were lysed in RIPA lysis buffer and centrifuged at 12,000 g for 30 min at 4°C to obtain the cellular proteins in the supernatant. Equal amounts of protein from each sample were resolved by SDS-PAGE, transferred to nitrocellulose (NC) membranes and blocked with 5% skim milk for 1 h at room temperature. The membranes were then probed with the following primary antibodies at 4°C overnight: anti-p16 (ab51243, Abcam), anti-cystathionase (ab151769, Abcam) and anti-actin (ab151769, Abcam); anti-p21 (10355–1-AP, Proteintech) and anti-p53 (10442–1-AP, Proteintech); anti-IL-1β (sc-12742, Santa Cruz Biotechnology); and anti-phospho-AMPK (2535, Cell Signaling Technology), anti-AMPK (2603, Cell Signaling Technology), anti-phospho-mTOR, (5536, Cell Signaling Technology), anti-mTOR (2983, Cell Signaling Technology), anti-phospho-4EBP1 (2855, Cell Signaling Technology), anti-4EBP1 (9644, Cell Signaling Technology), anti-phospho-S6K (9234, Cell Signaling Technology), and antio-S6K (2708, Cell Signaling Technology). The blots were subsequently probed with horseradish peroxidase-conjugated anti-rabbit IgG (Santa Cruz Biotechnology) at 1:1000–5000. Immunoreactive bands were visualized by enhanced chemiluminescence, and densitometry was performed using Quantity One software (Bio-Rad Laboratories).
Immunofluorescence staining
For immunofluorescence staining, cultured cells were washed with PBS. After blocking with 10% Superblot for 20 min, the cells were incubated overnight at 4°C in a humidified chamber with anti-IL-1β (sc-12742, Santa Cruz Biotechnology) and anti-IL-8 (MAB208-100, R&D Systems) antibodies. After washing with PBS, the anti-IL-1β antibody was probed with FITC-labeled goat anti-rabbit IgG for 1.5 h in the dark at room temperature. After washing with PBS, the proteins were observed by fluorescence microscopy, and the cells were photographed using a confocal microscope. The fluorescence intensity was estimated by an image analyzer (Image-Pro Plus). Five fields were counted in each group.
Enzyme-linked immunosorbent assays (ELISAS)
The kidney tissues were stored at −80°C. Albuminuria, kidney injury molecule 1 (KIM-1), and neutrophil gelatinase-associated lipocalin (NGAL) levels in urine as well as IL-6 and IL-1β levels in tissue homogenates and cell culture supernatants were measured using ELISA kits (R&D Systems) according to the manufacturer’s instructions. H2S was also measured using an ELISA kit (Neo Scientific) according to the manufacturer’s instructions.
Transfection of siRNA
NRK-52E cells were cultured in DMEM containing 5% FBS at 37°C in a 5% CO2 atmosphere. siRNA transfection was conducted in NRK-52E cells to knock down the expression of AMP-activated protein kinase (AMPK). In the case of off-target effects, two different AMPK siRNA sequences were used in this study. We transfected 3 × 10 [Citation5] cells per six-well plate with siRNA (80 nM) using Lipofectamine RNAi MAX transfection reagent (Invitrogen, Carlsbad, CA, USA) according to the manufacturer’s instructions for reverse transfection. The following target sequences were used:
AMPK siRNA-1:
5ʹ-CCGGGCTGTGGATCGCCAAATTATTCAAGAGATAATTTGGCGATCCACAGCTTTTTTG-3;
AMPK siRNA-2:
5ʹ-CCGGGCAAACCATACGACATTATTTCAAGAGAATAATGTCGTATGGTTTGCTTTTTTG-3ʹ.
The siRNA sequences were designed and produced by GenePharma Co., Ltd. (Shanghai, China). The transfection efficiency was determined using a fluorescence microscope. At 48 h posttransfection, cells were terminated and prepared for subsequent assays.
Total RNA isolation and real-time PCR
Total RNA was isolated from renal tissues using TRIzol (Invitrogen, Carlsbad, CA) according to the manufacturer’s instructions. A UV spectrophotometer was used to measure the concentrations of total RNA. Reverse transcription was performed using a TIANScript RT kit (Tiangen Biotech, Beijing, China). Amplification was performed on a 7500 real-time PCR system (Applied Biosystems, Foster, CA). The reaction mixture comprised 50 ng of complementary deoxyribonucleic acid, 0.2 μM primers, and 10 μL of 2 × SYBR green buffer (Applied Biosystems, Foster, CA) in a final volume of 20 μL. The primers were designed using the software package Primer Express 2.0 (Applied Biosystems) based on GenBank nucleotide sequences. Realtime PCR was conducted using the following primers:
klotho-mouse (forward: 5ʹ-TGTGACTTTGCTTGGGGAGTT-3ʹ; reverse: 5ʹ-TCTTGGCTACAACCCCGTCT-3ʹ),
IL-1A-mouse (forward: 5ʹ-AGTCAACTCATTGGCGCTTG-3ʹ; reverse: 5ʹ-GAGAGAGATGGTCAATGGCAGA-3ʹ),
GAPDH-mouse (forward: 5ʹ-AGAAGGTGGTGAAGCAGGCATCT-3ʹ; reverse: 5ʹ-CGGCATCGAAGGTGGAAGAGTG-3ʹ).
Statistical analysis
All data were analyzed using SPSS 17.0 (SPSS, Chicago, IL). Log-rank tests were used for mice survival analysis. Comparisons among groups were analyzed by analysis of variance (ANOVA). Values of P < 0.05 indicated statistical significance.
Results
MR extends the lifespan of C57BL/6 mice
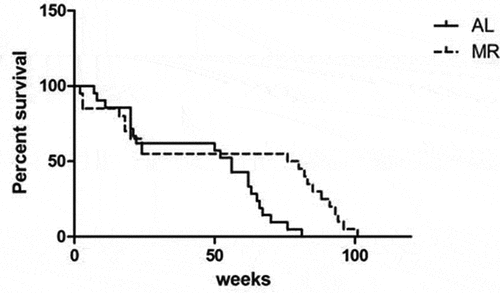
The effects of lifelong MR were evaluated in C57BL/6J mice in which the diet was initiated at 3 months of age. After 68 weeks, significant differences in the survival rates of the two groups were observed. A logrank test showed that the lifespan was dramatically higher in the MR group than in the AL group (P = 0.009) ().
Figure 1. Increased longevity in C57BL/6 mice fed a MR diet. Three-month-old C57BL/6 mice were randomized into a control group (n = 10) and a diet group (n = 10). The control group (AL) was fed AIN-93 chow, and the diet group (MR) was fed chow in which the methionine content was reduced to 15% of that in the control diet.
Effects of MR on serum biochemistry parameters in aged mice
After 2 months of dietary intervention, we tested the blood biochemical markers in mice of the OAL and OMR groups. No differences in the total protein or albumin levels were observed, indicating that MR did not cause malnutrition. The blood glucose and cholesterol levels in the OMR group were decreased compared to those in the OAL group (P < 0.05) (). Thus, MR may beneficially regulate blood glucose and lipid levels.
Table 1. Metabolic parameters and renal functions in the OAL and OMR groups
PAS staining and early kidney injury markers
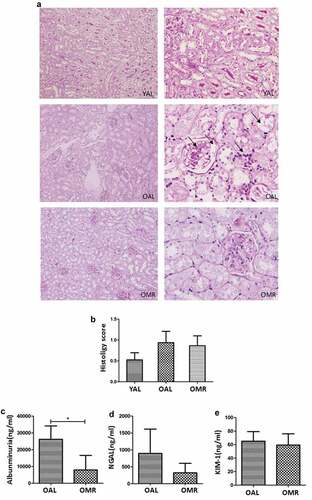
Renal PAS staining showed that mice in the OAL group exhibited structural damage characterized by glomerulosclerosis, tubulointerstitial injury, tubular atrophy, vacuolar degeneration, inflammatory cell infiltration and other pathological changes. Structural changes in mice of the OMR group occurred to a lesser degree. However, there was no significant difference in the renal histopathological scores between the two groups; this effect was likely due to the short time of MR ((a, b)). KIM-1 is an epithelial phagocytic receptor that is markedly upregulated in the proximal tubule in various forms of acute and chronic kidney injury. NGAL was originally identified in and purified from human neutrophils and is also expressed in the kidney. Pathologic or stressful conditions, such as inflammation, infection, and kidney injury, can upregulate NGAL synthesis. Urinary NGAL and Kim-1 are recently recognized biomarkers of acute injury in proximal tubular epithelial cells, and their upregulation is observable in various renal injuries [Citation21–Citation26]. Therefore, we continued to measure the levels of early-kidney injury markers in urine, such as albuminuria, KIM-1, and NGAL, in the different groups. Two months of MR could reduce the level of albuminuria in the urine of mice, while the levels of NGAL and KIM-1 were not significantly different ((c–e)).
Figure 2. Representative pictures and histology scores of glomerular and tubulointerstitial lesions based on standard procedures. (a) The black arrows indicate a fibrous crescent, cell proliferation, and glomerulosclerosis in the glomerular lesions and interstitial inflammatory cell infiltration in the tubulointerstitial lesions. MR improved glomerular and tubulointerstitial lesions. (magnification ×400) (b) Histology scores based on standard procedures were not significantly different between the OMR and OAL groups. (c-e) The levels of albuminuria, KIM-1, and NGAL in urine of different groups. The quantitative analysis included 20 random fields per mouse. The data are presented as the means ± SD (n = 6–8).
MR slows kidney senescence and suppresses the SASP
After 2 months of dietary intervention, we measured the senescence markers p16INK4a, p21, and p53 in the aging kidneys. The levels of these markers were lower in the OMR group than in the OAL group, demonstrating that initiating MR after maturity can slow kidney senescence ((a, b).
Figure 3. MR slows senescence and suppresses the SASP in the kidneys through TSP and AMPK/mTOR. (a and b) Levels of senescence markers p16, p53, p21 and IL-1β in the young group (3-month-old), control group (OAL), and diet group (OMR). (c and d) Levels of IL-1β and IL-6 in the kidneys in the young group (3-month-old), control group (OAL), and diet group (OMR). (magnification ×40) (e and f) MR increases the TSP key enzyme CGL and H2S levels. (e) Levels of the TSP key enzyme CGL in the kidneys in the young group (3-month-old), control group (OAL), and diet group (OMR). (f) Concentrations of H2S in the serum in the young group (3-month-old), control group (OAL), and diet group (OMR). *P < 0.05. (g-i) MR increases phospho-AMPK and attenuates phosphor-mTOR levels. (G) Levels of phospho-AMPK in the kidneys in the young group (3-month-old), control group (OAL), and diet group (OMR). (h-j) Levels of phospho-mTOR and its downstream target phospho-4EBP1 and phosphor-S6K in the kidneys. Three replicates were used for western blot quantification. Values are presented as means ± SD. *P < 0.05, **P < 0.01, ***P < 0.001 versus OAL. NS, not significant. (n = 6–8).
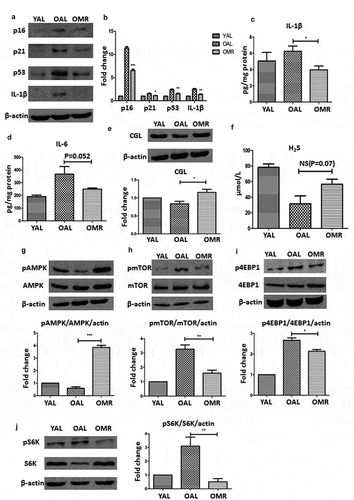
Because the SASP can accelerate cellular aging, we also assessed proteins involved in this process. To determine the extent to which MR suppressed SASP induction, we measured the levels of IL-6 and IL-1β by immunoblotting and ELISA. The kidney expression levels of IL-6 and IL-1β were lower in the OMR group than in the OAL group ((c, d)). These results suggest that MR prevents SASP induction in aging kidneys.
MR increases CGL expression and H2S levels
Methionine is the most important source of H2S, and CGL is required for the production of endogenous H2S. To determine whether the effects of MR were mediated by endogenous H2S, we measured the expression levels of the TSP enzyme CGL in the kidneys and the concentration of H2S in the serum, revealing that the CGL and H2S levels were increased significantly by MR ((e, f)). This finding suggests that endogenous H2S production was increased in our study.
MR increases phosphorylated AMP-activated protein kinase levels and attenuates mammalian target of rapamycin (mTOR) phosphorylation
In previous studies, H2S inhibited high glucose-induced matrix protein synthesis by activating AMPK in renal epithelial cells [Citation27]. In addition, mTOR, a master regulator of protein synthesis, was shown to regulate the SASP. Moreover, AMPK and mTOR both participate in aging-associated nutrient-sensing systems. Thus, we hypothesized that the effects of MR and H2S are mediated by AMPK/mTOR. MR increased phosphorylated AMPK (Thr-172) levels and decreased phosphorylated mTOR (Ser-2448) levels in the kidney. The phosphorylation levels of 4E-BP1 (Thr-36/47) and S6K (Thr-389), which are downstream of mTOR, were also significantly lower in the OMR group than in the OAL group ((g–i)). These results suggest that the protective effects of MR are associated with the upregulation of AMPK phosphorylation and the inhibition of mTOR phosphorylation.
MR slows is-induced senescence and suppresses the SASP in HK-2 cells
To determine the influence of MR on senescence, HK-2 cells were cultured under standard conditions in media with or without IS and in media with low methionine concentrations. To create the aging model, we used 250 µM IS; this concentration is comparable to the mean IS serum level in patients on hemodialysis [Citation28]. The low methionine concentration had a significant effect on IS-induced senescence. The percentage of SA β-gal-positive cells and the expression levels of p21 and p53 were lower in cells grown in IS and MR conditions than in cells grown in the IS conditions ((a–c)). In addition, the number of SA β-gal-positive cells was greater under IS conditions than under IS+MR conditions ()).
Figure 4. MR slows IS-induced senescence and suppresses the SASP in HK-2 cells. (a–c) Western blot analyses showing the levels of the senescence markers p53 and p21 in the three groups. (d) Serum-starved HK-2 cells were incubated with or without IS (250 μM) for 48 h; then, the cells were stained for SA β-gal, and the number of SA β-gal-positive cells was counted. (magnification ×400) (e and f) The levels of IL-1β and IL-6 in cell culture supernatants were analysed by ELISA. (g-i) Immunofluorescence results show IL-1β and IL-8 staining. The fluorescence intensity was lower in the IS+MR group than in the IS group. (magnification ×200). Three replicates were used for quantification. Values are presented as means ± SD. *P < 0.05, **P < 0.01.
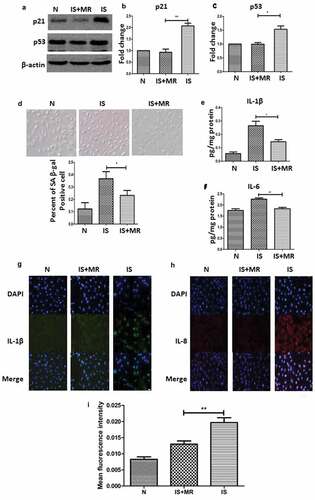
The primary components of the SASP include IL-1β, IL-6 and IL-8 [Citation29–Citation31]. To screen for induction of the SASP, we used ELISAs to measure the levels of IL-1β and IL-6 in cell culture supernatants with or without IS treatment. In addition, we also measured the levels of IL-1β and IL-8 by immunofluorescence. In the IS group, the expression levels of IL-1β, IL-6 and IL-8 were unregulated in response to IS-induced senescence ((e–h)). These results suggest that IS activated the SASP in HK-2 cells. In addition, the initiation of MR after physical maturity slowed senescence and suppressed the SASP in renal tubular epithelial cells.
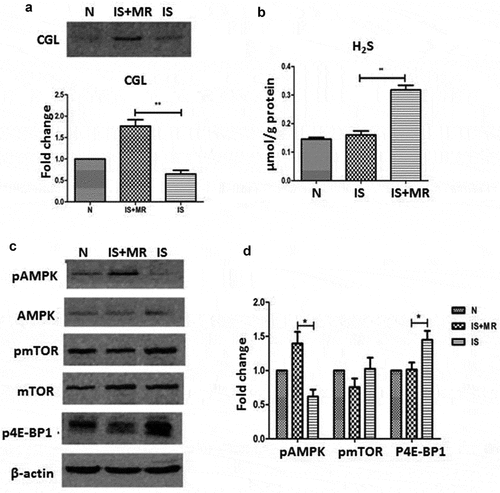
MR increases CGL expression and H2S levels and activates the AMPK pathway in HK-2 cells
We also measured the CGL and H2S levels in HK-2 cells. In our in vitro experiments, CGL and H2S levels were increased significantly by MR ((a, b)). MR also significantly increased AMPK phosphorylation levels and decreased mTOR and 4EBP1 phosphorylation levels ((c, d)). During IS-induced senescence in HK-2 cells, MR delayed senescence-related changes by increasing endogenous H2S synthesis and upregulating the AMPK pathway. These results further showed that endogenous H2S production was increased in our study and may regulate the protective effects of MR.
Figure 5. MR increases H2S production and AMPK/mTOR phosphorylation. (a) Levels of CGL assessed by Western blot; CGL activation was lower in the IS group than in the IS+MR group. (b) H2S levels were increased by MR in HK-2 cells. (c and d) Phosphorylated AMPK levels were significantly increased after MR treatment. The protein band intensities are presented as ratios compared to the intensities of the total bands; the data from the control group were arbitrarily set as 1.0. Three replicates were used for quantification. Values are presented as means ± SD.
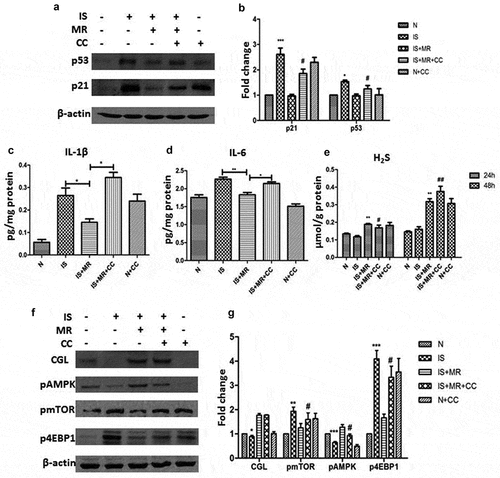
Ampk/mtor mediate the inhibition of is-induced senescence and the SASP by MR
To verify the important role of the AMPK/mTOR pathway in MR-mediated delayed senescence, we added the AMPK inhibitor compound C (CC) to the culture medium. The markers of senescence and the SASP were not different between the IS+MR+CC and IS groups ((a–d)). The effect of MR on delaying senescence was diminished when AMPK was inhibited. These results suggest that AMPK/mTOR may be an important pathway via which MR regulates antiaging and related changes. However, we still observed significantly increased CGL and H2S levels under MR. The H2S levels at 24 and 48 h were significantly increased under MR regardless of whether AMPK was inhibited ((e–g)). These data suggest that AMPK inhibition does not affect H2S production; however, whether H2S regulates AMPK remains unclear.
Figure 6. Suppression of IS-induced senescence in HK-2 cells by MR is regulated by H2S and AMPK/mTOR. Cells were incubated with 8 μM CC and with or without IS for 48 h. (a and b) Levels of the senescence markers p53 and p21 were analysed by Western blot. (c and d) Levels of IL-1β and IL-6 in cell culture supernatants were analysed by ELISA. (e) Cellular H2S concentrations. (f and g) Western blots showing changes in CGL and the AMPK/mTOR pathway. *p < 0.05,**p < 0.01,***p < 0.001 versus IS+MR. #p < 0.05 versus IS+MR.
To further confirm the effect of MR on senescence, we also analyzed this restriction in rat renal tubular cells (NRK-52E). MR delays senescence and suppresses the SASP through endogenous H2S and AMPK/mTOR (Supplement Figure 1).
Discussion
In the past few decades, DR has been shown to extend the lifespan and slow aging-related changes in human, mouse, fly, and worm models. Most kidney aging studies use rodent or mammal models, and many studies have shown that DR can delay aging-induced CKD progression, improve kidney function, and decrease kidney disease morbidity [Citation32]. Short-term DR also has a renoprotective effect on experimental cisplatin-induced AKI [Citation33], for which the major risk factor is age. Recently, studies on whether the restriction of a certain nutrient mediates the protective effects of DR have attracted more attention. However, limiting carbohydrates, lipids, or minerals alone did not significantly prolong life or inhibit tumors like overall DR [Citation34]. Most of the studies focused on protein restriction (PR) have reported significantly extended life spans [Citation35]. Although these effects are not as pronounced as those achieved with 40% DR, this finding indicates the importance of PR in overall DR. Studies have shown that PR, and particularly MR, can yield effects similar to those of DR. MR can reduce oxidative stress, improve insulin sensitivity, and prolong lifespan, but these effects are not as pronounced as those of DR [Citation9,Citation12,Citation36]. However, the specific mechanism of MR is unclear.
MR has been shown to dramatically reduce body weight and adiposity and improve insulin sensitivity in young, healthy mice [Citation37]. Therefore, the ability of MR to reverse age-induced insulin resistance and dysfunctional lipid metabolism to levels found in healthy young mice may play a role in its ability to extend lifespan [Citation38]. Recently published data for unicellular fungi indicate that the induction of autophagy is an alternative mechanism for MR-induced lifespan extension [Citation39]. The effects of MR are at least partially due to reduced oxidative stress in human diploid fibroblasts and rodents [Citation40]. Thus far, few studies have reported the impact of lifelong MR on aging and aging-related changes. We have demonstrated that lifelong MR does not have adverse effects, such as malnutrition, on rodents. Moreover, lifelong MR can increase survival rates. To a certain extent, our studies prove the important role of MR in delaying aging.
However, how MR directly or indirectly regulates the downstream pathway remains unknown, and a key molecule or trigger protein may be involved. Exogenous H2S donors, such as NaHS, can have multiple protective effects, such as inducing a suspended animation state, on rats [Citation17]; these effects, in turn, protect against global ischemia associated with severe blood loss [Citation41]. In addition, H2S has beneficial effects on metabolic syndrome [Citation42], cancer [Citation43], neurodegeneration, and multiple stress resistance [Citation44]. Our previous experiments also demonstrated that increased H2S levels were present in aged F344 rats subjected to long-term DR conditions [Citation45]. Because methionine is an important source of H2S synthesis in vivo, it is reasonable to hypothesize that MR-mediated protection occurs via H2S. Furthermore, the data reported here clearly indicate that MR indeed increased the expression levels of the TSP enzyme and the production of endogenous H2S.
While the main source of IS is dietary tryptophan conversion by intestinal flora, including Escherichia coli, IS is also generated in the liver via oxidation and sulfation. The normal excretion pathway for IS utilizes the kidneys; however, IS accumulates in the serum when renal clearance is impaired [Citation28,Citation46]. IS that accumulates in the serum is transported to renal proximal tubular cells and induces nephrotoxicity [Citation47]. Many mechanisms contribute to the nephrotoxicity induced by IS. ROS production in proximal tubular cells activates nuclear factor-kappa B (NF-κB), which in turn upregulates the expression of plasminogen activator inhibitor-1 [Citation48], p53 [Citation49], transforming growth factor (TGF)-β, α-smooth muscle actin (α-SMA), [Citation20] and monocyte chemotactic protein-1 (MCP-1) [Citation50] and downregulates the expression of klotho [Citation51]. Changes in these factors, particularly klotho and p53, also play an important role in regulating cell senescence [Citation52]. Here, we report for the first time that low levels of methionine can delay senescence in a human renal cellular model. In addition, p53 levels were significantly decreased by MR. This result suggests that MR may have a regulatory effect on the p53 pathway or a direct effect on klotho, which is upstream of p53. The age-related gene klotho suppresses the expression of multiple age-associated phenotypes to extend lifespan [Citation53]. We also measured the levels of klotho in vivo, revealing that MR increased klotho in the kidney (Supplement Figure 2(a)). Klotho is predominantly expressed in the kidneys, and its downregulation can increase oxidative stress to aggravate the renal damage induced by angiotensin II. H2S directly inhibits the activity of angiotensin converting enzyme (ACE), which catalyzes the conversion of angiotensin I to angiotensin II [Citation54]. Moreover, H2S can decrease the binding affinity of angiotensin II to the AT1 receptor and inhibit the activity of renin, which participates in the renin-angiotensin system [Citation55]. Therefore, H2S may upregulate klotho expression to extend lifespan by negatively regulating angiotensin II production. These data also demonstrate that MR may mitigate IS-induced reduced cellular senescence via H2S, which regulates klotho and, thus, p53.
Cellular senescence is defined as stable arrest of the cell cycle coupled with stereotypic phenotype changes [Citation56]. Additionally, cellular senescence is often accompanied by the SASP-induced secretion of proteins that mediate the diverse effects of senescence on the tissue microenvironment. The SASP involves many secreted factors, such as cytokines and matrix metalloproteinases [Citation57], and this proinflammatory secretome may contribute to senescence. Kidney aging cannot be separated from cell senescence. In recent years, the SASP has attracted attention as a cell senescence phenotype and can potentially explain how senescent cells alter tissue microenvironments, attract immune cells, and induce malignant phenotypes in nearby cells through the inflammatory, growth-promoting, and remodeling factors that it produces. However, the regulatory mechanism of the SASP is not fully understood. Salminen and colleagues have shown that NF-κB, C/EBPβ, and p38 MAPK can regulate SASP secretion [Citation58]. mTOR, a master regulator of protein synthesis, has recently been shown to control the SASP by modulating gene transcription and mRNA translation and stabilization [Citation59]. Rapamycin increases IL-6 and other cytokine mRNA levels but selectively suppresses the translation of the membrane-bound cytokine IL-1A. Reduced IL-1A levels suppress NF-KB transcriptional activity, which controls much of the SASP [Citation30]. The mRNA level of IL-1A was also lower in the OMR group in our study (Supplement Figure 2(b)). mTOR also controls the SASP by differentially regulating the translation of MK2 kinase through 4EBP1. In turn, MK2 phosphorylates the RNA-binding protein ZFP36L1 during senescence and inhibits its ability to degrade the transcripts of numerous SASP components [Citation31]. With age progression, AMPK is downregulated, whereas mTOR is activated. Because MR can suppress the SASP and delay senescence through endogenous H2S and because AMPK/mTOR is the common pathway for aging and the SASP, a link between endogenous H2S levels and AMPK/mTOR must exist. Our findings demonstrate that the increase in endogenous H2S upregulated AMPK and inhibited mTOR, 4EBP1 and S6K. The effects of exogenous H2S on AMPK were described [Citation60]. But our study demonstrated that endogenous H2S elevation induced by MR can also regulate AMPK. The source of H2S is different. This is one of the innovations of this study is that MR can regulate H2S-AMPK axis and then perform downstream functions. However, the specific mechanism of the interaction between H2S and AMPK is not clear. Lee et al. found that under high-glucose conditions, mammalian target of rapamycin complex 1 (mTORC1) activation, shown by the phosphorylation of p70S6 kinase and 4E-BP1, was inhibited by NaHS, an H2S donor. The authors also found that CaMKKβ, the major kinase involved in AMPK phosphorylation, may be activated by NaHS [Citation27]. Using molecular docking predictions, 23 binding sites in the AMPK protein were found to potentially bind H2S; these results prompted an investigation into the importance of AMPK to the effects of H2S [Citation61].
Conclusion
Taken together, the results reported herein demonstrate that a lifelong reduced methionine diet extends the lifespan of rodents and suggest that endogenous H2S contributes to lifespan extension. We have also demonstrated that the effects of endogenous H2S on prolonging lifespan and suppressing the SASP are mediated by the inhibition of mTOR by AMPK. These findings extend our mechanistic understanding of how MR can influence senescence at the cellular level. The results also provide new evidence of the renal protective effects of H2S. Moreover, the data provide a new intervention for clinicians to slow the progression of CKD in patients with this disease.
Supplemental Material
Download Zip (74.3 KB)Acknowledgments
This work was supported by the National Key R&D Program of China (2018YFA0108803), the Science and Technology Project of Beijing (D181100000118004), the 973 Program (2013CB530800), the Twelfth Five-Year National Key Technology Research and Development Program (2015BAI12B06 and 2013BAI09B05), and the 973 Program [2013CB530800].
Disclosure statement
No potential conflict of interest was reported by the authors.
Supplementary material:
Supplemental data for this article can be accessed here.
Additional information
Funding
Related Research Data
References
- Coresh J, Selvin E, Stevens LA, et al. Prevalence of chronic kidney disease in the United States. Jama. 2007;298:2038–2047.
- Zhang L, Wang F, Wang L, et al. Prevalence of chronic kidney disease in China: a cross-sectional survey. Lancet. 2012;379:815–822.
- Minutolo R, Borrelli S, De Nicola L. CKD in the elderly: kidney senescence or blood pressure-related nephropathy? Am J Kidney Dis. 2015;66:184–186.
- Coresh J, Astor BC, Greene T, et al. Prevalence of chronic kidney disease and decreased kidney function in the adult US population: third national health and nutrition examination survey. Am J Kidney Dis. 2003;41:1–12.
- Latcha S, Jaimes EA, Patil S, et al. Long-term renal outcomes after cisplatin treatment. Clin J Am Soc Nephrol. 2016;11:1173–1179.
- Mccay CM, Crowell MF, Maynard LA. The effect of retarded growth upon the length of life span and upon the ultimate body size. Nutrition. 1989;5:63–79.
- Orentreich N, Matias JR, DeFelice A, et al. Low methionine ingestion by rats extends life span. J Nutr. 1993;123:269–274.
- Sun L, Sadighi Akha AA, Miller RA, et al. Life-span extension in mice by preweaning food restriction and by methionine restriction in middle age. J Gerontol A Biol Sci Med Sci. 2009;64:711–722.
- Sanz A, Caro P, Ayala V, et al. Methionine restriction decreases mitochondrial oxygen radical generation and leak as well as oxidative damage to mitochondrial DNA and proteins. Faseb J. 2006;20:1064–1073.
- Liu H, Zhang W, Wang K, et al. Methionine and cystine double deprivation stress suppresses glioma proliferation via inducing ROS/autophagy. Toxicol Lett. 2015;232:349–355.
- Kozieł R, Ruckenstuhl C, Albertini E, et al. Methionine restriction slows down senescence in human diploid fibroblasts. Aging Cell. 2015;13:1038–1048.
- Stone KP, Wanders D, Orgeron M, et al. Mechanisms of increased in vivo insulin sensitivity by dietary methionine restriction in mice. Diabetes. 2014;63:3721–3733.
- Hine C, Harputlugil E, Zhang Y, et al. Endogenous hydrogen sulfide production is essential for dietary restriction benefits. Cell. 2015;160:132–144.
- Yang G, Wu L, Jiang B, et al. H2S as a physiologic vasorelaxant: hypertension in mice with deletion of cystathionine gamma-lyase. Science (New York, NY). 2008;322:587–590.
- Paul BD, Snyder SH. H(2)S signalling through protein sulfhydration and beyond. Nat Rev Mol Cell Biol. 2012;13:499–507.
- Miller DL, Roth MB. Hydrogen sulfide increases thermotolerance and lifespan in Caenorhabditis elegans. Proc Natl Acad Sci U S A. 2007;104:20618–20622.
- Blackstone E, Morrison M, Roth MB. H2S induces a suspended animation-like state in mice. Science (New York, NY). 2005;308:518.
- Buemi M, Nostro L, Aloisi C, et al. Kidney aging: from phenotype to genetics. Rejuvenation Res. 2005;8:101–109.
- Melk A, Schmidt BM, Takeuchi O, et al. Expression of p16INK4a and other cell cycle regulator and senescence associated genes in aging human kidney. Kidney Int. 2004;65:510–520.
- Shimizu H, Bolati D, Adijiang A, et al. NF-kappaB plays an important role in indoxyl sulfate-induced cellular senescence, fibrotic gene expression, and inhibition of proliferation in proximal tubular cells. Am J Physiol Cell Physiol. 2011;301:C1201–12.
- Han WK, Bailly V, Abichandani R, et al. Kidney Injury Molecule-1 (KIM-1): a novel biomarker for human renal proximal tubule injury. Kidney Int. 2002;62::237–244.
- Mishra J, Dent C, Tarabishi R, et al. Neutrophil gelatinase-associated lipocalin (NGAL) as a biomarker for acute renal injury after cardiac surgery. Lancet. 2005;365:1231–1238.
- Nickolas TL, O’Rourke MJ, Yang J, et al. Sensitivity and specificity of a single emergency department measurement of urinary neutrophil gelatinase-associated lipocalin for diagnosing acute kidney injury. Ann Intern Med. 2008;148:810–819.
- Srisawat N, Murugan R, Lee M, et al. Plasma neutrophil gelatinase-associated lipocalin predicts recovery from acute kidney injury following community-acquired pneumonia. Kidney Int. 2011;80:545–552.
- Carlsson AC, Larsson A, Helmersson‐Karlqvist J, et al. Urinary kidney injury molecule 1 and incidence of heart failure in elderly men. Eur J Heart Fail. 2013;15::441–446.
- Humphreys BD, Xu F, Sabbisetti V, et al. Chronic epithelial kidney injury molecule-1 expression causes murine kidney fibrosis. J Clin Invest. 2013;123:4023–4035.
- Lee HJ, Mariappan MM, Feliers D, et al. Hydrogen sulfide inhibits high glucose-induced matrix protein synthesis by activating AMP-activated protein kinase in renal epithelial cells. J Biol Chem. 2012;287:4451–4461.
- Niwa T, Ise M. Indoxyl sulfate, a circulating uremic toxin, stimulates the progression of glomerular sclerosis. J Lab Clin Med. 1994;124:96–104.
- Rodier F, Campisi J. Four faces of cellular senescence. J Cell Biol. 2011;192:547–556.
- Laberge RM, Sun Y, Orjalo AV, et al. MTOR regulates the pro-tumorigenic senescence-associated secretory phenotype by promoting IL1A translation. Nat Cell Biol. 2015;17:1049–1061.
- Herranz N, Gallage S, Mellone M, et al. mTOR regulates MAPKAPK2 translation to control the senescence-associated secretory phenotype. Nat Cell Biol. 2015;17:1205–1217.
- Xu XM, Cai GY, Bu R, et al. Beneficial effects of caloric restriction on chronic kidney disease in rodent models: a meta-analysis and systematic review. PloS One. 2015;10:e0144442.
- Ning YC, Cai GY, Zhuo L, et al. Beneficial effects of short-term calorie restriction against cisplatin-induced acute renal injury in aged rats. Nephron Exp Nephrol. 2013;124:19–27.
- Shimokawa I, Higami Y, Yu BP, et al. Influence of dietary components on occurrence of and mortality due to neoplasms in male F344 rats. Aging. 1996;8:254–262.
- Sanchez-Roman I, Barja G. Regulation of longevity and oxidative stress by nutritional interventions: role of methionine restriction. Exp Gerontol. 2013;48:1030–1042.
- Ying Y, Yun J, Guoyao W, et al. Dietary L-methionine restriction decreases oxidative stress in porcine liver mitochondria. Exp Gerontol. 2015;65:35–41.
- Hasek BE, Boudreau A, Shin J, et al. Remodeling the integration of lipid metabolism between liver and adipose tissue by dietary methionine restriction in rats. Diabetes. 2013;62:3362–3372.
- Lees EK, Krol E, Grant L, et al. Methionine restriction restores a younger metabolic phenotype in adult mice with alterations in fibroblast growth factor 21. Aging Cell. 2014;13:817–827.
- Ruckenstuhl C, Netzberger C, Entfellner I, et al. Lifespan extension by methionine restriction requires autophagy-dependent vacuolar acidification. PLoS Genet. 2014;10:e1004347.
- Dowling RJ, Zakikhani M, Fantus IG, et al. Metformin inhibits mammalian target of rapamycin-dependent translation initiation in breast cancer cells. Cancer Res. 2007;67:10804–10812.
- Morrison ML, Blackwood JE, Lockett SL, et al. Surviving blood loss using hydrogen sulfide. J Trauma. 2008;65:183–188.
- Xue R, Hao DD, Sun JP, et al. Hydrogen sulfide treatment promotes glucose uptake by increasing insulin receptor sensitivity and ameliorates kidney lesions in type 2 diabetes. Antioxid Redox Signal. 2013;19:5–23.
- Lee ZW, Teo XY, Tay EY, et al. Utilizing hydrogen sulfide as a novel anti-cancer agent by targeting cancer glycolysis and pH imbalance. Br J Pharmacol. 2014;171:4322–4336.
- Wen YD, Wang H, Kho SH, et al. Hydrogen sulfide protects HUVECs against hydrogen peroxide induced mitochondrial dysfunction and oxidative stress. PloS One. 2013;8:e53147.
- Wang WJ, Cai GY, Ning YC, et al. Hydrogen sulfide mediates the protection of dietary restriction against renal senescence in aged F344 rats. Sci Rep. 2016;6:30292.
- Niwa T, Ise M, Miyazaki T. Progression of glomerular sclerosis in experimental uremic rats by administration of indole, a precursor of indoxyl sulfate. Am J Nephrol. 1994;14:207–212.
- Enomoto A, Takeda M, Tojo A, et al. Role of organic anion transporters in the tubular transport of indoxyl sulfate and the induction of its nephrotoxicity. J Am Soc Nephrol. 2002;13:1711–1720.
- Motojima M, Hosokawa A, Yamato H, et al. Uremic toxins of organic anions up-regulate PAI-1 expression by induction of NF-kappaB and free radical in proximal tubular cells. Kidney Int. 2003;63:1671–1680.
- Shimizu H, Bolati D, Adijiang A, et al. Senescence and dysfunction of proximal tubular cells are associated with activated p53 expression by indoxyl sulfate. Am J Physiol Cell Physiol. 2010;299:C1110–7.
- Shimizu H, Bolati D, Higashiyama Y, et al. Indoxyl sulfate upregulates renal expression of MCP-1 via production of ROS and activation of NF-kappaB, p53, ERK, and JNK in proximal tubular cells. Life Sci. 2012;90:525–530.
- Shimizu H, Bolati D, Adijiang A, et al. Indoxyl sulfate downregulates renal expression of Klotho through production of ROS and activation of nuclear factor-kB. Am J Nephrol. 2011;33:319–324.
- Ikushima M, Rakugi H, Ishikawa K, et al. Anti-apoptotic and anti-senescence effects of Klotho on vascular endothelial cells. Biochem Biophys Res Commun. 2006;339:827–832.
- Sun Z. Current understanding of klotho. Ageing Res Rev. 2009;8:43–51.
- Yoon HE, Ghee JY, Piao S, et al. Angiotensin II blockade upregulates the expression of Klotho, the anti-ageing gene, in an experimental model of chronic cyclosporine nephropathy. Nephrol Dialysis Trans. 2011;26:800–813.
- Lu M, Liu YH, Goh HS, et al. Hydrogen sulfide inhibits plasma renin activity. J Am Soc Nephrol. 2010;21:993–1002.
- Campisi J, d’Adda Di Fagagna F. Cellular senescence: when bad things happen to good cells. Nat Rev Mol Cell Biol. 2007;8:729–740.
- Kuilman T, Michaloglou C, Mooi WJ, et al. The essence of senescence. Genes Dev. 2010;24:2463–2479.
- Salminen A, Kauppinen A, Kaarniranta K. Emerging role of NF-kappaB signaling in the induction of senescence-associated secretory phenotype (SASP). Cell Signal. 2012;24:835–845.
- Tomimatsu K, Narita M. Translating the effects of mTOR on secretory senescence. Nat Cell Biol. 2015;17:1230–1232.
- Wang M, Tang W, Zhu YZ. An update on AMPK in hydrogen sulfide pharmacology. Front Pharmacol. 2017;8:810.
- Sun L, Zhang S, Yu C, et al. Hydrogen sulfide reduces serum triglyceride by activating liver autophagy via the AMPK-mTOR pathway. Am J Physiol Endocrinol Metab. 2015;309:E925–35.