
ABSTRACT
The objective of this study was to evaluate replicative senescence of bovine granulosa cells (bGCs) during in vitro long-term culture. WST-1 assay analysis showed that bGCs proliferation was reduced from primary culture to 14th passage. The several bGCs from the 3rd passage and 7th passage exposed the weak activity of beta-galactosidase, while a strongly positive staining of beta-galactosidase was observed in bGCs from 14th passage. Flow cytometry analysis showed that bGCs were induced to cell cycle arrest at G0/G1 phase through in vitro expansion. TERT transcript expression of bGCs was downregulated from primary culture to 14th passage. The cell and nuclear area of bGCs were dramatically increased from 14th passage to 25th passage. The nucleocytoplasmic ratio of bGCs was dramatically reduced in 22th passage (4.32%) and 25th passage (2.45%), comparing to previous passages: primary culture (10.67%), 7th passage (9.21%), or 14th passage (10.33%). The number of microfilament bundle of bGCs was increased in 22nd passage (67.42 ± 17.76) and 25th passage (56.31 ± 22.45). The diameter of microfilament bundle of bGCs in 25th passage was dramatically increased to 1.88 ± 0.32 µm comparing to the primary culture (1.15 ± 0.03 µm). In this study, we also assessed the nuclear form factor which illustrates the level of nuclear circular form. A reduction of nuclear form factor was observed in bGCs during long-term in vitro expansion. The changes of nuclear form factor were correlated to other senescent characteristics, especially the nucleocytoplasmic ratio.
1. Introduction
The somatic cells of almost species could not in vitro expand indefinitely [Citation1,Citation2]. This property, termed replicative senescence, is a final pathway for actively dividing cells [Citation3,Citation4]. Replicative senescence indicates the aging phenomenon of cells during long-term in vitro cultures, including physiological, structural, biochemical and molecular changes of the cells [Citation5]. Replicative senescence is commonly studied in cell culture, where cell proliferation can be monitored [Citation2]. Cells cultured from old donors show a propensity of senescence after fewer population doublings than young donors [Citation2], suggesting that cells with high replicative potential are a good model for senescence evaluation. Replicative senescence is determined by a series of biomarkers [Citation3]. One of the most recognizable biomarkers is growth arrest, in which cells stop dividing and fail to initiate DNA synthesis [Citation3]. In this case, the growth factor could not induce cell division, despite the fact that senescent cells still maintain metabolic activity in sufficient growth conditions for a long time [Citation3,Citation6]. Another important biomarker of senescence is morphological changes. During in vitro expansion, the senescent cells expose a drastic increase in cellular and nuclear size [Citation7]. Nuclear area enlargement induces deformation of nuclear shape or nuclear circular form which could be measured by nuclear form factor. Nuclear form factor, or nuclear shape index, was first mentioned in the study of spatial coordination between cell and nuclear shape within micropatterned endothelial cells [Citation8]. However, the modification of nuclear form factor during replicative senescence has been unclear.
The GCs have been recently received great attention because of their potential. Some stemness characteristics were observed in granulosa cells such as high telomerase activity [Citation9], expression of pluripotent markers including Nanog, Oct4 [Citation10], differentiation into osteoblast [Citation11]. During the follicular development, bGCs showed a net from 19 to 21 doublings, while the in vitro expansion of bGCs has been unclear [Citation12]. Therefore, bGCs can be considered as a good model to assess the in vitro replicative senescence. The current study investigated the characteristics changes of replicative senescence in bGCs during long-term in vitro expansion.
2. Results
2.1. Cell proliferation assay
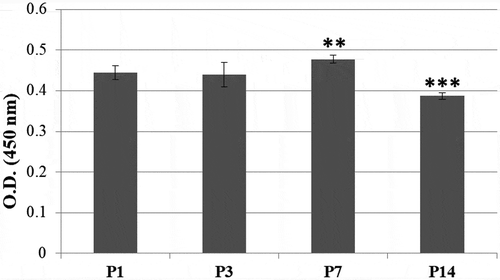
The bGCs from 1st passage, 3rd passage, 7th passage, and 14th passage were used to estimate the growth and viability by WST-1 assay. As seen in , there was no statistically significant difference of absorbance values of bGCs between 1st passage and 3rd passage. The absorbance values of bGCs from 7th passage were higher than other groups (P < 0.01). In the 14th passage, the bGCs exposed a reduced absorbance values, comparing to the previous passage (P < 0.001). This result demonstrated that bGCs proliferation was reduced through in vitro expansion.
Figure 1. bGCs viability from in vitro expansion. P1, P3, P7, and P14: bGCs from the 1st passage, 3rd passage, 7th passage, and 14th passage. ***P < 0.001, P14 vs. other groups, **P < 0.01, P7 vs. (P1 and P3).
2.2. Beta-galactosidase assay
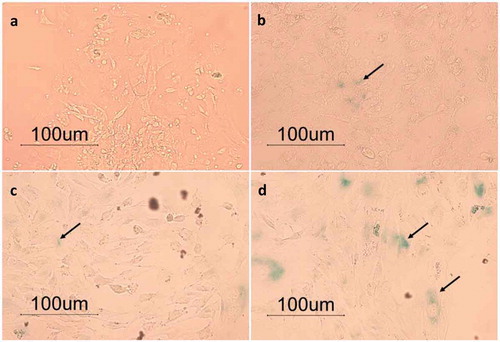
The bGCs from 1st passage, 3rd passage, 7th passage, and 14th passage were also used for assessing beta-galactosidase activity. The result showed that bGCs from 1st passage exposed a negative staining for beta-galactosidase (). There were several bGCs from the 3rd passage and 7th passage showed the positive staining for beta-galactosidase as evidence by blue color areas within the cells (). A strongly positive staining for beta-galactosidase was observed in bGCs from 14th passage (). These data revealed that the replicative senescence was appeared in bGCs from late passages.
Figure 2. Senescence-associated beta-galactosidase staining. (a-d): bGCs from the 1st passage, 3rd passage, 7the, and 14th passage (200X total magnification).
2.3. Cell cycle analysis
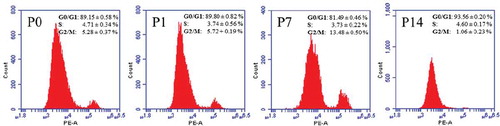
The effects of in vitro expansion on bGCs cycle progression were estimated by flow cytometry analysis. There was no statistically significant difference of bGCs ratio in G0/G1 phase between primary culture (89.15% ± 0.58%) and 1st passage (89.80 ± 0.82%) (). The percentage of bGCs of 7th passage in G0/G1 phase (81.49% ± 0426%) was lower than primary culture and 1st passage (P < 0.001). The ratio of bGCs in G0/G1 phase from 14th passage (93.56% ± 0.20%) was significantly increased, comparing to other previous passages (P < 0.001). These data suggested that bGCs could be induced to cell cycle arrest phase by in vitro expansion.
Figure 3. Flow cytometry analysis of bGCs. P0, P1, P7, and P14: cycle distributions of bGCs from the primary culture, 1st passage, 7th passage, and 14th passage.
2.4. TERT transcript expression
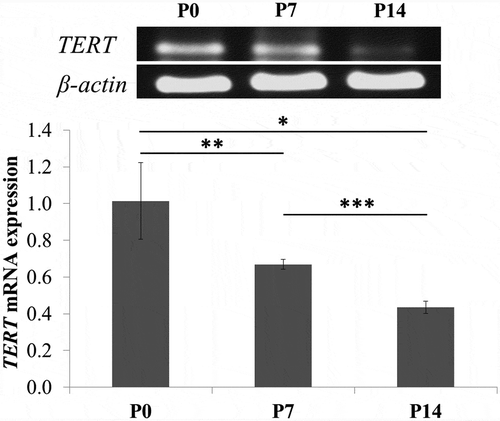
bGCs from primary culture, 7th passage, and 14th passage were used for estimation of TERT mRNA expression. The qRT-PCR showed that TERT mRNA expression of bGCs was downregulated in over increasing passages ().
Figure 4. Detection of TERT gene expression level by qRT-PCR. TERT mRNA expression of bGCs was downregulated from primary culture to 14th passage. *P < 0.05, P0 vs. P1; **P < 0.01, P0 vs. P7; ***P< 0.001, P7 vs. P14.
2.5. Cellular morphology evaluation
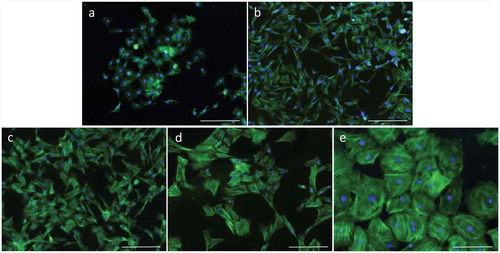
In this study, bGCs could be in vitro expanded more than 25 passages. There was no difference of bGC area between primary culture and 7th passage (). The bGCs from 14th passage appeared both enlarged and flattened out. The cytoplasmic enlargement was increased in late passages, leading to a dramatic increase in bGC area from 14th passage to 25th passage (). The bGC area of 22nd passage (8108.56 ± 3740.73 µm2) was 5.2-fold higher than bGCs from primary culture (1552.18 ± 284.42 µm2). The area of 25th passage bGCs (23,535.49 ± 7449.30 µm2) was 15.1-fold higher than bGCs from primary culture. Furthermore, the bGC area in late passages (SD = 7449.30 from 25th passage bGCs) was much more heterogeneous than the early passages (SD = 284.42 from bGCs of primary culture).
Table 1. The area changes of cell and nuclear during in vitro expansion.
The nuclear area enlargement was observed in bGCs from 14th passage to 25th passage (). The nuclear area of bGCs in 22nd passage (317.33 ± 13.90 µm2) was increased by 1.9 times comparing with primary bGCs. The nuclear area of bGCs in 25th passage (576.46 ± 26.42 µm2) was 3.5-fold higher than primary bGCs.
illustrates the distribution of microfilament bundles in bGCs during in vitro expansion. The young bGCs showed a few microfilament bundles which scattered in cytoplasm. The numbers of microfilament bundles were significantly increased in the old bGCs (). The number of microfilament bundles of bGCs in primary culture, 7th passage, and 14th passage were 4.57 ± 1.70, 4.64 ± 2.20, and 11.71 ± 5.22, respectively. The number of microfilament bundles of bGCs from 22nd passage was raised to 67.42 ± 17.76 which was 14.8-fold higher than primary bGCs. However, the bGCs in 25th passage showed a reduced number of microfilament bundles (56.31 ± 22.45). In this study, the diameters of microfilament bundles were measured from the patterns of actin immunofluorescent staining. The bGCs also showed a slight increase in microfilament bundle diameter from primary culture to 22nd passage (). The diameter of microfilament bundle of bGCs in 25th passage was dramatically increased to 1.88 ± 0.32 µm.
Table 2. The changes of microfilament bundles in bGCs during in vitro expansion.
Figure 5. The morphological changes of bGCs during in vitro expansion. (a-e): bGCs from the primary culture, 7th passage, 14th passage, 22nd passage, and 25th passage. Actin filament was stained with Phalloidin CruzFluor™ 488 Conjugate (green) and nuclear was stained with DAPI (blue). Scale bar = 223.64 µm.
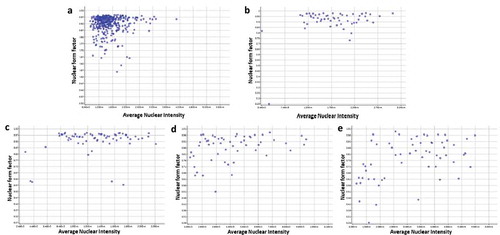
Here, we also assessed the bGCs nuclear shape from different passage by using nuclear form factor (1.0 = circle, <1.0 = non-circlular) (). The result demonstrated that there was no significant difference of nuclear form factor of bCGs in primary culture, 7th passage and 14th passage (). This value was decreased from 22nd passage (0.82 ± 0.04) to 25th passage (0.78 ± 0.05). demonstrates the nuclear shape distribution in relationship with nuclear intensity. The nuclear form factors were nearly distributed to value 1 from primary culture to 14th passage (). The bGCs from 22nd passage and 25th passage show the lower nuclear form factor and the higher nuclear intensity than bGCs from previous passage.
Figure 6. The nuclear form factor distribution of bGCs during in vitro expansion (generated by Cell Cycle Apps of Cytell). (a-e) nuclear form factor of bGCs from primary culture, 7th passage, 14th passage, 22nd passage, and 25th passage.
3. Discussion
The lack of regenerative ability is the characteristics of tissue aging [Citation13]. The senescent cells accumulate in various tissues over times, and have been considered to play an important role in aging [Citation14]. The age-associated changes of bGCs have been reported in previous in vivo studies. The number of bGCs in the antral follicles of aged cows is lower than young cows [Citation15]. The bGCs in antral follicles of young cows showed a higher proliferation than aged cows [Citation16]. Additionally, the reduction of telomere length is observed in bGCs of both early antral follicles and antral follicles from aged cows [Citation17]. The lack of regenerative potential of bGCs was also observed in our in vitro study, as demonstrated by the reduced proliferation and the elevated cell cycle arrest in G0/G1 phase of bGCs in 14th passage. Moreover, the present results showed that bGCs exposed the reduction of TERT expression and an increase of beta-galactosidase activity from 7th passage to 14th passage, suggesting that bGCs underwent replicative senescence during long-term in vitro culture.
The replicative senescent gave a rise of phenotypic changes of bGCs, including the enlargement of cells and nuclear, and the presence of large actin filament bundles in cytoplasm [Citation18]. The bGCs maintained homogeneous morphology in early passages. The cytoplasmic enlargement induced the polymorphotypes of bGC populations in late passages. The bGCs from 25th passage was strongly expanded and showed varying degrees of location in cytoplasm. They were bigger and more morphotypic than bGCs in early passages. Thus, bGCs sustained a progressive morphological change during in vitro expansion. This is an important biomarker for replicative senescence [Citation19]. Furthermore, the cytoplasmic enlargement during in vitro expansion also resulted in an enhanced organization and abundance of actin microfilament bundles in bGCs. The senescent bGCs exposed multiple arrays of microfilament bundles which spread through the length of the cells. Our results were consistent to an opinion which shows an opposite relationship between cell area and their proliferation during in vitro culture [Citation20].
The nuclear size might be an important factor which accommodates with nucleus components, including the nucleolus, enzymes such as DNA polymerase, and macromolecules [Citation21–Citation23]. The previous study revealed that there is one or more cellular factors which effect on nuclear size [Citation24]. The genomic size is an important component of nuclear but is not a factor which effects on nuclear size, thence, nuclear size is determined by cytoplasmic volume rather than DNA content [Citation24]. In this study, the nuclear area of bGCs was dramatically increased in 14th passage and 25th passage, revealing that these bGCs exposed an enhancement of transcription which was required in larger cells [Citation24].
Senescence during in vitro culture results in a dramatic increase in cellular and nuclear size, which leads to change nucleocytoplasmic ratio. Therefore, a measure of nucleocytoplasmic ratio is considered as a good indicator to assess senescent state of cells population [Citation7]. In this study, the cell area and nuclear area were all increased during in vitro expansion. The nucleocytoplasmic ratio was dramatically reduced from 7th passage to 25th passage. Under in vitro condition, the nucleocytoplasmic ratio value is approximately 10% [Citation7]. This revealed that bGCs cytoplasmic enlargement was much stronger than nuclear, leading to a decrease in nucleocytoplasmic ratio value.
Moreover, we found that there was a correlation between the nuclear size enlargement and nuclear form factor. It has been proposed that the nuclear size plays an important role in cell function and the nucleocytoplasmic ratio is crucial for cell integrity, it contributes to modulate the cell cycle [Citation25,Citation26]. In the present study, the nuclear form factor was decreased following the increase of nuclear area. This result suggested that nuclear size also plays an important role to determine nuclear circular form which could be considered as a good morphological indicator for replicative senescence evaluation.
4. Materials and methods
4.1. Cells culture
Bovine ovaries were obtained from slaughterhouses and transported to the laboratory within 3 h. They were kept in 0.9% normal saline. The dissection method was applied to collect single bovine follicles under a stereomicroscope (Meiji, Japan). Single bovine follicles were washed in PBS (phosphate-buffered saline, Gibco, Germany). The fresh bGCs were collected from these above follicles by aspiration and the oocyte-cumulus complexes were removed. The bGCs were cultured Dulbecco’s Modified Eagle Medium (Gibco, Germany) supplemented with 10% fetal bovine serum (Gibco, Germany) and 1% antibiotic (penicillin/streptomycin; Gibco, Germany). The bGCs were passaged at a split ratio 1:2.
4.2. Cell proliferation assay
bGCs were seeded to 96-well plate with density at 5 × 10³ cells/well. After 72 h, cell viability was assessed using the WST-1 kit (05015944001, Roche, Germany). 10 μl of WST1 was added to each of the wells containing bGCs . Cells were incubated with WST-1 for 3.5 h, then measured at 450 nm by GloMax® Explorer Multimode Microplate Reader (Promega, United States)
4.3. β-Galactosidase assay
The activity of β-Galactosidase in bGCs was detected by beta-Galactosidase Detection Kit (ab102534, Abcam, United States). Cells were washed twice with cold PBS and fixed with 0.5 mL of Fixative Solution for 15 min at room temperature. Cells were washed twice with cold PBS and incubated overnight at 37°C with 0.5 mL Staining Solution Mix (470 µL Staining Solution, 5 µl Staining Supplement, and 25 µL 1X X-gal in DMF). Cells were observed under a microscope for the development of blue color (200X total magnification).
4.4. Flow cytometry analyses
Cell cycle and apoptosis were assessed by flow cytometry using FITC Annexin V Apoptosis Detection Kit I (556547, BD Biosciences, United States). Cells were washed twice with cold PBS and resuspended in 100 µL 1X Binding Buffer into 1.5 mL tube. 5 µL of FITC Annexin V and 5 µL PI were added to cells. Cells were gently vortexed and incubated for 15 min at RT (25°C) in the dark. 400 µL of 1X Binding Buffer was added to each tube. Cells were analyzed within 1 h by BD Accuri C6 Plus (BD Biosciences, United States).
4.5. Quantitative real-time RT-PCR
Total RNA of bGCs was extracted by a RibospinTM Total RNA Purification Kit (3033523, GeneAll Biotechnology, South Korea). PikoReal 96 Real-Time PCR System (Thermo Scientific, United States) was used for qRT-PCR with SyGreen 1-Step Lo-ROX kit (Biosystem, England). Primers were as follows: telomerase reverse transcriptase (TERT), F 5ʹ-TGT CTG ACG CCC AGG CGC T-3ʹ and R 5ʹ-GAT GAA GGT GCA GGA CTG CG-3ʹ [Citation27]; β-actin, F 5ʹ-GGA ATC CTG TGG CAT CCA TGA AAC-3ʹ and R 5ʹ-AAA ACG CAG CTC AGT AAC AGT CCG-3ʹ [Citation28]. qRT-PCR was conducted in 20 μL for each reaction, including 1 μL of total RNA, 2 μL of primers (forward and reverse), 10 μL 2X Mix Ro-Lox, 1 μL RTAse, and 6 μL dH2O. The qRT-PCR reactions were performed by one cycle of 45°C for 15 min, one cycle of 95°C for 2 min, 40 cycles of 95°C for 10 sec, 60°C for 15 sec, and 71 cycles of 60°C for 15 sec. The 2−∆∆Ct method was applied for Ct value analysis [Citation29]. PCR products were electrophoresed on a 1% agarose gel and stained with GelRed (Biotium, United States). The gel was exposed to UV light and the picture taken with a gel documentation system (Infinity, Vilber Lourmat, France).
4.6. Actin filament and nucleus staining
The bGCs were fixed with 4% paraformaldehyde in PBS (Nacalai, Japan) at room temperature for 30 min, then permeabilized with 0.1% Triton X-100 in PBS (Merck, Germany) at room temperature for 30 min. The bGCs were washed with PBS three times in 5 min for each step. Actin filament was stained with Phalloidin CruzFluor™ 488 Conjugate (Santa Cruz Biotechnology, United States). The bGC nucleus was stained with 4′,6-Diamidino-2-phenylindole dihydrochloride (DAPI) (Sigma, United States) for 30 min and were washed with PBS three times in 5 min for each step. The stained bGCs were observed under Cytell microscope (GE Healthcare, United States) to assess microfilament bundle changes.
4.7. Area measurement
ImageJ software (National Institutes of Health, Bethesda, MD) was applied to measure cell and nuclear areas and microfilament bundle diameter. The number of microfilament bundle was manually detected. Color images were converted grayscale (type 8 bit) then subjected to the threshold function using the same threshold for all images to remove background noise and autofluorescence, and then the area and diameter were measured. Nuclear form factors were measured using the Cell Cycle Apps from Cytell (GE Healthcare, United States).
4.8. Statistical analysis
The data were analyzed for statistical significance by one-way ANOVA where P <0.05 was considered statistically significant.
Disclosure statement
No potential conflict of interest was reported by the authors.
Additional information
Funding
References
- Hayflick L, Moorhead PS. The serial cultivation of human diploid cell strains. Exp Cell Res. 1961;25:585–621. PMID:13905658.
- Dimri GP, Lee X, Basile G, et al. A biomarker that identifies senescent human cells in culture and in aging skin in vivo. Proc Natl Acad Sci U S A. 1995;92(20):9363–9367. PMID:7568133.
- Campisi J, d’Adda di Fagagna F. Cellular senescence: when bad things happen to good cells. Nat Rev Mol Cell Biol. 2007;8:729–740. PMID:17667954.
- Chen H, Li Y, Tollefsbol TO. Cell senescence culturing methods. Methods Mol Biol. 2013;1048. PMID:23929093. DOI:10.1007/978-1-62703-556-9_1.
- Van Deursen JM. The role of senescent cells in ageing. Nature. 2014;509(7501):439–446. PMID:24848057.
- Goldstein S. Replicative senescence: the human fibroblast comes of age. Science. 1990;249(4973):1129–1133. PMID:2204114.
- Filippi-Chiela EC, Oliveira MM, Jurkovski B, et al. Nuclear morphometric analysis (NMA): screening of senescence, apoptosis and nuclear irregularities. PLoS One. 2012;7(8):e42522. PMID:22905142.
- Versaevel M, Grevesse T, Gabriele S. Spatial coordination between cell and nuclear shape within micropatterned endothelial cells. Nat Commun. 2012;3(671):1–11. PMID:22334074.
- Lavranos TC, Mathis JM, Latham SE, et al. Evidence for ovarian granulosa stem cells: telomerase activity and localization of the telomerase ribonucleic acid component in bovine ovarian follicles. Biol Reprod. 1999;61(2):358–366. PMID:10411512.
- Mattioli M, Gloria A, Turriani M, et al. Osteo-regenerative potential of ovarian granulosa cells: an in vitro and in vivo study. Theriogenology. 2012;77(7):1425–1437. PMID:22284224.
- Oki Y, Ono H, Motohashi T, et al. Dedifferentiated follicular granulosa cells derived from pig ovary can transdifferentiate into osteoblasts. Biochem J. 2012;447(2):239–248. PMID:22839299.
- Rodgers RJ, Irving-Rodgers HF. Morphological classification of bovine ovarian follicles. Reproduction. 2010;139(2):309–318. PMID:19786400.
- Velarde MC, Menon R. Positive and negative effects of cellular senescence during female reproductive aging and pregnancy. J Endocrinol. 2016;230:R59–R76. PMID: 27325241.
- Baker DJ, Childs BG, Durik M, et al. Naturally occurring p16(Ink4a)-positive cells shorten healthy lifespan. Nature. 2016;530(7589):184–189. PMID: 26840489.
- Sugiyama M, Sumiya M, Shirasuna K, et al. Addition of granulosa cell mass to the culture medium of oocytes derived from early antral follicles increases oocyte growth, ATP content, and acetylation of H4K12. Zygote. 2016;24:848–856. PMID: 27692022.
- Goto H, Iwata H, Takeo S, et al. Effect of bovine age on the proliferative activity, global DNA methylation, relative telomere length and telomerase activity of granulosa cells. Zygote. 2013;21:256–264. PMID: 21791163.
- Kin A, Kansaku K, Sumiya M, et al. Effect of aging on telomeres of oocytes and granulosa cells in cows. J Mamm Ova Res. 2017;34:37–43.
- Cho KA, Ryu SJ, Oh YS, et al. Morphological adjustment of senescent cells by modulating caveolin-1 status. J Biol Chem. 2004;279(40):42270–42278. PMID:15263006.
- Bayreuther K, Rodemann HP, Hommel R, et al. Human skin fibroblasts in vitro differentiate along a terminal cell lineage. Proc Natl Acad Sci U S A. 1988;85(14):5112–5116. PMID:3393534.
- Pfeffer LM, Wang E, Tamm I. Interferon effects on microfilament organization, cellular fibronectin distribution, and cell motility in human fibroblasts. J Cell Biol. 1980;85(1):9–17. PMID:6154057.
- Hancock R. A role for macromolecular crowding effects in the assembly and function of compartments in the nucleus. J Struct Biol. 2004;146(3):281–290. PMID:15099570.
- Miyoshi D, Sugimoto N. Molecular crowding effects on structure and stability of DNA. Biochimie. 2008;90(7):1040–1051. PMID:18331845.
- Sasaki Y, Miyoshi D, Sugimoto N. Effect of molecular crowding on DNA polymerase activity. Biotechnol J. 2006;1(4):440–446. PMID:16892271.
- Webster M, Witkin KL, Cohen-Fix O. Sizing up the nucleus: nuclear shape, size and nuclear-envelope assembly. J Cell Sci. 2009;122(10):1477–1486. PMID:19420234.
- Slater DN, Rice S, Stewart R, et al. Proposed Sheffield quantitative criteria in cervical cytology to assist the grading of squamous cell dyskaryosis, as the British Society for Clinical Cytology definitions require amendment. Cytopathology. 2005;16(4):179–192. PMID:16048504.
- Roca-Cusachs P, Alcaraz J, Sunyer R, et al. Micropatterning of single endothelial cell shape reveals a tight coupling between nuclear volume in G1 and proliferation. Biophys J. 2008;94(12):4984–4995. PMID:18326659.
- Iqbal K, Kues WA, Baulain U, et al. Species-specific telomere length differences between blastocyst cell compartments and ectopic telomere extension in early bovine embryos by human telomerase reverse transcriptase. Biol Reprod. 2011;84(4):723–733. PMID: 21178172.
- Sumer H, Liu J, Malaver-Ortega LF, et al. NANOG is a key factor for induction of pluripotency in bovine adult fibroblasts. J Anim Sci. 2011;89:2708–2716. PMID: 21478453.
- Livak KJ, Schmittgen TD. Analysis of relative gene expression data using Real-Time Quantitative PCR and the 2-∆∆Ct Method. Methods. 2001;25:402–408. PMID: 11846609.