
ABSTRACT
Ovarian cancer is one type of gynecological malignancies with extremely high lethal rate. Abnormal proliferation and metastasis are regarded to play important roles in patients’ death, whereas we know little about the underlying molecular mechanisms. Under this circumstance, our current study aims to investigate the role of hub genes in ovarian cancer. Bioinformatics analysis of the data from GEO and analyses of ovarian cancer samples were performed. Then, the results showed that KIF23, a hub gene, was mainly related to cell cycle and positively associated with poor prognosis. Meanwhile, both miR-424-5p and miR-503-5p directly targeted to 3’UTR of KIF23 to suppress the expression of KIF23 and inhibit ovarian cancer cell proliferation and migration. Furthermore, we discovered that miR-424/503 was epigenetically repressed by hypermethylation in the promoter regions, which directly modulated the expression of KIF23 to improve the oncogenic performance of cancer cells in vitro. Together, our research certifies that miR-424/503 cluster is silenced by DNA hypermethylation, which promotes the expression of KIF23, thereby regulating the proliferation and migration of ovarian cancer cells. Interposing this process might be a novel approach in cancer therapy.
Introduction
Ovarian cancer is the leading cause of death from gynecologic malignancies. According to the current research, about 295,414 new cases could be identified worldwide each year [Citation1,Citation2]. Furthermore, about 184,799 deaths would happen per year [Citation1]. Although the methods of diagnosis and therapy are developing, prognoses of patients are still so poor [Citation3,Citation4]. It is known that cell growth and metastasis are closely related to the high mortality of ovarian cancer [Citation5,Citation6]. Hence, exploring the molecular mechanisms of growth and metastasis of ovarian cancer is essential for diagnosis, treatment, and prognosis [Citation7–Citation10].
Table 1. Summary of microarray datasets used in this study
The kinesins are members of the family of motor proteins with ATPase activity in eukaryocyte, involving in many crucial cellular processes, including mitosis and meiosis, regulation of microtubule motion, formation of spindles and intermediates, separation of chromosomes, and so on [Citation11]. In the process of cell division, abnormal function of kinesins may cause daughter cells to receive aneuploidy, thereby resulting in tumorigenesis [Citation12]. KIF23, also known as Kinesin-6, is a plus-end-directed motor protein expressed in mitosis. Via predictive analytics on GEO database, PPI network, and Kaplan–Meier plotter, elevated levels of KIF23 in ovarian cancer are associated with adverse outcomes. But the regulatory mechanism of its function and abnormal expression in ovarian cancer are not clearly understood.
A microRNA (abbreviated miRNA) is a small non-coding RNA molecule (containing about 22 nucleotides), that mainly functions in regulating post-transcriptional gene expression by influencing the 3ʹUTR regions of mRNA, thereby inhibiting translation and/or degrading mRNA [Citation13–Citation15]. MicroRNAs (miRNAs) have an important role in several cell life activities, and aberrant miRNA expression is associated with many diseases, including tumourigenesis [Citation16]. MiRNAs have significant effects on regulating proliferation, invasion and metastasis of tumor cells [Citation17–Citation21]. In tumor, many miRNAs negatively regulate tumor-related gene and thus influence tumor phenotype, by means of changing the expression of themselves [Citation16]. Therefore, novel abnormal expression genes in cancer cells can be searched beginning with aberrantly expressed miRNAs.
In this study, our aim was to identify novel therapeutic targets and prognostic markers for ovarian cancer, KIF23, a hub gene, was mainly related to cell cycle and positively associated with poor prognosis by multiple bioinformatics analyses and in vitro. Given the critical oncogenic role of KIF23 in ovarian cancer, we sought to test whether KIF23 expression is regulated by specific miRNAs. We found both miR-424-5p and miR-503-5p directly targeted to 3ʹUTR of KIF23 to suppress the expression of KIF23 and inhibit ovarian cancer cell proliferation and migration. Furthermore, the expression of miR-424/503 clusters was significantly lower in ovarian cancer, and their downregulation was attributed to the hypermethylation of its promoter.
Materials and methods
Data collection
The array data of GSE14407, GSE18520, GSE38666 and GSE40595 were downloaded from the Gene Expression Omnibus (GEO, http://www.ncbi.nlm.nih.gov/geo/) database, which is free to access. The details of microarray data were given in the table as follows (). The DEGs associated with OC were searched in PubMed.
Data processing of DEGs
The DEGs between ovarian cancer tissues and normal ovary tissues were analyzed by GEO2R (https://www.ncbi.nlm.nih.gov/geo/geo2r/). The adjusted p value < 0.05 and | logFC | ≥ 1.5 were selected as the cut-off standard of statistical significance.
PPI network and module analysis
The STRING database (http://string-db.org) was used to develop DEGs-encoded proteins and protein–protein interaction network (PPI). The PPI data with the combined score >0.4 and the maximum number of interactors = 0 were selected by biological experiments and then visualized by Cytoscape. In these DEGs, hub genes were chosen with a high degree of connectivity. Using the Molecular Complex Detection (MCODE) app in Cytoscape to analyze the PPI network modules, according to cut-off criteria included cut-off = 2, node score cut-off = 0.2, k-core = 2, and max depth = 100. The most significant functional module was selected. The KEGG pathway analyses of genes in different module were performed by DAVID.
Prognostic information of hub genes
-The prognostics of hub genes were conducted by Kaplan–Meier plotter (http://kmplot.com/analysis/), which is a freely available server for assessing the effect of genes on survival, and cancer samples contain breast cancer patients, ovarian cancer patients, lung cancer patients and gastric cancer patients. P < 0.05 and HR > 1 were considered as the cut-off criteria.
Comparison among the hub genes expression level and their relationship
We demonstrated the expression of those selected hub genes in ovarian cancer tissues and normal tissues by the GEPIA (http://gepia.cancer-pku.cn/index.html), which is an interactive web server for the biologists exploring the datasets from the TCGA and the GTEx projects. Then, the boxplot was performed to compare the genes expression in ovarian cancer tissues and normal tissues.
Patients and samples
This study was approved by the ethics committee of Xiangya Hospital (Central South University, Changsha, China). Written informed consents were obtained from all of the patients. The study methodologies conformed to the standards set by the Declaration of Helsinki. For immunohistochemical staining, we collected paraffin-embedded ovarian tissue samples from 116 patients with ovarian tumor and 16 patients with other diseases whose normal ovary should be removed. Paraffin-embedded ovarian tissue samples were obtained from the pathology department of Xiangya Hospital between May 2012 and Nov 2017. For quantitative reverse-transcription polymerase chain reaction (qRT-PCR), we collected 41 fresh ovarian tumor samples during surgical resection of the lesion between May 2015 and Nov 2017 at the obstetrics and gynecology department of Xiangya Hospital. We also obtained 10 normal ovarian tissue samples from patients with other diseases whose ovaries should be routinely removed. All collected tissue samples were immediately snap-frozen using liquid nitrogen and then stored at −80°C. Histologic diagnosis and grading of tumors were carried out with FIGO 2009* (FIGO Committee and Working Group Publications) by two pathologists.
Western blot analysis
Cells were lysed with the mammalian protein extraction reagent RIPA Lysis Buffer (Beyotime, Haimen, China) and supplemented with a protease inhibitor cocktail (Roche, Mannheim, Germany) or 1% PMSF (Wuhan, China), then clarified by centrifugation. Protein concentration was quantified using the BCA Protein Assay Kit (Pierce). The proteins (30 μg) were electrophoresed by sodium dodecyl sulfate-polyacrylamide gel electrophoresis (SDS-PAGE) and then transferred onto PVDF membranes. Immunoblotting was performed using the KIF23 (Abcam, 1:1000, ab174304, UK), GAPDH was used as internal control proteins. Chemiluminescent signal was detected by ECL staining (Cwbiotech, Beijing, China).
Immunohistochemistry
Primary KIF23 (Cusabio, 1:300, CSB-PA23569A0Rb, China) was applied for immunohistochemistry (IHC) staining. Visualization reagent was used to record the results. Tissue staining intensity and percentage were scored. Five areas of KIF23 positive stains were selected to estimate at low (× 40) or high (× 200) magnification. The intensity was scored as: 0 (negative), 1 (weak), 2 (moderate), and 3 (strong); the percentage of cells was scored into the following four categories: 1 (0–25%), 2 (26–50%), 3 (51–75%), or 4 (> 75%), and comprehensive score = staining percentage × intensity [Citation22]. Finally, the expression level of KIF23 was defined as low expression and high expression according to the comprehensive score (cutoff value = 6) [Citation23].
Cell lines, cell culture
The epithelial ovarian cancer cell lines HO8910 (serous cystadenocarcinoma) and HO8910PM (highly invasive HO8910, serous cystadenocarcinoma) were kindly provided by Professor Wu Xiaoying’s laboratory (Xiangya Medical School, Central South University, Changsha, China). The epithelial ovarian cancer cell line SKOV3 (serous papillary cystadenocarcinoma) was offered by Li Xiong (Xiangya Medical School, Central South University, Changsha, China). The epithelial ovarian cancer cell line A2780 was given by Professor Zhang Yu (Xiangya Hospital, Central South University, Changsha, China). All cell lines were cultured in RPMI-1640 supplemented with 10% fetal bovine serum (FBS) (Gibco, Carlsbad, CA) at 37°C in a humidified 5% CO2 incubator.
Cell transfection
About 5 × 10⁵ cells/ml was plated for transfections. Transient transfections of the chemically synthesized miRNA inhibitor, mimic, siRNAs, scrambled controls (RiboBio, Guangzhou, China) were performed using Lipofectamine 2000 (Invitrogen, Carlsbad, CA, USA) following the manufacturer’s instructions.
The sequences of the above small molecules are as follows:
miR-424-5p inhibitor: UUCAAAACAUGAAUUGCUGCUG
miR-503-5p inhibitor: CUGCAGAACUGUUCCCGCUGCUA
miR-424-5p mimic: 5ʹ-CAGCAGCAAUUCAUGUUUUGAA-3ʹ
3ʹ-UUGUCGUCGUUAAGUACAAAAC-5ʹ
miR-503-5p mimic: 5ʹ-UAGCAGCGGGAACAGUUCUGCAG-3ʹ
3ʹ-UUAUCGUCGCCCUUGUCAAGACG-5ʹ
KIF23 siRNAs: si-001: GGTAGATCTTGCTGGAAGT
si-002: GGCTATTGTTACCGAACCT
si-003: CAGTCACTAATGACGCTAA
Scrambled controls: TTCTCCGAACGTGTCACGT
RT-PCR and quantitative PCR
Total cell RNAs were prepared by Trizol reagent (ambion) following manufacturer’s instructions. Briefly, RNAs were extracted from indicated cell lines, and reverse transcription was performed through the GoScript Reverse Transcription System (Promega, Madison, WI, USA) according to the manufacturer’s instructions. Quantification of all gene transcripts was carried out by real-time PCR by the GoTaq qPCR Master Mix (Promega, Madison, WI, USA). GAPDH was used as an internal control.
A total of 5 μg RNA was synthesized with the All-in-One™ miRNA FirstStrand cDNA Synthesis Kit (GeneCopoeia, Rockville, MD, USA). miRNA qPCR was performed with forward primers specific for miR-424/503 using the All-in-One™ miRNA qRT-PCR Detection Kit (GeneCopoeia, Rockville, MD, USA) and their respective All-in-One™ miRNA qPCR Validation primer (GeneCopoeia, Rockville, MD, USA). The reaction mixtures were incubated at 95°C for 15 min, followed by 44 amplification cycles at 94°C for 15 s and 60°C for 60 s. Each sample was run in triplicate. U6 primer was chosen as the endogenous standard. qPCR was carried out to detect the expression levels of candidate miRNAs with the StepOnePlus™ Real Time System (Applied Biosystems).
Dual-luciferase reporter assays
HEK-293T cells were co-transfected with luciferase reporter plasmid, thymidine kinase promoter-Renilla luciferase reporter plasmid, KIF23-WT/MUT plasmids (200 ng) and miR-424/503 mimic (50 nM), according to the Lipofectamine 2000 transfection system protocol. After 48 h of incubation, cells were lysed using 1 × PLB and transfected into 96-well plates (Nunc™, Thermo Fisher Scientific, Danmark), luciferase activities were measured by the Dual-Luciferase® reporter assay system (Promega, Madison, WI, USA) according to the manufacturer’s instructions.
Cell viability
Cell proliferation was determined with the Cell Counting Kit-8 (CCK-8; Dojindo, Dojindo Chemical Laboratories, Kumamoto, Japan) assay. Briefly, after cell transfection 24 h, infected cells were seeded into the wells of a 96-well plate and cultured for 6–72 h. After indicated times (6, 24, 48, and 72 h), added 10 μl of CCK8 solution to each well and incubated for 2 h. Then, the optical density (OD) at 450 nm was measured using a Bio-Rad imarkTM microplate absorbance reader (Bio-Rad Laboratories, Hercules, CA, USA).
Colony formation assay
For the colony formation assay, infected cells were seeded in 6-well plates at a density of 200 cells per well and allowed to grow for 2 weeks. Cell colonies were washed twice with 1 × PBS, fixed with 70% ethanol for 30 min, and stained with 0.1% crystal violet (Sigma-Aldrich) for 5 min. Cell colonies were photographed by microscope (Olympus, Tokyo, Japan) and counted by ImageJ.
Transwell
1 × 10⁶ cells in serum-free media were placed into the upper chamber of each insert (24-well plates, 8 um pore size, Corning). Media containing 20% FBS was placed in the lower chamber. After incubation for 12 h, the cells on the upper surface were scraped off with a cotton swab. The migration cells on the lower surface were fixed with 4% paraformaldehyde and stained with 5% crystal violet. After washed by PBS, the number of migration cells was observed and counted in five randomly selected fields using a light microscope (Olympus, Tokyo, Japan).
Wound healing
Infected cells were seeded in 6-well plates, and grown to 100% confluency. The confluent monolayer of cells was scratched with aplastic apparatus to create a clear cell-free zone. Subsequently, the cells were incubated in free-serum medium and cultured for 48 h. Wound closure was photographed under the light microscope (Olympus, Tokyo, Japan).
Cell cycle analysis
Forty-eight hours after transfection, 1 × 10⁵ HO8910PM or HO8910 cells were harvested and fixed with 70% ethanol overnight at 4°C followed by two washes with phosphate buffer saline (PBS). The DNA fragment staining with PI (propidium iodide) solution using a cell cycle phase detection kit (BD Bioscience, USA) for 15 min. Cell cycle was determined by FACS Calibur flow cytometer (BD Biosciences, USA).
Decitabine treatment and bisulfite sequencing
Cells were cultured with decitabine (0 μM, 1 μM, 20 μM,) for 24 or 48 h, and then were harvested for the detection of miRNA and KIF23 expression. Bisulfite-converted genomic DNA was amplified by using bisulfite sequencing primers. The PCR products were cloned and three individual clones were subjected to DNA sequencing.
Statistical analysis
All data were shown as mean ± SEM. Statistical significance was calculated by Student’s t-test using GraphPad Prism 5 software (GraphPad Software, Inc., La Jolla, CA, USA).
Results
Seeking for hub genes of ovarian cancer through bioinformatics analyses
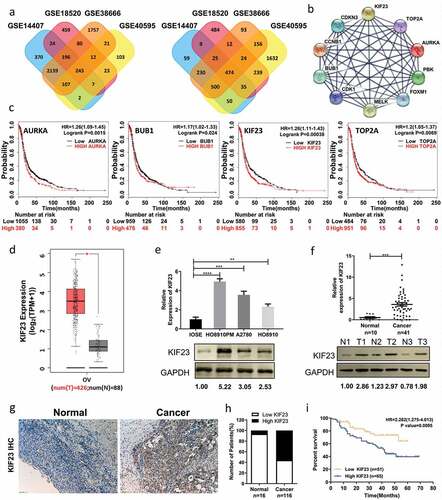
Searching gene expression profiles of ovarian cancer and normal tissues which include four gene expression profiles of GSE14407, GSE18520, GSE38666 and GSE40595. Using GEO2R to detect DEGs online (P < 0.05 and | logFC | ≥ 1.5), 717 differentially expressed genes related to ovarian cancer were found in those four profiles, including 243 up-regulated and 474 down-regulated (). Based on STRING database and Cytoscape software, we constructed PPI network of these DEGs in which the Top10 genes were found, including TOP2A, CDK1, CCNB1, AURKA, BUB1, MELK, CDKN3, PBK, FOXM1 and KIF23 (). Assessing the impact of aforesaid genes on ovarian cancer survival rates through Kaplan Meier-plotter (http://kmplot.com/analysis/), we found that AURKA (HR 1.26[1.09–1.45], P = 0.0015), BUB1 (HR 1.17 [1.02–1.33], P = 0.024), KIF23 (HR 1.26 [1.11–1.43], P = 0.00038) and TOP2A (HR 1.2 [1.05–1.37], P = 0.0069) were correlated with poor prognoses of patients with ovarian cancer (). Meanwhile, we used GEPIA to verify that there were significant positive correlations between any two in ovarian cancer (Figure S1A). Through reviewing relevant literatures and searching the gene-radar of GCBI, we found AURKA, BUB1 and TOP2A among those four had been reported in ovarian cancer [Citation24–Citation30], but exactly how KIF23 affects ovarian cancer is still unclear (Figure S1B). GEPIA is an interactive web server for the biologists exploring the datasets from the TCGA and the GTEx projects, and GEPIA was also used to verify the expression levels of KIF23 in ovarian cancer. We found that KIF23 had a higher expression level in ovarian cancer when compared to normal control (). To verify that the results from the four datasets in GEO and GEPIA are reliable, we measured the expression of KIF23 in various cell lines. As shown in , KIF23 was overexpressed in a variety of ovarian cancer cell lines compared with IOSE cells (an immortalized ovarian epithelial normal cell line) (). To further determine the expression of KIF23 in ovarian cancer patients, we used qRT-PCR and western blot to test KIF23 expression in 41 ovarian cancer tissues as well as 10 normal ovarian tissues. The KIF23 was overexpressed in ovarian cancer tissue of patients, both on mRNA and protein levels, which was consistent with chips (). After immunohistochemistry (IHC), the percentage of high expression of KIF23 in ovarian cancer (56.03%) was higher than that in normal paraffin-embedded tissues (6.25%) (, ). We divided all patients into two groups, the high KIF23 expression group (n = 65) and the low KIF23 expression group (n = 51), and the Kaplan-Meier analysis revealed a poorer prognosis for ovarian cancer patients with high KIF23 expression compared to those with low KIF23 expression ().
Figure 1. KIF23 expression is significantly up-regulated in ovarian cancer and predicts poor prognosis for ovarian cancer patients.
KIF23 had significantly positive correlations with cell cycle-related proteins
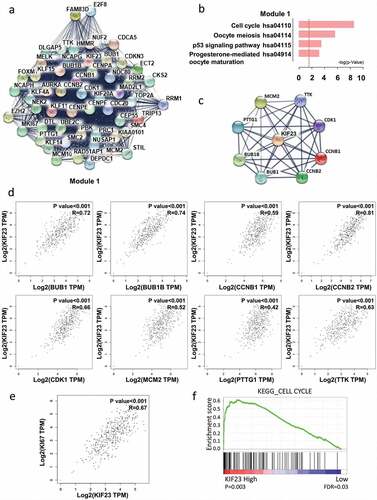
In order to study the important modules found in the PPI network, we selected the most significant one by MCODE plug-in (). Kyoto Encyclopedia of Genes and Genomes (KEGG) pathway showed that module 1 was mainly related to cell cycle and p53 signaling pathway, Progesterone-mediated oocyte maturation, Oocyte meiosis (). Meanwhile, KIF23 existed in module 1. For seeking the correlations between KIF23 and cell cycle-related genes, we constructed the PPI network of KIF23 and cell cycle-related proteins, based on STRING database and Cytoscape software (). Through GEPIA, we found positive correlations between KIF23 and eight cell cycle-related proteins which included CDK1 (Cyclin-Dependent Kinase 1), CCNB1 (Cyclin B1), BUB1 (Budding uninhibited by benzimidazole 1), CCNB2 (Cyclin B2), TTK (TTK protein kinase), BUB1B (BUB1 mitotic checkpoint serine/threonine kinase B), PTTG1 (Pituitary tumor-transforming 1) and MCM2 (Minichromosome maintenance complex component 2) (). We also analyzed the correlation between KIF23 and Ki67, which is confirmed as an indicator of tumor proliferation. As shown in , KIF23 expression was positively associated with Ki67. Consistently, Gene set enrichment analysis (GSEA) of a publicly available ovarian cancer dataset (TCGA) also revealed that KIF23 expression was positively associated with the cell cycle ().
Figure 2. The correlation analyses between KIF23 and cell cycle-related proteins.
KIF23 could promote the proliferation and migration of ovarian cancer cells
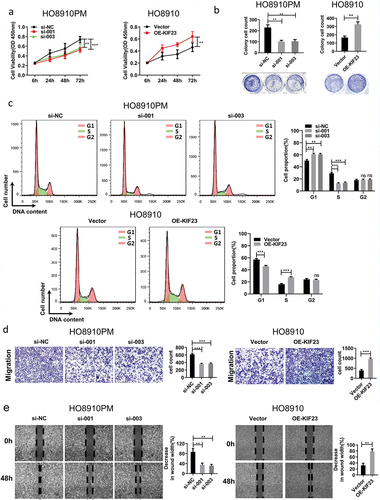
To better understand the biological functions of KIF23, we transfected siRNA and full-length KIF23 vector into HO8910PM and HO8910 cell lines. The expression of KIF23 was verified by qRT-PCR and WB analysis (Figure S2A, S2B). KIF23 was significantly and positively correlated with cell cycle-related proteins by multiple bioinformatics analyses. With the aim of verifying the effect of KIF23, we detected the multiplication capacity of ovarian cancer cells by CCK8 assays and colony formation assays. The data showed that KIF23 knockdown markedly impeded the proliferation of HO8910PM cells, while KIF23 overexpression promoted the growth of HO8910 cells (, ). Consistent with this observation, the knockdown of KIF23 affected cell cycle distribution and the percentage of cells in G1 phase significantly increased, while the percentage of cells in S phase markedly decreased; conversely, the overexpression of KIF23 promoted cell cycle progression, which was evident by a significant decrease in the G1 phase and a remarkable increase in S phase (). These results suggested that the downregulation of KIF23 could arrest ovarian cancer cells in G1 phase. Kinesin-6 subfamily is comprised of KIF20A [Citation31], KIF20B (MPP1) [Citation32] and KIF23 [Citation33]. In , KIF23 and KIF20A both existed in module 1. After KIF20A had been silenced, cell cycle progression was arrested in G1 phase and apoptosis was increased in lung cancer cells [Citation34]. KIF23 may play a similar role like KIF20A and participate in regulating G1 arrest. Because KIF23 has MT-binding activity and function of transiting particles in cells [Citation35,Citation36]. Next, to examine the effect of KIF23 on cell migration capacity, transwell and wound healing assays were performed. (, ). Notably, the knockdown of KIF23 in HO8910PM significantly decreased the cell migration, whereas the overexpression of KIF23 in HO8910 significantly increased the cell migration. Therefore, as noted above, KIF23 could promote cell proliferation and migration in vitro.
Figure 3. The effect of KIF23 on proliferation, migration and cell cycle.
Mir-424/503 cluster can specifically suppress KIF23 expression at its 3UTR
MicroRNAs negatively regulate tumor-related genes, thus influencing tumor phenotype, by means of changing the expression of themselves. To investigate whether KIF23 expression is regulated by miRNAs, we researched on gene expression profile GSE47841 firstly. DEGs were discovered by GEO2R (P < 0.05, | logFC | ≥ 1.5). When compared in normal, 41 microRNAs were up-regulated and 92 microRNAs were down-regulated. Because of the elevated expression of KIF23 in ovarian cancer, our next step pointed to 92 down-regulated microRNAs. So, we predicted the microRNAs which targeted to KIF23 through mirwalk (http://zmf.umm.uni-heidelberg.de/apps/zmf/mirwalk/index.html). Then, we found that, in GSE47841, overlaps between the above-mentioned microRNAs and down-expressed microRNAs indicated five microRNAs, which consisted of hsa-miR-135a, hsa-miR-381, hsa-miR-424, hsa-miR-485 and hsa-miR-503. These microRNAs might regulate KIF23 and were also down-regulated in ovarian cancer (, , ). Next, we transfected the five candidate microRNAs mimics to HO8910PM. As shown in , among the five microRNAs candidates, hsa-miR-424 and hsa-miR-503 significantly decreased KIF23 expression compared to a non-targeting control (miR-Ctrl mimic). We identified the potential miR-424-5p and miR-503-5p binding site on the 3′-UTR of KIF23 (). Furthermore, we found the expression of miR-424-5p was a positive correlation with miR-503 in GSE4784 (). According to the results, we hypothesized that miR-424-5p and miR-503-5p could target KIF23 gene.
Figure 4. KIF23 is directly targeted by miR-424-5p and miR-503-5p in vitro.
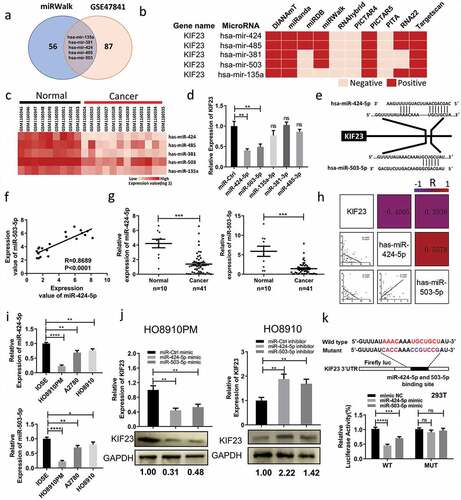
Through qRT-PCR, we found that miR-424-5p and miR-503-5p were down-regulated in fresh tumor tissues (). Negative correlations, respectively, existed between KIF23 to miR-503-5p and miR-424-5p (). Simultaneously, miR-503-5p and miR-424-5p were positively related to each other (). qRT-PCR revealed that miR-424-5p and miR-503-5p expression were all significantly lower in ovarian cancer cell lines compared to IOSE (). The transfection efficiencies for miR-424-5p and miR-503-5p overexpression or downregulation were confirmed by qRT-PCR after 48 h (Figure S3A). Furthermore, mRNA and protein expression level of KIF23 was significantly downregulated in HO8910PM cells transfected with miR-424-5p or miR-503-5p mimic, whereas upregulated in HO8910 cells transfected with miR-424-5p or miR-503-5p inhibitor (). The results of CCK8 and colony formation assays showed that overexpression miR-424-5p or miR-503-5p significantly inhibited the growth of HO8910PM cells, while knockdown miR-424-5p or miR-503-5p promoted the growth of HO8910 cells (Figure S4B, S4C). Transwell and wound healing assays revealed that, by using mimics, overexpressing either miR-424-5p or miR-503-5p indeed inhibited the migration of HO8910PM cells. Simultaneously, with the aid of inhibitors, inhibiting either one of those promoted the migration of HO8910 cells (Figure S4D, S4E).
These results raise the question of whether KIF23 could be the direct target gene of miR-424-5p and miR-503-5p. To address this question, we used the dual-luciferase to confirm the existence of binding sites. Comparing with mimic NC, we found that fluorescent signal of 3ʹ-UTR of wildtype KIF23 was signally inhibited by miR-424-5p and miR-503-5p (P < 0.05), while the signal of KIF23 mutant had no change (). All the above results confirm that KIF23 is the direct target gene of miR-424-5p and miR-503-5p indeed, and both of them could negatively regulate KIF23.
Mir-424/503 cluster influences proliferation and migration through regulating KIF23
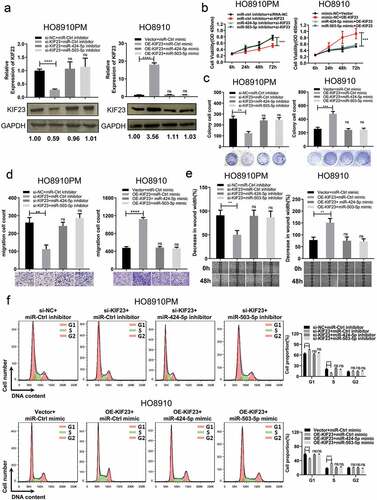
In order to test whether miR-424/503 could influence the effect of KIF23 on cell proliferation and migration or not. Firstly, relative KIF23 expression in both si-KIF23 co-transfected with miR-424/503 inhibitor in HO8910PM cell and oe-KIF23 vector with miR-424/503 mimics HO8910 cells was confirmed by qRT-PCR and western blot, the result revealed that KIF23 silencing co-transfected with miR-424/503 inhibitor in HO8910PM suppressed the decrease of KIF23 expression induced by si-KIF23, compared with siRNA controls. High expression of KIF23 transfected with miR-424/503 mimic in HO8910 cells reversed the increase of KIF23 expression promoted by oe-KIF23 vector, compared with controls (). Furthermore, miR-424/503 inhibitor dramatically restored the inhibitory effects of KIF23 silencing in HO8910PM cell proliferation (, ) and migration (, ), whereas miR-424/503 mimic remarkably restored the promoting effects of KIF23 up-expression in HO8910 cell proliferation (, ) and migration (, ). Flow cytometry analysis indicated that miR-424/503 inhibitor significantly counteracted cell cycle G1 phase arrest in KIF23 silencing HO8910PM cell, and miR-424/503 mimic remarkably increased cell cycle G1 phase arrest in KIF23 upregulated HO8910 cells ().
Figure 5. MiR-424-5p and miR-503-5p regulate KIF23 to influence proliferation, migration and cell cycle of ovarian cancer cells.
Abnormal expression of mir-424-503-kif23 axis is regulated by DNA methylation
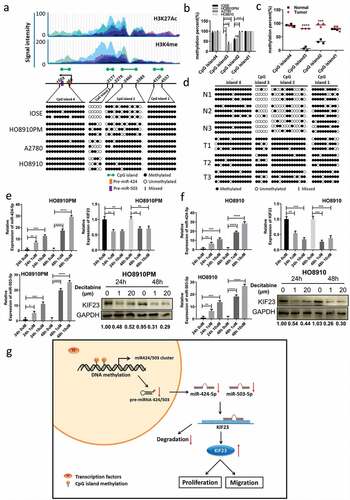
A final question remained as to why the downregulation of miR-424/503 cluster occurs in the ovarian cancer. The existing research showed that the expression of miRNA could be regulated by the methylation of an upstream promoter sequence, and DNA methylation could dysregulate the expression of miRNA in a variety of tumors such as colorectal, liver, oral, breast cancer and gynecological oncology [Citation37–Citation40]. Analyzing the CpG islands of pre-miRNAs, researchers found that 20% of epigenetically regulated miRNAs had CpG islands within the range of 5kb upstream, among them, 14% of miRNAs resided within the CpG islands [Citation41]. Through MethPrimer (http://www.urogene.org/methprimer/), we forecast the CpG islands of miR-424/503 cluster within the range of 5 kb in their promoter. To understand this, we analyzed the DNA methylation of the four CpG islands in ovarian cancer cell lines by using BSP. As compared with normal control IOSE cells, in HO8910 and A2780 cells, the CpG islands 2 and islands 3 were highly methylated (, ), which approximately agreed with the corresponding miR-424 and miR-503 expression data (). Simultaneously, the methylation level of the miR-424/503 cluster in the CpG islands 2 and islands 3 was significantly higher in ovarian cancer tissue than normal tissue (, ). In support, miR-424 and miR-503 expression were significantly increased in HO8910PM and HO8910 cells treated with the DNA methyltransferase inhibitor Decitabine, and the expression KIF23 reduced (, ). Together, these findings proposed that the DNA hypermethylation suppressed miR-424/503 cluster expression and resulted in the high expression of KIF23, which could be significantly reversed by Decitabine.
Figure 6. Restoration of miR-424/503 expression and downregulation of KIF23 by demethylation.
Discussion
The fact that ovarian cancer remains the major reason for deaths from gynecologic malignancies is associated with adverse prognosis for most patients and high mortality at a late stage. In recent years, as molecular biology technology advances, researching on target therapy and seeking for a biomarker of ovarian cancer have attracted considerable attention. With the aim of improving the survival rates of patients, we have dedicated ourselves to study pathogenesis and progression of ovarian cancer at the molecular level. Bioinformatics analysis of the data from GEO and in vitro analyses of ovarian cancer samples were performed. The results show that KIF23, a hub gene, was mainly related to cell cycle and positively associated with poor prognosis by multiple bioinformatics analyses and in vitro.
Existing studies showed that KIF23 was necessary for midbody formation and completion of cell cytokinesis in proliferative cells [Citation42,Citation43], accumulating to the central antiparallel overlap zone of the microtubule-based structures and recruiting various downstream cytokinesis factors to the site of division [Citation36,Citation44]. During cell division, that Kinesin functions abnormally may lead to daughter cells receive aneuploidy, thereby resulting in tumor [Citation12]. In neurospongioma, overexpression of KIF23 was associated with poor prognosis, and reducing the expression of KIF23 could suppress cell proliferation and development of xenograft [Citation45]. KIF23 was broadly distributed on normal cells at a relatively low level, while high-expressed on lung cancer cells [Citation46], and was essential for the development and survival of cancer cells [Citation47]. Inhibiting KIF23 expression via RNAi could suppress tumorigenesis and promote apoptosis in lung cancer [Citation48]. We found that silencing KIF23 inhibited proliferation and migration, and cell cycle progression (these features are associated with poor prognosis in ovarian cancer patients), whereas overexpressing KIF23 in ovarian cancer cells promoted proliferation and migration, and cell cycle progression. KIF23 and KIF20A, both existed in module 1, are members of Kinesin-6 subfamily [Citation31,Citation33]. In lung cancer, reducing the expression of KIF20A could affect cell cycle distribution and induce G1 phase arrest, thus promote cell apoptosis [Citation34]. KIF23 may play a similar role like KIF20A and participate in regulating G1 arrest.
MiRNAs are proved to be associated with gene regulation and varieties of tumourigenic processes. In order to find the microRNA that could target KIF23, we searched for putative microRNA by some bioinformatics analyses available online. Through luciferase assays, we discovered that KIF23 was the direct target gene of miR-424-5p and miR-503-5p in ovarian cancer cells, and the expression of miR-424-5p and miR-503-5p exhibited an inverse relationship with the expression of KIF23 in ovarian cancer tissues. MiR-424/503 clusters, the members of the miR-16 family, participate in regulating and controlling cell cycle [Citation49]. According to the different types of tumor, miR-424/503 clusters play the part of tumor suppressors or oncomiRs. miR-424 and miR-503 simultaneously suppressed Smad7 and Smurf2, two key inhibitory factors of TGFβ signaling, leading to enhanced TGFβ signaling and metastatic capability of breast cancer cells [Citation50]. In neuroblastoma (NB), a high level of ALK protein has been associated with metastatic NB cases and with a worse prognosis. Both miR-424-5p and miR-503-5p are involved in regulating ALK expression in NB, and may thus serve as potential therapeutic tools in ALK dependent NB [Citation51]. Lower miR-424 levels are also associated with epithelial ovarian cancer [Citation52,Citation53]. Liu J found that miR-424 could directly target at CCNE1, resulting in G1 arrest, which means suppressing cell proliferation [Citation52]. MiR-503 is an intragenic miRNA clustered with miR-424 [Citation54], we have found that miR-503 was also downregulated in ovarian cancer. In this research, we demonstrated that miR-424 and miR-503 were both down-regulated in ovarian cancer and inhibited cell proliferation, migration and cycle distribution via specifically targeting KIF23.
The existing research showed that the expression of miRNA could be regulated by the methylation of an upstream promoter sequence, and DNA methylation could dysregulate the expression of miRNA in a variety of tumors such as colorectal, liver, oral, breast cancer and gynecological oncology [Citation37–Citation40,Citation55]. Promoter region hypermethylation causing silencing of miR-424 and miR-503 was previously observed in cancer [Citation56,Citation57], and our work found that the CpG island 2 and island 3 high methylation of the miR-424/503 cluster promoter region in ovarian cancer compared with normal tissues. Using Decitabine, an inhibitor of DNA methylation, in ovarian cancer cells, we discovered that the expression of miR-424 and miR-503 increased, and the expression of KIF23 reduced. In order to further validate the particularity of CpG island 2 and island 3 corresponding with histone modifications in miR-424/503 cluster promoter region as specified by ENCODE, we found the high methylation regions were the sites where the histone markers of transcription activation were extremely highly expressed. Thus, we hypothesize that hypermethylation of the CpG island affects the structure of DNA, and then directly obstructs the binding of transcription factors to target genes, which needs to be further studied.
In short, the existing research results indicated that elevated levels of KIF23 in ovarian cancer tissues were strongly correlated with the inferior rates of survival in patients and KIF23 could promote the proliferation, migration and cell cycle progression of cancer cells. For the first time, our study has shown that KIF23 is a target for miR-424-5p and miR-503-5p, and that DNA methylation decreases the expression of miR-424-5p and miR-503-5p in ovarian cancer. Although further studies are needed, our results suggest that KIF23 may function as a novel target spot for treating patients with ovarian cancer. A further detailed study of the miR-424/503 cluster promoter region is required to identify the transcriptional machinery responsible for miR-424/503 expression.
Supplemental Material
Download Zip (1.8 MB)Acknowledgments
This study was supported by grants from the National Natural Science Foundation of China (No. 81572900). The National Key R&D Program of China, Stem Cell and Translation Research (No. 2016YFA0102000). The Fundamental Research Funds for the Central Universities of Central South University (No. 1053320171187 and No. 2018zzts232).
Disclosure statement
No potential conflict of interest was reported by the authors.
Supplemental material
Supplemental data for this article can be accessed here.
Additional information
Funding
Related Research Data
References
- Bray F, Ferlay J, Soerjomataram I, et al. Global Cancer Statistics 2018: GLOBOCAN Estimates of Incidence and Mortality Worldwide for 36 Cancers in 185 Countries. CA Cancer J Clin. 2018 Sep 12 PubMed PMID: 30207593; eng. DOI:10.3322/caac.21492.
- Fu X, Li Y, Alvero A, et al. MicroRNA-222-3p/GNAI2/AKT axis inhibits epithelial ovarian cancer cell growth and associates with good overall survival. Oncotarget. 2016 Dec 6;7(49):80633–80654. PubMed PMID: 27811362; PubMed Central PMCID: PMC5348346. eng.
- Pan C, Stevic I, Müller V, et al. Exosomal microRNAs as tumor markers in epithelial ovarian cancer. Mol Oncol. 2018 Nov;12(11):1935–1948. . PubMed PMID: 30107086; PubMed Central PMCID: PMC6210043. eng.
- Zhong Y, Yang S, Wang W, et al. The interaction of Lin28A/Rho associated coiled-coil containing protein kinase2 accelerates the malignancy of ovarian cancer. Oncogene. 2018 Sep 28 PubMed PMID: 30266988; eng. 10.1038/s41388-018-0512-9.
- Bast RC Jr., Hennessy B, Mills GB. The biology of ovarian cancer: new opportunities for translation [Research Support, N.I.H., Extramural Research Support, Non-U.S. Gov’t Review]. Nat Rev Cancer. 2009 Jun;9(6):415–428. . PubMed PMID: 19461667; PubMed Central PMCID: PMC2814299. eng.
- Naora H, Montell DJ. Ovarian cancer metastasis: integrating insights from disparate model organisms [Review]. Nat Rev Cancer. 2005 May;5(5):355–366. . PubMed PMID: 15864277; eng.
- Arvizo RR, Saha S, Wang E, et al. Inhibition of tumor growth and metastasis by a self-therapeutic nanoparticle [Research Support, N.I.H., Extramural]. Proc Natl Acad Sci U S A. 2013 Apr 23:110(17): 6700–6705. PubMed PMID: 23569259; PubMed Central PMCID: PMC3637766. eng.
- Dragosavac S, Derchain S, Caserta NMG, et al. Staging recurrent ovarian cancer with (18)FDG PET/CT. Oncol Lett. 2013 Feb;5(2):593–597. . PubMed PMID: 23420711; PubMed Central PMCID: PMC3573129. eng.
- Klopp AH, Zhang Y, Solley T, et al. Omental adipose tissue-derived stromal cells promote vascularization and growth of endometrial tumors [Research Support, N.I.H., Extramural]. Clin Cancer Res off J Am Assoc Cancer Res. 2012 Feb 1;18(3):771–782. PubMed PMID: 22167410; PubMed Central PMCID: PMC3481843. eng.
- Kolonin MG. Progenitor cell mobilization from extramedullary organs [Research Support, N.I.H., Extramural Research Support, Non-U.S. Gov’t Review]. Methods Mol Biol. 2012;904:243–252. PubMed PMID: 22890937; eng.
- Miki H, Okada Y, Hirokawa N. Analysis of the kinesin superfamily: insights into structure and function [Research Support, Non-U.S. Gov’t Review]. Trends Cell Biol. 2005 Sep;15(9):467–476. . PubMed PMID: 16084724; eng.
- Huszar D, Theoclitou ME, Skolnik J, et al. Kinesin motor proteins as targets for cancer therapy [Review]. Cancer Metastasis Rev. 2009 Jun;28(1–2):197–208. . PubMed PMID: 19156502; eng.
- Hamam R, Hamam D, Alsaleh KA, et al. Circulating microRNAs in breast cancer: novel diagnostic and prognostic biomarkers [Review Research Support, Non-U.S. Gov’t]. Cell Death Dis. 2017 Sep 7;8(9):e3045. . PubMed PMID: 28880270; PubMed Central PMCID: PMC5636984. eng.
- Troiano G, Boldrup L, Ardito F, et al. Circulating miRNAs from blood, plasma or serum as promising clinical biomarkers in oral squamous cell carcinoma: A systematic review of current findings [Review]. Oral Oncol. 2016 Dec;63:30–37. PubMed PMID: 27938997; eng.
- Li J, Hu K, Gong G, et al. Upregulation of MiR-205 transcriptionally suppresses SMAD4 and PTEN and contributes to human ovarian cancer progression. Sci Rep. 2017 Feb 1;7:41330.
- Esquela-Kerscher A, Slack FJ. Oncomirs - microRNAs with a role in cancer. Nat Rev Cancer. 2006 Apr;6(4):259–269. . PubMed PMID: 16557279; eng.
- Sun X, Zhang J, Mukhopadhyay P. Dysfunctional miRNA-Mediated Regulation in Chromophobe Renal Cell Carcinoma. PubMed PMID: 27258182; PubMed Central PMCID: PMC4892590. eng PloS One. 2016;116:e0156324.
- Chen Y, Min L, Ren C, et al. miRNA-148a serves as a prognostic factor and suppresses migration and invasion through Wnt1 in non-small cell lung cancer. PloS One. 2017;12(2):e0171751. PubMed PMID: 28199399; PubMed Central PMCID: PMC5310808. eng.
- Sathyapalan T, David R, Gooderham NJ, et al. Increased expression of circulating miRNA-93 in women with polycystic ovary syndrome may represent a novel, non-invasive biomarker for diagnosis [Research Support, Non-U.S. Gov’t]. Sci Rep. 2015 Nov 19;5:16890.
- Li J, Li L, Li Z, et al. The role of miR-205 in the VEGF-mediated promotion of human ovarian cancer cell invasion. Gynecol Oncol. 2015 Apr;137(1):125–133. . PubMed PMID: 25597268; eng.
- Wu Q, Ren X, Zhang Y, et al. MiR-221-3p targets ARF4 and inhibits the proliferation and migration of epithelial ovarian cancer cells. Biochem Biophys Res Commun. 2018 Mar 18;497(4):1162–1170. PubMed PMID: 28057486; eng.
- Nones K, Waddell N, Song S, et al. Genome-wide DNA methylation patterns in pancreatic ductal adenocarcinoma reveal epigenetic deregulation of SLIT-ROBO, ITGA2 and MET signaling. Int J Cancer. 2014 Sep 1;135(5):1110–1118. PubMed PMID: 24500968; eng.
- Yang G, Chang B, Yang F, et al. Aurora kinase A promotes ovarian tumorigenesis through dysregulation of the cell cycle and suppression of BRCA2 [Research Support, N.I.H., Extramural Research Support, Non-U.S. Gov’t]. Clin Cancer Res off J Am Assoc Cancer Res. 2010 Jun 15;16(12):3171–3181. PubMed PMID: 20423983; PubMed Central PMCID: PMC2930838. eng.
- Davidson B, Nymoen DA, Elgaaen BV, et al. BUB1 mRNA is significantly co-expressed with AURKA and AURKB mRNA in advanced-stage ovarian serous carcinoma [Research Support, Non-U.S. Gov’t]. Virchows Arch. 2014 Jun;464(6):701–707. PubMed PMID: 24756216; eng.
- de Resende MF, Vieira S, Chinen LT, et al. Prognostication of prostate cancer based on TOP2A protein and gene assessment: TOP2A in prostate cancer [Research Support, Non-U.S. Gov’t]. J Transl Med. 2013 Feb 11;11:36. PubMed PMID: 23398928; PubMed Central PMCID: PMC3576277. eng. DOI: 10.1186/1479-5876-11-36
- Cao Y, Zhang G, Wang P, et al. Clinical significance of UGT1A1 polymorphism and expression of ERCC1, BRCA1, TYMS, RRM1, TUBB3, STMN1 and TOP2A in gastric cancer. BMC Gastroenterol. 2017 Jan 5;17(1):2. PubMed PMID: 28056823; PubMed Central PMCID: PMC5217235. eng.
- Zheng H, Li X, Chen C, et al. Quantum dot-based immunofluorescent imaging and quantitative detection of TOP2A and prognostic value in triple-negative breast cancer. Int J Nanomedicine. 2016;11:5519–5529. PubMed PMID: 27799773; PubMed Central PMCID: PMC5085300. eng.
- Kang K, Nho CW, Kim ND, et al. Daurinol, a catalytic inhibitor of topoisomerase IIalpha, suppresses SNU-840 ovarian cancer cell proliferation through cell cycle arrest in S phase [Research Support, Non-U.S. Gov’t]. Int J Oncol. 2014 Aug;45(2):558–566. PubMed PMID: 24841075; eng.
- Glotzer M. The molecular requirements for cytokinesis [Research Support, Non-U.S. Gov’t Review]. Science. 2005 Mar 18;307(5716):1735–1739. . PubMed PMID: 15774750; eng.
- Neef R, Klein UR, Kopajtich R, et al. Cooperation between mitotic kinesins controls the late stages of cytokinesis [Comparative Study Research Support, Non-U.S. Gov’t]. Curr Biol. 2006 Feb 7;16(3):301–307. . PubMed PMID: 16461284; eng.
- Wu WD, Yu KW, Zhong N, et al. Roles and mechanisms of Kinesin-6 KIF20A in spindle organization during cell division. Eur J Cell Biol. 2018 Dec 16. PubMed PMID: 30579662; eng. 10.1016/j.ejcb.2018.12.002
- Kamimoto T, Zama T, Aoki R, et al. Identification of a novel kinesin-related protein, KRMP1, as a target for mitotic peptidyl-prolyl isomerase Pin1. J Biol Chem. 2001 Oct 5;276(40):37520–37528. . PubMed PMID: 11470801; eng.
- Nislow C, Sellitto C, Kuriyama R, et al. A monoclonal antibody to a mitotic microtubule-associated protein blocks mitotic progression. J Cell Biol. 1990 Aug;111(2):511–522. PubMed PMID: 2199459; PubMed Central PMCID: PMC2116221. eng.
- Zhao X, Zhou LL, Li X, et al. Overexpression of KIF20A confers malignant phenotype of lung adenocarcinoma by promoting cell proliferation and inhibiting apoptosis. Cancer Med. 2018 Sep;7(9):4678–4689. . PubMed PMID: 30105795; PubMed Central PMCID: PMC6143951. eng.
- Sablin EP. Kinesins and microtubules: their structures and motor mechanisms. Curr Opin Cell Biol. 2000 Feb;12(1):35–41. PubMed PMID: 10679355; eng.
- Kline-Smith SL, Walczak CE. Mitotic spindle assembly and chromosome segregation: refocusing on microtubule dynamics [Research Support, Non-U.S. Gov’t Research Support, U.S. Gov’t, P.H.S. Review]. Mol Cell. 2004 Aug 13;15(3):317–327. . PubMed PMID: 15304213; eng.
- Bandres E, Agirre X, Bitarte N, et al. Epigenetic regulation of microRNA expression in colorectal cancer. Int J Cancer. 2009 Dec 1;125(11):2737–2743. . PubMed PMID: 19521961; eng.
- He Y, Cui Y, Wang W, et al. Hypomethylation of the hsa-miR-191 locus causes high expression of hsa-mir-191 and promotes the epithelial-to-mesenchymal transition in hepatocellular carcinoma. Neoplasia (New York, NY). 2011 Sep;13(9):841-IN23. PubMed PMID: 21969817; PubMed Central PMCID: PMC3182276. eng.
- Minor J, Wang X, Zhang F, et al. Methylation of microRNA-9 is a specific and sensitive biomarker for oral and oropharyngeal squamous cell carcinomas. Oral Oncol. 2012 Jan;48(1):73–78. PubMed PMID: 22133638; PubMed Central PMCID: PMC3291120. eng.
- de Souza Rocha Simonini P, Breiling A, Gupta N, et al. Epigenetically deregulated microRNA-375 is involved in a positive feedback loop with estrogen receptor alpha in breast cancer cells. Cancer Res. 2010 Nov 15;70(22):9175–9184. PubMed PMID: 20978187; eng.
- Kunej T, Godnic I, Ferdin J, et al. Epigenetic regulation of microRNAs in cancer: an integrated review of literature. Mutat Res. 2011 Dec 1;717(1–2):77–84. . PubMed PMID: 21420983; eng.
- Green RA, Paluch E, Oegema K. Cytokinesis in animal cells [Research Support, Non-U.S. Gov’t Review]. Annu Rev Cell Dev Biol. 2012;28:29–58. PubMed PMID: 22804577; eng.
- Liljeholm M, Irvine AF, Vikberg AL, et al. Congenital dyserythropoietic anemia type III (CDA III) is caused by a mutation in kinesin family member, KIF23. Blood. 2013 Jun 6;121(23):4791–4799. . PubMed PMID: 23570799; eng.
- Vasiliev JM, Gelfand IM, Domnina LV, et al. Effect of colcemid on the locomotory behaviour of fibroblasts. J Embryol Exp Morphol. 1970 Nov;24(3):625–640. PubMed PMID: 4923996; eng.
- Sun L, Zhang C, Yang Z, et al. KIF23 is an independent prognostic biomarker in glioma, transcriptionally regulated by TCF-4. Oncotarget. 2016 Apr 26;7(17):24646–24655. . PubMed PMID: 27013586; PubMed Central PMCID: PMC5029730. eng.
- Takahashi S, Fusaki N, Ohta S, et al. Downregulation of KIF23 suppresses glioma proliferation [Research Support, Non-U.S. Gov’t]. J Neurooncol. 2012 Feb;106(3):519–529. . PubMed PMID: 21904957; eng.
- Kato T, Wada H, Patel P, et al. Overexpression of KIF23 predicts clinical outcome in primary lung cancer patients. Lung Cancer. 2016 Feb;92:53–61. PubMed PMID: 26775597; eng.
- Iltzsche F, Simon K, Stopp S, et al. An important role for Myb-MuvB and its target gene KIF23 in a mouse model of lung adenocarcinoma [Research Support, Non-U.S. Gov’t]. Oncogene. 2017 Jan 5;36(1):110–121. PubMed PMID: 27212033; eng.
- Rissland Olivia S, Hong S-J, Bartel David P. MicroRNA Destabilization Enables Dynamic Regulation of the miR-16 Family in Response to Cell-Cycle Changes. Mol Cell. 2011;43(6):993–1004.
- Li Y, Li W, Ying Z, et al. Metastatic heterogeneity of breast cancer cells is associated with expression of a heterogeneous TGFbeta-activating miR424-503 gene cluster. Cancer Res. 2014 Nov 1;74(21):6107–6118. . PubMed PMID: 25164015; eng.
- De Mariano M, Stigliani S, Moretti S, et al. A genome-wide microRNA profiling indicates miR-424-5p and miR-503-5p as regulators of ALK expression in neuroblastoma. Oncotarget. 2017 Aug 22;8(34):56518–56532. . PubMed PMID: 28915608; PubMed Central PMCID: PMC5593579. eng.
- Liu J, Gu Z, Tang Y, et al. Tumour-suppressive microRNA-424-5p directly targets CCNE1 as potential prognostic markers in epithelial ovarian cancer. PubMed PMID: 29228869; PubMed Central PMCID: PMC5914728. eng Cell Cycle. 2018;173:309–318.
- Wu X, Ruan Y, Jiang H, et al. MicroRNA-424 inhibits cell migration, invasion, and epithelial mesenchymal transition by downregulating doublecortin-like kinase 1 in ovarian clear cell carcinoma. Int J Biochem Cell Biol. 2017 Apr;85:66–74. PubMed PMID: 28161486; eng.
- Caporali A, Emanueli C. MicroRNA-503 and the extended microRNA-16 family in angiogenesis [Research Support, Non-U.S. Gov’t Review]. Trends Cardiovasc Med. 2011 Aug;21(6):162–166. . PubMed PMID: 22814423; PubMed Central PMCID: PMC3407871. eng.
- Soto-Reyes E, Gonzalez-Barrios R, Cisneros-Soberanis F, et al. Disruption of CTCF at the miR-125b1 locus in gynecological cancers. BMC Cancer. 2012 Jan 25;12:40. PubMed PMID: 22277129; PubMed Central PMCID: PMC3297514. eng.
- Wu CT, Lin WY, Chang YH, et al. DNMT1-dependent suppression of microRNA424 regulates tumor progression in human bladder cancer. Oncotarget. 2015 Sep 15;6(27):24119–24131. . PubMed PMID: 26090723; PubMed Central PMCID: PMC4695174. eng.
- Jin C, Li M, Ouyang Y, et al. MiR-424 functions as a tumor suppressor in glioma cells and is down-regulated by DNA methylation. J Neurooncol. 2017 Jun;133(2):247–255. . PubMed PMID: 28508328; eng.