
ABSTRACT
Cutaneous T-cell lymphoma (CTCL) is associated with the downregulation of miR-337 expression, although the exact underlying mechanism is unknown. In the present work, we investigated the molecular mechanism and function of miR-337 in regulating CTCL cell viability and invasion. We observed that miR-337 expression was downregulated in both CTCL tumors and cell lines. Furthermore, CCK assay, BrdU incorporation assay, and flow cytometry revealed that transfection with the miR-337 mimic resulted in decreased proliferation and increased apoptotic levels in CTCL cells. Results of the Transwell migration assay indicated that the miR-337 mimic decreased CTCL cell invasion in vitro. Both bioinformatics prediction and the dual-luciferase reporter assay revealed that miR-337 targets the 3′-UTR of STAT3 for silencing. Overexpression of STAT3 counteracted the pro-apoptotic influence of miR-337 in CTCL cell lines and restored their invasion properties. The results thus indicate that the miR-337-STAT3 axis inhibits the proliferation of malignant T cells and that miR-337 may serve as a promising therapeutic target for CTCL.
Introduction
In general, cutaneous T-cell lymphoma (CTCL) is caused by the excessive proliferation of malignant T cells in chronic inflammation [Citation1], but no adequate information is available regarding the pathogenesis of mycosis fungoides (MF).
MicroRNAs (miRNAs) are small noncoding RNAs about 20 to 25 nucleotides in length that are known for their regulatory effects in several biological events [Citation2] including orchestration of the immune response [Citation3]. Aberrant changes in miRNA expression have been linked with cancer development [Citation4]. Several recent studies have also reported the involvement of miRNAs in MF. For instance, Ballabio et al. reported a decrease in miR-342 and miR-223 expression levels [Citation5] and other studies have reported the role of miRNAs in the differential diagnosis of CTCL [Citation6]. Studies have demonstrated the downregulation of miR-337 expression in many cancers [Citation7–Citation12]. Notably, miR-337 has been reported to mediate the expression of Janus kinase 2 (JAK2) and signal transducer and activator of transcription 3 (STAT3) in non-small cell lung cancer, melanoma, and hepatocellular carcinoma cells [Citation7,Citation9,Citation12].
Dysregulation of STAT signaling has been reported in a variety of cancers, including CTCL [Citation13]. STAT3 and STAT5 are reported to be constitutively activated during the initial and advanced stages of CTCL, respectively. For instance, signaling of interleukin (IL)-2, IL-7, and IL-15 via JAK1 and JAK3 has been associated with STAT5 activation [Citation14], and IL-21 signaling is known to be indispensable for STAT3 activation [Citation15,Citation16]. STAT5 upregulation results in increased expression of miR-155, an oncogene that may further regulate the mRNA expression of STAT4 [Citation13,Citation17]. In the late stage, STAT3 and STAT5 may be activated in a cytokine-dependent manner and their expression may be regulated by activated JAK1 and JAK3 [Citation17,Citation18]. Therefore, understanding the role of JAK/STAT signaling in the etiology of CTCL may reveal new strategies for CTCL treatment.
Here, we evaluated the effect of miR-337 expression on CTCL cell properties. Our results demonstrate that changes in miR-337 expression in different malignant T cells may influence their viability, metastasis, and apoptosis. Alterations in B cell lymphoma-2 (Bcl-2) and Bax protein and mRNA expression levels confirmed that miR-337 induces apoptosis in CTCL cells. Our study adds to the present understanding of the role of miR-337 as a CTCL inhibitor and may facilitate the development of miR-targeted cancer diagnostics and therapeutics.
Materials and methods
Cell lines
Malignant and non-malignant T cell lines were obtained [Citation19–Citation22] and cultured in Roswell Park Memorial Institute (RPMI)-1640 medium (Sigma-Aldrich, MO, USA) supplemented with 5% penicillin/streptomycin (Sigma-Aldrich).
Cell isolation
Of all the patients with CTCL, 15 were diagnosed with stage IV MF, whereas 15 patients had stage III MF. Biopsy was performed to obtain the specimens of lymph node that were used to collect primary malignant or non-malignant T cells. The protocol was reviewed and approved by the Institutional Review Board of Anhui Medical University, and all patients signed the written informed consent.
Transfection
Transfection was carried out using Lipofectamine 200 (Invitrogen, Carlsbad, CA) according to the manufacturer’s protocol as described previously [Citation23]. For the specific overexpression of miR-337, 20 nM miRNA MIMIC (GAA CGG CUU CAU ACA GGA GUU)/NC (GAU CGA UCG A UC GAU C) from Ribobio (Guangdong, China) was used. pCDNA3-STAT3 and pCDNA3-empty was used at 50 nM for STAT3 overexpression.
Cell counting kit 8 (CCK-8) assay
We measured the viability of CTCL cells using the CCK-8 kit, according to the manufacturer’s instructions. In brief, cells were seeded at a density of 5 × 10³ cells/well in a 96-well plate and cultured up to 80% confluency. These cells were transfected with either an miR-337 mimic or a negative control (NC) mimic. After 24, 48, and 72 h, CCK-8 reagent was added to each well and cell viability was detected after 1 h by measuring the absorbance at 450 nm wavelength.
Bromodeoxyuridine (BrdU) immunofluorescence assay
Malignant cells inoculated in a six-well plate were subjected to transfection with the miR-337 mimic or NC miRNA for 48 h, and were incubated with BrdU for 60 min. Following washes in phosphate-buffered saline, fixation with 4% paraformaldehyde (PFA), and permeabilization with 0.3% Triton X-100, the cells were sequentially incubated overnight with primary antibodies at 4°C and for 2 h with secondary antibodies at 25°C. Cell nuclei were stained with 4′,6-diamidino-2-phenylindole (DAPI), and observed under a fluorescence microscope (Olympus 600 auto-biochemical analyzer). Images were analyzed using the Image-Pro plus software.
Transwell migration assays
Matrigel was coated on the upper surface of a transwell membrane, and the lower chamber was filled with F-12 medium containing 10% fetal bovine serum (FBS). After 24 h, CTCL cells were harvested and cultured in the upper chamber for 24 h. After incubation, the cells from the lower chamber were stained with crystal violet for microscopic observation.
Hoechst 33342 staining
CTCL cells were seeded at a density of 2 × 10⁵ cells/mL in 12-well plates prior to transfection. After 48 h, the cells were washed with PBS and incubated with Hoechst 33342 for 30 min at 37°C in the dark. Ten random fields were observed under a fluorescence microscope and 100 cells were chosen to calculate the ratio of Hoechst 33342-positive cells.
Annexin V-fluorescein isothiocyanate (FITC)/propidium iodide (PI) flow cytometry
MyLa2059, PB2B, and SeAx cells were harvested at 48 h following transfection. Annexin V-FITC/PI apoptosis detection kit was used to detect apoptosis using the Beckman Coulter FACS/Calibur flow cytometer (Beckman Coulter).
Caspase-3/7 activity detection
Activities of caspase-3/7 were determined using colorimetric assay kits, which utilize synthetic tetrapeptides (Asp-Glu-Val-Asp (DEAD) for caspase-3/7) labeled with p-nitroaniline (pNA) (Abcam, ab39401). Briefly, cells were lysed in the supplied lysis buffer. Supernatants were collected and incubated with the supplied reaction buffer containing DTT and DEAD-pNA as substrates at 37°C. The reactions were measured by changes in absorbance at 405 nm using the VERSAmax tunable microplate reader.
Western blot analysis
Cell lysates were prepared using radioimmunoprecipitation assay (RIPA) buffer and protein concentration was measured with a bicinchoninic acid kit. Protein samples were separated using a 10% sodium dodecyl sulfate polyacrylamide gel electrophoresis (SDS-PAGE), and the separated bands were transferred onto polyvinylidene fluoride (PVDF) membranes. The membranes were blocked with 5% bovine serum albumin (BSA) for 1 h at 25°C. Proteins on the membrane were then incubated with the corresponding primary antibodies (STAT3 [1:1000], Bcl-2 [1:2000], Bax [1:1000], and actin [1:5000]) overnight at 4°C, followed by incubation with a secondary antibody for 1 h at room temperature. The blots were visualized using the enhanced chemiluminescence (ECL) kit and a C-Digit Blot Scanner.
RNA extraction and quantitative polymerase chain reaction (qPCR)
Malignant T cells subjected to different treatments were used for extraction of total RNA using Trizol reagent. PCR was performed using SYBR Green on a Roche Light-Cycler 480 Real Time PCR system (Roche, Germany), and the expression levels of miR-337, Bcl-2, and Bax were normalized to the level of glyceraldehyde-3-phosphate dehydrogenase (GAPDH). Expression levels of targeted genes were calculated using the 2−ΔΔCT method.
Dual-luciferase reporter assay (DLRA)
The 3′-UTR luciferase reporter assay was conducted to validate the target gene of miR-337 using the wild type and mutant 3′-UTR of STAT3. The sequences of Renilla luciferase and firefly luciferase were constructed for reporter fluorescence (Rluc) and calibration fluorescence (Luc), respectively. Cells, miRNA mimic, and vectors were mixed, and cultured for 24 h, and luciferase activity was examined using the dual-luciferase reporter assay system.
Statistical analysis
All data were presented as mean ± standard deviation. Intergroup comparison was performed either by one-way analysis of variance (ANOVA) or Student’s t-test. P < 0.05 indicated statistical significance.
Results
miR-337 expression was downregulated in malignant T cell lines
To identify whether miR-337 is a critical regulator of CTCL development, miR-337 expression was examined in six different T cell lines as well as in T cells from patients with MF. The expression of miR-337 was downregulated in several T cell lines (20 samples of advanced CTCL) compared to that in CD41+ T cells ()). In addition, the results of qPCR revealed that miR-337 expression was significantly reduced in the four malignant T cell lines compared with that in the two non-malignant T cell lines ()). These data suggest that malignant T cells or CTCL cells showed downregulation of miR-337 expression compared with that in normal cells or cells from lung tissue.
Figure 1. miR-337 expression in T cells from patients with CTCL and in malignant CTCL cell lines. (a) Decreased expression of miR-337 was observed in T cells from patients with CTCL (n = 30) compared to that in normal human T cells (n = 15). (b) miR-337 levels in malignant T cells and non-malignant cells, MySi and MyLa1850. MySi cells served as controls. Data are represented as mean ± SD. *P < 0.05, **P < 0.01. n = 3.
miR-337 overexpression impaired the viability of malignant T cells
To assess the effect of miR-337 expression on the growth of CTCL cells, the miR-337 mimic and NC miRNA were transfected into MyLa2059, PB2B, and SeAx cells. The expression of miR-337 was increased in all three cell lines after miR-337 mimic transfection (). The CCK8 assay was performed to assess the proliferation of these three cell lines. Compared to the cells transfected with the NC miRNA, those transfected with the miR-337 mimic showed a decrease in growth rate at 24, 48, and 72 h after transfection (). A BrdU immunofluorescence assay was performed to measure cell viability at 48 h after transfection. Compared to the cells from the NC miRNA group, MyLa2059, PB2B, and SeAx cells transfected with the miR-337 mimic showed approximately 80%, 90%, and 80% decreases in cell viability, respectively (). Thus, miR-337 overexpression inhibited the proliferation of these cells.
Figure 2. Effect of miR-337 mimic on the viability of malignant T cells. (a, b, c) Expression of miR-337 in MyLa2059, PB2B, and SeAx cells following transfection with the miR-337 mimic and NC miRNA, as measured by qPCR. (d, e, f) CCK-8 assay of three CTCL cells at 24, 48, and 72 h after transfection. (g, h, i) Proliferation of MyLa2059, PB2B, and SeAx cells after 48 h of transfection, as detected with BrdU incorporation assays. Data are represented as mean ± SD. *P < 0.05, **P < 0.01. n = 3.
miR-337 suppressed the invasion of CTCL cells
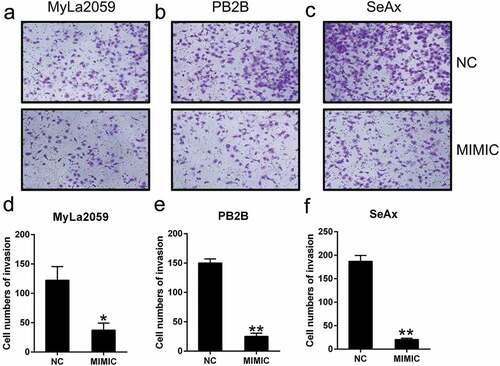
Several studies have reported that the invasion potential of CTCL cells is the major cause for mortality during CTCL progression. To determine whether miR-337 influences the invasion abilities of CTCL cells, a transwell migration assay was performed after the transfection of MyLa2059, PB2B, and SeAx cells with the miR-337 mimic or NC miRNA. We found that miR-337 overexpression resulted in an obvious decrease in the invasion of malignant T cells (). The data revealed that ectopic expression of miR-337 in MyLa2059, PB2B, and SeAx cells inhibited the invasion of these three cell lines (). Thus, miR-337 overexpression may suppress the invasive properties of CTCL cells in vitro.
Figure 3. miR-337 overexpression suppressed the invasion of malignant T cells. After miR-337 plasmid transfection, the invasion capacity of MyLa2059, PB2B, and SeAx cells was measured using a transwell migration assay (a, b, c) and the number of invasive cells was counted (d, e, f). Representative data are expressed as mean ± SD. *P < 0.05, **P < 0.01. n = 3.
Ectopic expression of miR-337 resulted in increased apoptosis of malignant T cells
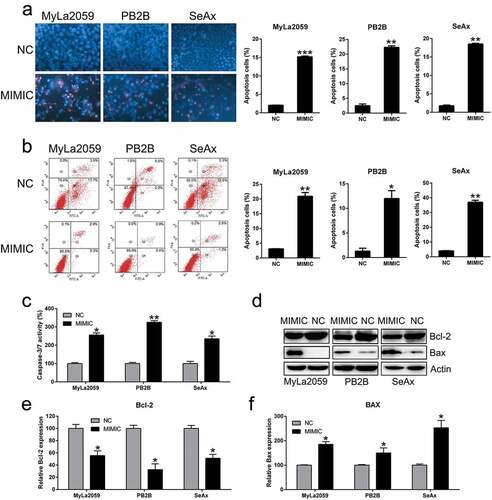
The number of cells stained positive for Hoechst 33342 after 48 h was higher among miR-337-expressing cells than among cells from the NC group (). Flow cytometry analysis demonstrated that miR-337 overexpression caused an increase in the rate of apoptosis in CTCL cell lines (). As miR-337 expression suppresses the proliferative ability and promotes apoptosis in CTCL cells, we investigated the mechanism underlying miR-337-mediated apoptosis. We found that miR-337 could induce apoptosis and caspase activity at 72 h post transfection (). The expression of Bcl-2 (anti-apoptotic) and Bax (pro-apoptotic) was examined by western blotting and qPCR. miR-337 overexpression caused a decrease in the expression of Bcl-2 and an increase in the expression of Bax at both protein () and mRNA () levels compared to that in control cells. These findings suggest the mechanism underlying the effect of miR-337 on apoptosis induction.
Figure 4. Ectopic overexpression of miR-337 enhanced apoptosis in CTCL cells. (a) Hoechst 33342 staining was carried out in each group of malignant T cells transfected with or without miR-337. Magnification, ×200. Apoptotic rate of positive Hoechst 33342 staining in each group of CTCL cells is displayed in the upper panel. (b) Annexin V-FITC/PI staining and flow cytometry was performed to evaluate the number of apoptotic cells. In the right panel, upper and lower quadrants of each plot represent early apoptotic cells. Apoptosis rate analysis of CTCL cells in each group is displayed in the lower panel. (c) miR-337 overexpression increased caspase-3/7 activity in the three CTCL cell lines (MyLa2059, PB2B, and SeAx). (d) Western blotting and (e, f) qPCR analyses were performed to assess the protein and mRNA levels, respectively, of Bcl-2 and Bax, which were regulated by miR-337 overexpression. Data are represented as mean ± SD. *P < 0.05, **P < 0.01 versus NC group. n = 3.
miR-337 targeted the 3′-untranslated region (UTR) of STAT3
STAT3 expression has been related to tumor metastasis and cellular apoptosis in various cancers mediated by miR-337 [Citation7,Citation9,Citation12]. Therefore, we determined the effect of miR-337 expression on STAT3 in CTCL cells. STAT3 expression was upregulated in CTCL cells from the patients with MF compared to that in patients with normal CD41+ T cells (). Furthermore, STAT3 levels were higher in malignant cell lines than those in the non-malignant cell lines (). Bioinformatics prediction suggested that miR-337 may target the 3′-UTR of STAT3 (). Direct binding between miR-337 and the 3′-UTR of STAT3 was detected via the dual-luciferase reporter assay (). These findings revealed that luciferase function was inhibited by 60% following transfection with the miR-337 mimic that was fused with the 3′-UTR of STAT3 compared to that in the other control groups.
Figure 5. miR-337 directly targets STAT3. (a) An increase in STAT3 expression was observed in T cells from patients with MF (n = 20) compared to that in normal human T cells (n = 10). (b) STAT3 levels in malignant T cells (MyLa2059, PB2B, SeAx, and SeZ4.1) compared to those in non-malignant cells, MySi and MyLa1850. MySi cells served as the control. (c) Graphical representation of the conserved miR-337-binding motif at the 3′-UTR of STAT3. (d) Luciferase activity displayed by luciferase reporter constructs carrying either the 3′-UTR of the wild-type (WT) or mutant (MU) human STAT3 after miR-337 mimic transfection in 293T cells. Luciferase activity was normalized to the activity of β-galactosidase. The miR-337 mimic markedly decreased the relative luciferase activity of cells carrying the 3′-UTR WT but not in cells with the 3′-UTR MU. Western blotting (e, f, g) and qPCR (h, i, j) analyses were used to evaluate STAT3 protein and mRNA levels, respectively, after transfection of malignant T cells (MyLa2059, PB2B, SeAx) with the miR-337 mimic and NC miRNA. Data are represented as mean ± SD. *P < 0.05, **P < 0.01 versus normal group. n = 3.
We also analyzed the effect of miR-337 overexpression on STAT3 levels in MyLa2059, PB2B, and SeAx cells using western blotting and qPCR. STAT3 expression was significantly downregulated following transfection with the miR-337 mimic (). These results demonstrate that STAT3 expression in CTCL cells was decreased following the ectopic expression of miR-337 and that miR-337 potentially targets the 3′-UTR of STAT3.
STAT3 overexpression reversed the effect of miR-337 on CTCL cell properties
To determine whether STAT3 overexpression may suppress the influence of miR-337 on CTCL properties such as viability, invasion, and apoptosis, STAT3 expression was elevated in MyLa2059, PB2B, and SeAx cells co-transfected with the miR-337 mimic. Western blotting and qPCR analyses were performed to confirm the increased STAT3 levels in cells ().
Figure 6. STAT3 was artificially overexpressed in malignant T cells (MyLa2059, PB2B, SeAx) co-transfected with miR-337 mimic. MyLa2059, PB2B, and SeAx cells were co-transfected with miR-337 mimic and a STAT3-expressing vector. Western blotting (a, b, c) and qPCR (d, e, f) analyses were performed to confirm the ectopic expression of STAT3. Data are represented as mean ± SD. *P < 0.05, **P < 0.01 versus normal group. n = 3.
Overexpression of STAT3 resulted in the recovery of miR-377-mediated suppression of MyLa2059, PB2B, and SeAx cell proliferation, as evident from the results of the CCK assay, compared with the NC group ().
Figure 7. STAT3 overexpression restored the viability and invasion ability of malignant T cells and decreased their apoptosis. (a, b, c) The viability of three CTCL cells (with different transfection, NC+oeNC, NC+oeSTAT3, MIMIC+oeNC, and MIMIC+oeSTAT3) was measured with the CCK-8 assay at 24, 48, and 72 h post-transfection. (d, e, f) Invasion capacity of MyLa2059, PB2B, and SeAx cells (with different transfection, NC+oeNC, NC+oeSTAT3, MIMIC+oeNC, and MIMIC+oeSTAT3) was measured using a transwell migration assay. (g, h, i) Annexin V-FITC/PI flow cytometry was performed to detect the number of apoptotic cells in MyLa2059, PB2B, and SeAx cells subjected to different transfection treatments. Apoptotic cells are shown in the upper and lower right quadrants of each plot. Data represent the mean ± SD. *P < 0.05, compared with the indicated group. n = 3.
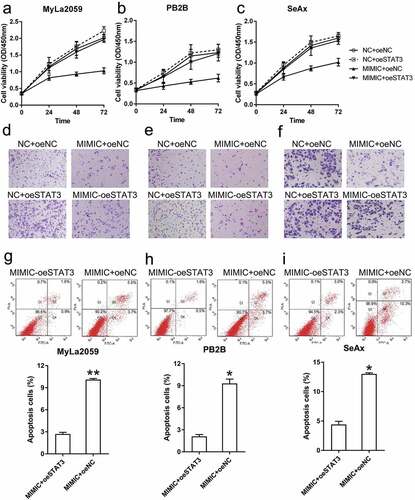
To determine whether STAT3 overexpression is involved in regulating the inhibitory effect of miR-337 on CTCL cell invasion, we performed a transwell migration assay with MyLa2059, PB2B, and SeAx cells transfected with different agents. STAT3-overexpressing cells exhibited higher invasive capacity than cells from the NC group, and in miR-337 mimic transfected cells, STAT3 overexpression restored the number of invading cells ().
To evaluate how STAT3 alters apoptosis in these malignant T cells, MyLa2059, PB2B, and SeAx cells were subjected to Annexin V-FITC/PI flow cytometry analysis. Increase in STAT3 expression led to a noticeable decrease in the number of apoptotic cells in the miR-337 mimic transfected group (). Taken together, these data suggest that STAT3 overexpression restored the malignant properties of T cells that were impaired by miR-337 expression.
Discussion
Development of cancer is a synergetic process associated with the function of many oncogenes that mediate epigenetic changes. Although CTCL has been broadly investigated in previous studies, the pathogenesis of CTCL is incompletely elucidated owing to its complexity and variations. This study reveals that miR-337 expression was downregulated in a variety of CTCL cell lines and that miR-377 may affect the key properties of CTCL cells. Overexpression of miR-337 in malignant T cell lines suppressed the proliferative ability and migration of CTCL cells and simultaneously triggered their apoptosis. Furthermore, miR-337 expression suppressed the expression of STAT3, a key downstream modulator belonging to the JAK/STAT signaling pathway. DLRA data revealed the direct binding of miR-337 to the 3′-UTR of STAT3. Our findings strongly suggest that miR-337 acts as a tumor suppressor by targeting the STAT3 gene and provide evidence for its use as a potential agent in CTCL therapy.
miRNAs may affect biological reactions via modulation of their target gene functions. Aside from JAK2 and STAT3, miR-337 may target different genes, including tumor necrosis factor-related apoptosis-inducing ligand (TRAIL) [Citation24], high mobility group at-hook 2 (HMGA2) [Citation25], phosphatase and tensin homolog (PTEN) [Citation26], hepatocyte nuclear factor 4α [Citation27], myeloid zinc finger 1 (MZF1) [Citation28], and matrix metallopeptidase 14 (MMP-14) [Citation29], all of which are involved in the progression of different tumors and diseases. In the present study, we performed bioinformatics analysis to show that miR-337 may target the conserved site of STAT3. DLRA data showed that STAT3 directly interacted with miR-337 in CTCL. STAT3 expression is reported to be correlated with multiple biological processes [Citation30,Citation31] and the phosphorylated form of STAT3 is known to modulate the expression of various genes and pro-apoptotic factors including Bcl-xL, Bcl-2, vascular endothelial growth factor (VEGF), and MMPs [Citation30–Citation33]. Constitutive STAT3 expression has been consistently detected in advanced stages of CTCL [Citation34]. Constitutive phosphorylation of STAT3 is reported to prevent apoptosis in malignant T cells [Citation16] and may significantly increase the levels of VEGF and MMPs [Citation35]. In this study, STAT3 expression was decreased after transfection of cells with a miR-337 mimic, and overexpression of STAT3 in CTCL cell lines restored the properties (viability and metastasis) of CTCL cells ablated by miR-337. These results suggest that miR-337 expression may essentially attenuate CTCL tumorigenesis via modulation of STAT3 expression.
In summary, this study demonstrates the tumor suppressor role of miR-337 that may impair the malignant properties of CTCL cells. However, we were unable to evaluate factors other than STAT3 targeted by miR-337 that contribute to CTCL pathogenesis. In this direction, modified high throughput sequencing coupled with crosslinking immunoprecipitation (HITS-CLIP) and the miR-Trap method [Citation36] will be carried out in our future investigations to screen and identify the targets of biotin-labeled miR-337 in malignant T cells. This novel technique could provide a more precise and comprehensive interpretation of miR-337 involvement in CTCL.
Disclosure statement
No potential conflict of interest was reported by the authors.
References
- Willemze R, Jaffe ES, Burg G, et al. WHO-EORTC classification for cutaneous lymphomas. Blood. 2005;105:3768–3785.
- Bartel DP. MicroRNAs: genomics, biogenesis, mechanism, and function. Cell. 2004;116(2):281–297.
- Xiao C, Rajewsky K. MicroRNA control in the immune system: basic principles. Cell. 2009;136(1):26–36.
- Ventura A, MicroRNAs JT. and cancer: short RNAs go a long way. Cell. 2009;136(4):586–591.
- Ballabio E, Mitchell T, van Kester MS, et al. MicroRNA expression in Sezary syndrome: identification, function, and diagnostic potential. Blood. 2010;116:1105–1113.
- Ralfkiaer U, Hagedorn PH, Bangsgaard N, et al. Diagnostic microRNA profiling in cutaneous T-cell lymphoma (CTCL). Blood. 2011;118:5891–5900.
- Du L, Subauste MC, DeSevo C, et al. miR-337-3p and its targets STAT3 and RAP1A modulate taxane sensitivity in non-small cell lung cancers. PLoS One. 2012;7:e39167.
- Kim SY, Lee YH, Bae YS. MiR-186, miR-216b, miR-337-3p, and miR-760 cooperatively induce cellular senescence by targeting alpha subunit of protein kinase CKII in human colorectal cancer cells. Biochem Biophys Res Commun. 2012;429(3–4):173–179.
- Xiao W, Yao E, Zheng W, et al. miR-337 can be a key negative regulator in melanoma. Cancer Biol Ther. 2017;18:392–399.
- Zhang R, Leng H, Huang J, et al. miR-337 regulates the proliferation and invasion in pancreatic ductal adenocarcinoma by targeting HOXB7. Diagn Pathol. 2014;9:171.
- Zhang R, Zheng S, Du Y, et al. Levels of HOXB7 and miR-337 in pancreatic ductal adenocarcinoma patients. Diagn Pathol. 2014;9:61.
- Zuo XL, Chen ZQ, Wang JF, et al. miR-337-3p suppresses the proliferation and invasion of hepatocellular carcinoma cells through targeting JAK2. Am J Cancer Res. 2018;8:662–674.
- Litvinov IV, Cordeiro B, Fredholm S, et al. Analysis of STAT4 expression in cutaneous T-cell lymphoma (CTCL) patients and patient-derived cell lines. Cell Cycle. 2014;13:2975–2982.
- Dobbeling U. Transcription factor profiling shows new ways towards new treatment options of cutaneous T cell lymphomas. Curr Drug Discov Technol. 2007;4(1):24–30.
- van der Fits L, Out-Luiting JJ, van Leeuwen MA, et al. Autocrine IL-21 stimulation is involved in the maintenance of constitutive STAT3 activation in Sezary syndrome. J Invest Dermatol. 2012;132:440–447.
- Nielsen M, Kaestel CG, Eriksen KW, et al. Inhibition of constitutively activated Stat3 correlates with altered Bcl-2/Bax expression and induction of apoptosis in mycosis fungoides tumor cells. Leukemia. 1999;13:735–738.
- Kopp KL, Ralfkiaer U, Gjerdrum LM, et al. STAT5-mediated expression of oncogenic miR-155 in cutaneous T-cell lymphoma. Cell Cycle. 2013;12:1939–1947.
- van Kester MS, Out-Luiting JJ, von Dem Borne PA, et al. Cucurbitacin I inhibits Stat3 and induces apoptosis in Sezary cells. J Invest Dermatol. 2008;128:1691–1695.
- Eriksen KW, Kaltoft K, Mikkelsen G, et al. Constitutive STAT3-activation in Sezary syndrome: tyrphostin AG490 inhibits STAT3-activation, interleukin-2 receptor expression and growth of leukemic Sezary cells. Leukemia. 2001;15:787–793.
- Krejsgaard T, Ralfkiaer U, Clasen-Linde E, et al. Malignant cutaneous T-cell lymphoma cells express IL-17 utilizing the Jak3/Stat3 signaling pathway. J Invest Dermatol. 2011;131:1331–1338.
- Krejsgaard T, Vetter-Kauczok CS, Woetmann A, et al. Jak3- and JNK-dependent vascular endothelial growth factor expression in cutaneous T-cell lymphoma. Leukemia. 2006;20:1759–1766.
- Kopp KL, Kauczok CS, Lauenborg B, et al. COX-2-dependent PGE(2) acts as a growth factor in mycosis fungoides (MF). Leukemia. 2010;24:1179–1185.
- Kamstrup MR, Gjerdrum LMR, Biskup E, et al. Notch 1 as a potential therapeutic target in cutaneous T-cell lymphoma. Blood. 2010; blood-2009-12-260216.
- Park JK, Doseff AI, Schmittgen TD. MicroRNAs Targeting Caspase-3 and −7 in PANC-1 Cells. Int J Mol Sci. 2018;19:4.
- Cui H, Song R, Wu J, et al. MicroRNA-337 regulates the PI3K/AKT and Wnt/beta-catenin signaling pathways to inhibit hepatocellular carcinoma progression by targeting high-mobility group AT-hook 2. Am J Cancer Res. 2018;8:405–421.
- Huang Z, Zhang N, Ma W, et al. MiR-337-3p promotes chondrocytes proliferation and inhibits apoptosis by regulating PTEN/AKT axis in osteoarthritis. Biomed Pharmacother. 2017;95:1194–1200.
- Demarez C, Gerard C, Cordi S, et al. MicroRNA-337-3p controls hepatobiliary gene expression and transcriptional dynamics during hepatic cell differentiation. Hepatology. 2018;67:313–327.
- Zheng L, Jiao W, Mei H, et al. miRNA-337-3p inhibits gastric cancer progression through repressing myeloid zinc finger 1-facilitated expression of matrix metalloproteinase 14. Oncotarget. 2016;7:40314–40328.
- Xiang X, Mei H, Zhao X, et al. miRNA-337-3p suppresses neuroblastoma progression by repressing the transcription of matrix metalloproteinase 14. Oncotarget. 2015;6:22452–22466.
- Masuda M, Suzui M, Yasumatu R, et al. Constitutive activation of signal transducers and activators of transcription 3 correlates with cyclin D1 overexpression and may provide a novel prognostic marker in head and neck squamous cell carcinoma. Cancer Res. 2002;62:3351–3355.
- Kim BH, Yi EH, Ye SK. Signal transducer and activator of transcription 3 as a therapeutic target for cancer and the tumor microenvironment. Arch Pharm Res. 2016;39(8):1085–1099.
- Cafferkey C, Novel CI. STAT 3 inhibitors for treating gastric cancer. Expert Opin Investig Drugs. 2016;25(9):1023–1031.
- Bosch-Barrera J, Queralt B, Menendez JA. Targeting STAT3 with silibinin to improve cancer therapeutics. Cancer Treat Rev. 2017;58:61–69.
- Netchiporouk E, Litvinov IV, Moreau L, et al. Deregulation in STAT signaling is important for cutaneous T-cell lymphoma (CTCL) pathogenesis and cancer progression. Cell Cycle. 2014;13:3331–3335.
- Yu H, Jove R. The STATs of cancer–new molecular targets come of age. Nat Rev Cancer. 2004;4(2):97–105.
- Baigude H, Ahsanullah, Li Z, et al. miR-TRAP: a benchtop chemical biology strategy to identify microRNA targets. Angew Chem Int Ed Engl. 2012;51:5880–5883.