
ABSTRACT
Mitosis has been traditionally considered a metabolically inactive phase. We have previously shown, however, that extensive alterations in lipids occur as the cells traverse mitosis, including increased de novo fatty acid (FA) and phosphatidylcholine (PtdCho) synthesis and decreased lysophospholipid content. Given the diverse structural and functional properties of these lipids, we sought to study their metabolic fate and their importance for cell cycle completion. Here we show that FA and PtdCho synthesized at the mitotic exit are destined to the nuclear envelope. Importantly, FA and PtdCho synthesis, but not the decrease in lysophospholipid content, are necessary for cell cycle completion beyond G2/M. Moreover, the presence of alternative pathways for PtdCho synthesis renders the cells less sensitive to its inhibition than to the impairment of FA synthesis. FA synthesis, thus, represents a cell cycle-related metabolic vulnerability that could be exploited for combined chemotherapy. We explored the combination of fatty acid synthase (FASN) inhibition with agents that act at different phases of the cell cycle. Our results show that the effect of FASN inhibition may be enhanced under some drug combinations.
Introduction
Cancer cell metabolic reprogramming includes increased de novo lipogenesis to support cellular growth and proliferation. This has roused the interest of lipogenic enzymes as putative targets for cancer treatment [Citation1–Citation4]. Although the importance of lipogenesis for cell proliferation and survival is well established, much less is known about its coordination with cell cycle progression.
Phosphatidylcholine (PtdCho), the main phospholipid in mammalian cells, is synthesized throughout the cell cycle but the bulk net accumulation is thought to occur at S phase [Citation5–Citation7]. De novo synthesis and degradation of different phospholipids has also been documented at mitosis [Citation8–Citation11]. During mitosis and cytokinesis major processes involving membrane expansion and remodelling occur. In regards to the plasma membrane, cytokinesis entails an increase surface area to volume ratio and profound curvature changes at the cleavage furrow. Another membrane structure that undergoes major changes at the mitotic exit is the nuclear envelope (NE), which is reassembled and expanded at telophase. Although these processes presume changes in membrane lipids, little is known about lipid metabolism at G2 and M phases of the cell cycle.
Different mechanisms have been reported to account for the increase in plasma membrane surface upon cytokinesis, including the smoothing of stored external surface as microvilli [Citation12,Citation13] and the recycling of previously internalized plasma membrane back to the cell surface [Citation14]. Phospholipid synthesis may be required to compensate for the increased surface area to volume ratio after cytokinesis. In addition to the requirements for bulk membrane expansion, localized synthesis or changes in composition of lipids may be important for structural membrane changes. In this regard, it has been reported that a localized production of phosphatidylinositol 4,5-bisphosphate and translocation of phosphatidylethanolamine to the cell surface at the cleavage furrow are required for proper cytokinesis [Citation15,Citation16]. Extensive membrane reorganization is also observed upon reassembly and expansion of the NE [Citation17]. The importance of lipid composition underlying membranes alterations during cell division is becoming apparent [Citation18]; their function and regulation are, however, poorly understood.
We have previously shown that extensive alterations in lipids occur as the cells traverse mitosis. Lysophospholipid levels (product of phospholipid hydrolysis) decreases drastically from G2/M to G1 phase while de novo PtdCho synthesis increases, suggesting that enhanced membrane production is concomitant to a decrease in its turnover. In addition, fatty acid (FA) synthesis and incorporation into membranes is increased upon cell division, paralleling acetyl-CoA carboxylase activity (the rate-limiting enzyme of the pathway). Importantly, the inhibition of fatty acid synthesis induces cell cycle arrest at G2/M, before anaphase, in a variety of cancer cells, despite the presence of abundant fatty acids in the media [Citation19]. Our results showed that de novo FA synthesis is essential for cell cycle completion. The function and cellular fate of these lipids are, however, largely unknown. Given that the nuclear and plasma membranes undergo profound structural changes at the mitotic exit, we sought to study the fate of these newly synthesized lipids and the biological consequences of their alteration. We also evaluated the effect of the combined inhibition of lipogenesis and anticancer agents on cellular proliferation in vitro. A better knowledge of the “lipogenic checkpoint” at G2/M may help to understand the metabolic requirements during the cell cycle and to design rational schedules of combined therapies to treat cancer.
Materials and methods
Materials
The alkyl-lysophospholipid edelfosine (1-Octadecyl-2-methylglycero-3-phosphorylcholine SML0332), propidium iodide, ribonuclease A, C75, thymidine, etoposide, CI-976, choline metabolites used for standards, fatty acid free bovine serum albumin (BSA), nocodazole, Hoechst 33342, and other reagents were purchased from Sigma. [1-14C]Acetate, sodium salt, 59 mCi/mmol and [methyl-3H]choline chloride, 83 Ci/mmol, were purchased from Amersham. Lysopalmitoyl phosphatidylcholine-L-1-[palmitoyl-1-14C], 56 mCi/mmol, was purchased from New England Nuclear. Staurosporine and 5-fluorouracil were kind gifts from Dr Ezequiel Lacunza (National University of La Plata, Argentina). Tissue culture material was purchased from Greiner BioOne, low and high glucose Dulbecco's Modified Eagle Medium (DMEM), vitamins and penicillin/streptomycin were purchased from Gibco. Fetal bovine serum (FBS) was purchased from Natocor and lipid standards from Nu-Check Prep. Alexa 488-azide was purchased from Invitrogen. 5-Bromo-2′-deoxyuridine (BrdU) was purchased from UpState and FITC-conjugated anti-BrdU antibody was purchased from BD Biosciences. Propargyl-choline was a kind gift from Dr Adrian Salic (Harvard University, USA). Crystal violet was purchased from Biopack. ON-TARGET Plus small interfering RNA (siRNA) targeting FASN, CTα or a non-targeting pool were purchased from Dharmacon. Lipofectamine RNAiMax and SuperSignal West Pico were purchased from Thermo-Fisher. PVDF membrane was purchased from GE Healthcare Amersham.
Cell culture and synchronization
HeLa cells (from ATCC) were routinely grown in DMEM supplemented with 10% FBS, 100 units penicillin/ml and 100 µg streptomycin/ml (P/S), 37°C, 5% CO2 and 100% humidity. One week prior to seeding for the experiments, the media was changed to low glucose DMEM (5 mM), which approximates normal blood glucose levels in vivo, supplemented with 10% FBS and P/S. Unless otherwise stated, 3.2 × 10⁵ HeLa cells were seeded in 60 mm dishes and allowed to grow for 24 h. For microscopy studies, the cells were grown on glass coverslips. For the subcellular fractionation assays, 5 × 10⁵ cells were seeded in 100 mm dishes. Cells were synchronized at the G1/S boundary by double thymidine block (2TB) or at mitosis by thymidine-nocodazole block as previously described [Citation20].
Cell number and viability
Cell number was quantitated by hemocytometer and viability was estimated by Trypan-Blue exclusion or cleaved PARP content (by Western Blot). Alternatively, total cell mass was assessed by Crystal violet staining as described previously [Citation21].
Transfection
The cells were transfected with ON-TARGET Plus siRNA (Dharmacon) targeting human fatty acid synthase (FASN), CTP:phosphocholine cytidylyltransferase (PYCT1A, CTα) or a Non-Targeting pool (NT) at 10 nM for 4–6 h using Lipofectamine RNAiMAX Transfection Reagent (ThermoFisher) according to the manufacturers’ instructions. The cells were harvested at 48 h and the knockdown was confirmed by Western Blot. siRNA targeting sequences are provided in Supplemental Table 3.
Metabolic labelling and lipid analysis
Cells were synchronized as described above by 2TB, released from the blockage in fresh media for 8 h. The cells were labelled with 1–2 μCi/dish (0.5 μCi/ml) of [1-14C] Acetic acid for 2 h in growing media. Subcellular fractions were obtained as described below. The lipids were extracted from each fraction as described by Bligh & Dyer [Citation22] and analysed as described in [Citation23].
CTP:phosphocholine cytidylyltransferase activity was estimated as described by Bagnato et al [Citation24]. Briefly, the cells were incubated with 1 μCi/ml [methyl-3H]choline for 4 h. The lipids were extracted as described by Bligh & Dyer and the aqueous phases were dried, dissolved in water, spotted on silica gel chromatoplates, and resolved with 0.6% sodium chloride, methanol, 30% ammonium hydroxide; 50:50:5 (by vol). Pure choline, CDP-choline, phosphocholine, acetyl-choline and betaine standards were run in parallel. The standards were visualized by charring and the radiolabelled choline metabolites were scrapped from the chromatoplate and quantified by scintillation counting.
LysoPtdCho acyl-transferase activity was estimated by conversion of Lysopalmitoyl phosphatidylcholine-L-1-[palmitoyl-1-14C] to [14C] PtdCho. Briefly, the cells were incubated with LysoPtdCho (previously purified by thin layer chromatography – TLC- to remove hydrolysed palmitate) in FBS-free DMEM with 0.5% FA-free bovine serum albumin for 2 h. The lipids were extracted as described and resolved by TLC in chloroform:methanol:acetic acid:water (50:37.5:3.5:2 by vol). The radiolabelled metabolites were scrapped from the chromatoplate and their radioactivity quantified by scintillation counting.
The subcellular fate of the de novo synthesized PtdCho was assessed by propargyl-choline according to [Citation25]. Briefly, cells were plated on coverslips and synchronized at the G1/S boundary as described above by 2TB. The cells were labeled with 2 mM propargyl-Cho bromide in complete media for 2 h between 8 and 10 h after release. Alternatively, the cells synchronized at mitosis by nocodazole block as previously described were labeled with 2 mM propargyl-Cho bromide in complete media for 2 h after release. The samples were processed for microscopy as described below.
Flow cytometry
Cell cycle distribution was analysed as described previously [Citation19] in a FACSCalibur or Accuri C6Plus cytometer (Becton Dickinson) and FlowJo software. At least ten thousand events were acquired per sample.
Subcellular fractionation
Synchronized or asynchronously growing cells were trypsinized, pelleted by centrifugation and rinsed with phosphate buffered saline. The cells were resuspended in isolation medium (250 mM sucrose, 1 mM EGTA-Tris, 2 mM MgCl2, 10 mM HEPES-Tris pH 7.4 as described in [Citation26]), and centrifuged to remove salts. The pellets were resuspended in a slightly hypotonic buffer (isolation medium containing 125 mM sucrose), incubated on ice for 15 min and homogenized with a 27 G needle. The cell lysates were brought to isotonicity (250 mM sucrose) and centrifuged at 4ºC for 1 h at 170,000 g. The supernatant (cytosolic fraction) was set aside and the pellets were resuspended in 1ml isolation medium containing 30% sucrose. The samples were placed on a discontinuous (30/35/40/70% w/v) sucrose-isolation media gradient and centrifuged at 100,000 g for 17 h at 4ºC in a (SW 60Ti Beckman Coulter Ultracentrifuge) [Citation27]. An aliquot of the fractions collected (1 to 8 from the top to the bottom) was used for Western Blot. The lipids were extracted from each fraction as described previously. The sucrose concentration across the gradient was verified by refractometry. The purity and distribution of the subcellular fractions across the gradient were assessed by immunoblotting as described below.
Immunofluorescence and fluorescence microscopy
Cells incubated with propargyl-Choline and processed as described above, were fixed with 4% p-formaldehyde 4% sucrose in phosphate buffered saline (PBS), were let to react with 10 µM Alexa488-azide, 1 mM CuSO4, 100 mM Tris pH8.5 and 50 mM ascorbic acid for 30 min at room temperature and washed 3 times with PBS. After counterstaining with Hoechst, the coverslips were mounted onto microscope glass slides with MOWIOL and stored at 4°C until analysis. The cells were imaged by fluorescence microscopy and phase contrast in an Olympus BX51 microscope. Alternatively, propargyl-Cho-Alexa 488-labeled cells were incubated with 3% BSA in PBS 0.1% (v/v) Triton X-100 at room temperature for 60 min, followed by incubation at 37°C for 60 min with 1:100 mouse anti-Lamin A/C antibody (Millipore) a kind gift from Dr. Nicolas Favale (Buenos Aires University, Argentina). Primary interactions were detected using a 1:500 F(ab´)2 fragment of goat anti-mouse IgG conjugated with Cy3 (Jackson ImmunoResearch) [Citation28]. ER was labeled with 1:250 Alexa 647-conjugated concanavalin A (Molecular Probes) kindly provided by Dr. Nicolas Favale (Buenos Aires University, Argentina) as described in [Citation28]. Anti-CTα for immunofluorescence studies was a kind gift from Dr. Rosemary Cornell (Simon Fraser University, Canada). The coverslips were mounted on microscope glass slides with MOWIOL and stored at 4°C until analyzed. Images of confocal immunofluorescence were obtained with an Olympus FV1000 confocal microscope and analyzed with ImageJ software. Manders’s overlap coefficient was obtained using JaCoP plugin on Image J [Citation29]. The Costes thresholding method was used to determine the threshold values [Citation30]. At least 20 cells (n = 20) were analyzed in three different experiments.
Immunoblotting
Cells were lysed in 1% NP-40 buffer with protease inhibitors. The lysates were cleared by centrifugation and 20–50 μg of protein, resolved on 12% Tris-glycine SDS-polyacrylamide gels, were transferred to PVDF membrane. The following antibodies were used: anti-Cyclin B1, anti-CTα, anti-PARP, anti-Cyclin D1, anti-Caspase 3, anti-ERp72 and anti-Vinculin (Cell Signaling Technology), anti-FASN (BD Transduction laboratories), anti-β-actin (Sigma), anti-Histone H3 (Abcam). Anti Na/K ATPase and anti-Tom 20 (Santa Cruz Biotechnology) were kind gift from Dr. Cecilia Mundiña (National University of La Plata, Argentina) and Dr. Jimena Martinez (Buenos Aires University, Argentina), respectively. Anti-CTβ 1N was kindly provided by Dr Claudia Banchio (Institute of Molecular and Cell Biology of Rosario, Argentina). The densitometric analysis was carried out using Quantity One Software (Bio-Rad)
Protein quantification
Total cellular protein content was quantified by the Bradford protein assay using bovine serum albumin as standard.
Drug treatment and analysis
Except for CI-976, the cells were incubated with different drugs for 24 h in full low glucose DMEM. For the experiments with CI-976, the cells were washed and incubated with FBS-depleted DMEM since serum has been shown to inhibit the action of CI-976 [Citation31]. Twenty-four hour depletion of FBS has no effect on cell cycle progression in HeLa cells [Citation19]. For the drug combinations, the cells were incubated simultaneously with the indicated concentrations for 24 h and processed for crystal violet dye assay. The fraction affected (Fa) was calculated as described by Topaly et al [Citation32] and the combination index (CI) was calculated with CompuSyn Software and interpreted as described by Ichite et al. [Citation33]. The CI is a quantitative measure of the degree of interaction between different drugs. If CI = 1, it denotes additivity; if CI > 1, it denotes antagonism; if CI < 1, it denotes synergism. Only the drugs that showed an R squared ≥ 0.8 for dose-effect as single agents were used for combination assays. Alternatively, the cells were transfected with siRNA targeting FASN or a Non-targeting pool for 48 h. Twenty-four hours prior the harvesting, the cells were incubated with 80 μM etoposide or vehicle.
Statistical analysis
Unless otherwise stated, the experiments were performed at least twice with 2–4 biological replicates per group per experiment. Statistically significant differences were assessed by unpaired t-test or two way ANOVA with Tukey's multiple comparison test. A representative experiment is shown as mean ± S.D. A P-value < 0.05 was considered statistically significant.
Results
De novo synthesized fatty acids are directed to the nuclear envelope (NE) at the mitotic exit
De novo FA synthesis increases as the cells traverse mitosis [Citation19]. In order to assess the subcellular fate of this newly synthesized FA, we combined metabolic labeling of synchronized cells with subcellular fractionation by ultracentrifugation. The synchronized cells traversed mitosis from 8 to 10 h after the thymidine blockage (2TB) release as previously reported [Citation19] and evidenced by Cyclin B1 levels (Supplemental Figure 1.A). Thus, the cells were incubated with [1-14C] acetate from 8 to 10 h after the 2TB to assess their subcellular fate. The distribution of the subcellular fractions was analyzed by Western Blot using specific markers ((a) and Supplemental Figure 1.B). The plasma membrane marker was predominantly in the upper fractions of the gradient (1 to 4). The mitochondria marker was found mainly in fraction 6 whereas the endoplasmic reticulum (ER) and nucleus markers were restricted to the bottom of the gradient (fractions 7 and 8). A similar distribution of the markers was obtained from the asynchronous population (data not shown). In all fractions, most of the acetate-derived label was found in phospholipids (mainly PtdCho) (results not shown). Cells traversing mitosis incorporated most of the [1-14C] acetate in lipids associated to fractions 6–8 and only reduced amounts in the plasma membrane-associated fractions of the gradient ((b)). We found a similar acetate incorporation into mitochondrial fraction in synchronized and asynchronously growing cells (Supplemental Figure 1.C), consistent with previous reports showing continuous growth of mitochondrial membranes throughout the cell cycle [Citation34]. Thus, these results suggests that the increased de novo synthesized FA at the mitotic exit are directed to the NE.
Figure 1. De novo synthesized lipids are directed to the nuclear envelope upon mitosis. Synchronized HeLa cells were incubated for 2 h (from G2/M) with [14C]acetate. Homogenates were centrifuged for 1 h at 170,000 g 4°C. A sucrose gradient was assembled with the resuspended pellet and centrifuged for 17 h at 100,000 g at 4°C. Fractions named 1 to 8 from top to bottom of the gradient were set-apart. An aliquot of the gradient fractions was used for Western Blot. Markers for plasma membrane (Na+/K+ ATPase), mitochondria (Tom 20), endoplasmic reticulum (ERp72) and nucleus (Histone H3) were assessed in each fraction. The percentage of each marker signal across the gradient was calculated (a). The remaining sample was used for lipid extraction. The lipid-associated radioactivity was quantitated by scintillation counting in each fraction (b).
![Figure 1. De novo synthesized lipids are directed to the nuclear envelope upon mitosis. Synchronized HeLa cells were incubated for 2 h (from G2/M) with [14C]acetate. Homogenates were centrifuged for 1 h at 170,000 g 4°C. A sucrose gradient was assembled with the resuspended pellet and centrifuged for 17 h at 100,000 g at 4°C. Fractions named 1 to 8 from top to bottom of the gradient were set-apart. An aliquot of the gradient fractions was used for Western Blot. Markers for plasma membrane (Na+/K+ ATPase), mitochondria (Tom 20), endoplasmic reticulum (ERp72) and nucleus (Histone H3) were assessed in each fraction. The percentage of each marker signal across the gradient was calculated (a). The remaining sample was used for lipid extraction. The lipid-associated radioactivity was quantitated by scintillation counting in each fraction (b).](/cms/asset/afd19a4b-a557-4e02-b5ad-41bfaa6f5463/kccy_a_1629792_f0001_b.gif)
Newly synthesized PtdCho colocalizes with ER and nuclear membrane markers
We previously showed that de novo PtdCho synthesis increases at the mitotic exit [Citation19]. To evaluate the subcellular distribution of these newly synthesized phospholipids, we used a choline analog that, by means of a propargyl group, can be detected using a click chemistry reaction [Citation25]. Newly synthesized choline-containing lipids were incorporated in the nuclear/perinuclear region (), consistent with a nuclear membrane-ER distribution. To study more precisely the localization of these lipids, we performed colocalization studies by confocal microscopy. Propargil-choline containing lipids colocalized with markers of the ER () and nuclear membranes () (Manders overlap coefficients (r) 0.86 ± 0.05 and 0.84 ± 0.07, respectively) further supporting the evidence that the de novo synthesized phospholipids at the mitotic exit are directed to the NE.
Figure 2. Cellular distribution of choline at the mitotic exit. HeLa cells, synchronized by 2TB (a–d) or nocodazole (e–h), were incubated with 2 mM prop-Cho in complete media for 2 h (G2/M to G1 transition). The cells were fixed and reacted with 10 µM azide-Alexa488 (c and g). After counterstaining with Hoechst (b and f), the cells were imaged by fluorescence microscopy and phase contrast at 100X in an Olympus BX51 microscope. (a) and (e), bright field; (d) and (h), merged.
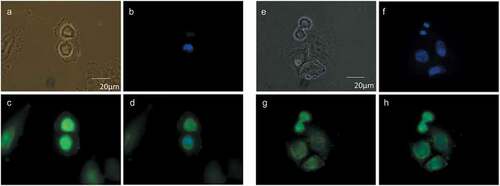
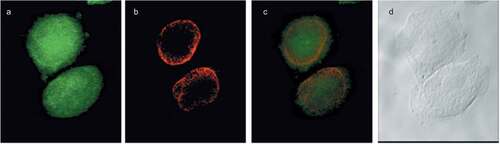
Figure 3. Choline containing lipids synthesized as the cells transverse mitosis colocalize with ER membrane marker. HeLa cells, synchronized by 2TB and released for 8 h, were incubated with 2 mM prop-Cho for 2 h. The cells were fixed and processed for immunofluorescence with Alexa 488-azide (b) and Alexa 647-conjugated concanavalin A (c) and analyzed by confocal microscopy (Olympus FV1000 microscope). (a) Hoechst staining; (d) merged.
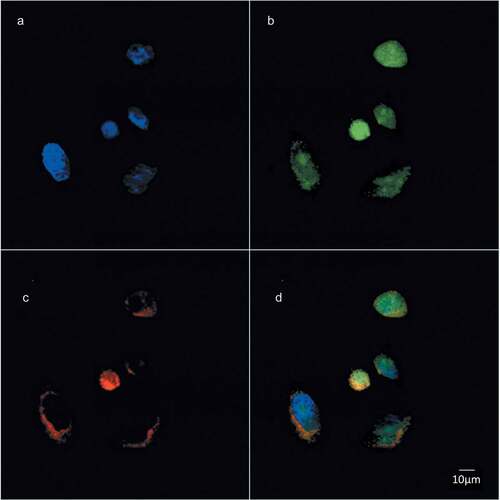
Figure 4. Choline containing lipids synthesized as the cells transverse mitosis colocalize with nuclear membrane marker. HeLa cells, synchronized by nocodazole, were incubated with 2 mM prop-Cho for 2 h. The cells were fixed and processed for immunofluorescence with Alexa 488-azide (a) and Cy3 conjugated anti-Mouse (for lamin A/C) (b) and analyzed by confocal microscopy (Olympus FV1000 microscope). (c) merged; (d) bright field.
Impaired de novo PtdCho synthesis does not affect cell cycle progression
We previously showed that FASN inhibitor C75 arrested the cells at G2/M [Citation19]. FASN knockdown with different siRNAs recapitulated the phenotype (evidenced by increased cyclin B1 levels) (Supplemental Figure 2), supporting our previous results and ruling out a non-specific effect of the small molecule inhibitor. Given that FA are used for phospholipids production, we evaluated whether the de novo PtdCho synthesis (the Kennedy pathway) was necessary to complete the cell cycle. To do this, we knocked down CTα, the rate-limiting enzyme in the pathway, with siRNAs. All four siRNA sequences targeting CTα decreased the enzyme levels significantly ((a) and Supplemental Figure 3.A) compared to the non-targeting (NT) pool. Cyclin B1 was not changed in CTα knockdown cells ((a) and Supplemental Figure 3.B). This was confirmed by a flow cytometry analysis that showed that CTα knockdown did not alter cell cycle distribution ((d)) albeit both the CTα levels ((b)) and its activity -assessed in a parallel sample- ((c)) were decreased. Apoptosis and ploidy were not affected either (not shown). This lack of response was not due to a compensatory increase in CTβ isoform (Supplemental Figure 3.C).
Figure 5. Impaired de novo PtdCho synthesis does not affect cell cycle progression. HeLa cells were transfected with siRNAs targeting CTα or a Non-Targeting pool (NT) at 10 nM for 48 h. The levels of CTα, Cyclin B1 and Vinculin were estimated by Western Blot (a). The level on CTα (b) and cell cycle distribution (d) were assessed in HeLa cells transfected with siRNA targeting CTα (hCTα4) or NT 10 nM for 48 h and incubated for 1 h with 10 μM BrdU. Alternatively, NT and hCTα4-siRNA transfected cells were incubated with [Methyl-3H]choline for 4 h. Aqueous metabolites were resolved by TLC and scrapped off and counted. CTα activity was estimated by the ratio of radiolabeled CDP-Choline/phospho-choline (c). Ct: untransfected cells.
![Figure 5. Impaired de novo PtdCho synthesis does not affect cell cycle progression. HeLa cells were transfected with siRNAs targeting CTα or a Non-Targeting pool (NT) at 10 nM for 48 h. The levels of CTα, Cyclin B1 and Vinculin were estimated by Western Blot (a). The level on CTα (b) and cell cycle distribution (d) were assessed in HeLa cells transfected with siRNA targeting CTα (hCTα4) or NT 10 nM for 48 h and incubated for 1 h with 10 μM BrdU. Alternatively, NT and hCTα4-siRNA transfected cells were incubated with [Methyl-3H]choline for 4 h. Aqueous metabolites were resolved by TLC and scrapped off and counted. CTα activity was estimated by the ratio of radiolabeled CDP-Choline/phospho-choline (c). Ct: untransfected cells.](/cms/asset/c0f2daee-c725-4036-8cb5-447cc8772836/kccy_a_1629792_f0005_oc.jpg)
Simultaneous inhibition of PtdCho synthesis and lysophospholipid acylation induces apoptosis and G2/M arrest
An alternative route for PtdCho synthesis is LysoPtdCho acylation. LysoPtdCho acylation can supply PtdCho for membrane synthesis and cell division [Citation35]. LysoPtdCho content is high at G2/M and decreases as the cells reach G1 [Citation19]. Twenty-four hours incubation with CI-976, an inhibitor of lysophospholipid acyltransferases, decreased cell number in a concentration-dependent manner ((a)), inducing apoptosis at the highest concentration tested (12.5 μM, data not shown). At 2.5 μM CI-976 decreased LysoPtdCho acylation ((b)) but it did not cause G2/M arrest. Rather, an increase in cells at G1 was detected by flow cytometry ((c)) and a concomitant decrease in cyclin B1 ((d)). At this concentration, CI-976 did not induce apoptosis, evidenced by the absence of significant cleaved-Poly ADP-ribose polymerase (PARP) ((d)).
Figure 6. Impaired lysophospholipid acylation does not cause cell cycle arrest at G2/M phase. (a) HeLa cells were incubated with CI-976 (lysophospholipid acyltransferases inhibitor) for 24 h in FBS-depleted media at 0, 0.02, 0.1, 0.5, 2.5 y 12.5 μM. Proliferation was estimated by Crystal Violet staining. (b) HeLa cells were incubated with 2.5 μM CI-976 o vehicle (0.01% DMSO) (without FBS) for 24 h. Two hours before harvesting the cells were incubated with [14C] LysoPtdCho −0.5% FA free BSA for 2 h. Total lipids were resolved by TLC and PtdCho and LysoPtdCho were scrapped off the plate and counted in by liquid scintillation counting. (c) Cell cycle profile and apoptosis (d) were estimated by flow cytometry or cleaved PARP (cPARP) and Cyclin B1 content by Western Blot, respectively after 24 h incubation with 2.5 μM CI-976. * p < 0.05 CI-976 vs control.
![Figure 6. Impaired lysophospholipid acylation does not cause cell cycle arrest at G2/M phase. (a) HeLa cells were incubated with CI-976 (lysophospholipid acyltransferases inhibitor) for 24 h in FBS-depleted media at 0, 0.02, 0.1, 0.5, 2.5 y 12.5 μM. Proliferation was estimated by Crystal Violet staining. (b) HeLa cells were incubated with 2.5 μM CI-976 o vehicle (0.01% DMSO) (without FBS) for 24 h. Two hours before harvesting the cells were incubated with [14C] LysoPtdCho −0.5% FA free BSA for 2 h. Total lipids were resolved by TLC and PtdCho and LysoPtdCho were scrapped off the plate and counted in by liquid scintillation counting. (c) Cell cycle profile and apoptosis (d) were estimated by flow cytometry or cleaved PARP (cPARP) and Cyclin B1 content by Western Blot, respectively after 24 h incubation with 2.5 μM CI-976. * p < 0.05 CI-976 vs control.](/cms/asset/02cac94b-df9a-4026-8dcc-5d5d47280f44/kccy_a_1629792_f0006_b.gif)
The alkyl-lysophospholipid edelfosine inhibits both PtdCho synthesis and LysoPtdCho acylation [Citation36,Citation37]. Treatment of HeLa cells with edelfosine up to 20 μM decreased cell number and viability in a dose-dependent manner ((a) and not shown). At 2.5 μM, cell number was reduced to a greater extent than viability, suggesting arrest of the cell cycle. Indeed, we observed cell cycle arrest at G2/M, as evidenced by cyclin B1 accumulation and flow cytometry analysis ((b,c)). Importantly, impairment in lipid metabolism was observed at concentrations that did not affect cell cycle or viability, as assessed by cyclin B1, D1, cleaved PARP and cleaved caspase 3 levels (Supplemental Figure 4 and results not shown) and flow cytometry ((c)), supporting the idea that the enzyme inhibition is the cause (not the consequence) of the changes in cell proliferation.
Figure 7. Simultaneous inhibition of PtdCho synthesis and lysophospholipid acylation induces apoptosis and G2/M arrest. HeLa cells were incubated with edelfosine at the indicated concentrations for 24 h. Total cell number and viability (a) were estimated in hemocytometer with Trypan Blue. Apoptosis and cell cycle distribution were assessed by Cyclin B1 levels by Western Blot (b) or flow cytometry (c). * p < 0.05 2.5 μM vs control.
Our data imply that it is the synthesis of PtdCho rather than the decrease in the LysoPtdCho content observed as the cells transverse mitosis [Citation19], which is important for cell cycle completion. Taken together, these results suggest that both the LysoPtdCho acylation and the Kennedy pathway can equally contribute to the synthesis of the PtdCho required for cell cycle completion.
Relevance of the mitotic lipogenic checkpoint for the design of combined drug treatment
To test if the “lipogenic checkpoint” at G2/M can be exploited for combined therapy, we treated the cells with the FASN inhibitor, C75, and different agents that act mainly on one phase of the cell cycle. We used staurosporine, 5-fluorouracil and etoposide for G1, S and G2/M arrest, respectively. The response of HeLa cell line to single agents is shown in Supplemental Figure 5 and Supplemental Table 1. HeLa cells were very sensitive to the antimetabolite 5-fluorouracil, but did not show a dose-response correlation over a wide range of concentrations (Supplemental Table 1) curtailing its use for combined treatment. On the contrary, staurosporine did not elicit a strong effect at doses that induce apoptosis in other cell lines but showed a dose-response correlation. The simultaneous treatment with staurosporine and C75 showed an additive or antagonistic effect (Supplemental Table 2). Twenty-four hour treatment with etoposide (80 μM) alone decreased total cell number by ~30–50% ((a)) with only a slight increase in apoptosis (as assessed by cleaved PARP, data not shown). As previously reported for HeLa cells, etoposide induced G2/M arrest, evidenced by increased cyclin B1 ((c)). At low doses, simultaneous treatment with etoposide and C75 showed a moderate synergistic effect (Combination index < 1) ((b) and ). Although the fraction affected was low, the combination produced a decrease in cell number at 10 μg/ml C75, a dose that did not elicit an effect as a single agent. At higher doses, the combined effect was additive or antagonistic. Accordingly, simultaneous silencing of FASN and etoposide treatment showed no synergy on cell cycle arrest (assessed by cyclin B1 accumulation) ((c)). Unexpectedly, etoposide reduced the level of FASN. Etoposide treatment was shown to increase FASN promoter-reporter activity in breast cancer cells [Citation38]. Since FASN is highly regulated at multiple levels, including protein stability [Citation39], further studies will be needed to assess the mechanism(s) by which etoposide regulates FASN and whether it explains the complex response to combined treatment with FASN inhibitors. Thus, although at high doses combined drugs may show an antagonistic effect, our results suggest that the effect of FASN inhibition may be enhanced when combined with low doses of some agents.
Table 1. Combination index for etoposide and C75
Figure 8. Combined effect of etoposide and FASN impairment. Hela cells were treated with etoposide 80 μM for 24 h and the total cell number was estimated (a). The cells were incubated with etoposide and C75 at the concentrations shown in . The fraction affected and combination index were calculated as described under Methods (b). siRNA FASN or NT-transfected cells were incubated with etoposide 80 μM for 24 h and the FASN and cyclin B1 contents were assessed by Western Blot using vinculin as loading control.
Discussion
The requirements and regulation of membrane lipid metabolism during the cell cycle is poorly understood. We have previously reported that extensive changes in lipid metabolism occur as the cells complete the cell cycle [Citation19], but the fate and importance of each lipid is unknown. Here we show that de novo synthesized FA at the mitotic exit are used for phospholipid synthesis and incorporated mainly in the NE, suggesting that they are required for its reassembly and/or expansion. Moreover, we show that, as reported in different models [Citation40,Citation41], endogenous synthesis of PtdCho is also used for nuclear/ER membrane production at the mitotic exit. The importance of lipids for NE dynamics in open mitosis is starting to emerge. Thus, it has been reported that NE breakdown is regulated by specific lipid signals [Citation42–Citation45]. There is also evidence that some proteins that control the cell cycle exit regulate lipid synthesis. For instance, the ER lipid raft-associated 2 (ERLIN2) protein regulates both the mitotic cyclin B1 and lipid synthesis [Citation46–Citation48]. Similarly, the tumour suppressor BRCA1 (breast cancer susceptibility gene 1) controls G2/M checkpoint [Citation49] and de novo FA synthesis [Citation50]. Thus, evidence is building up that suggests that mitosis/cytokinesis are not as metabolically inactive as previously thought.
To study further the importance of the observed changes in lipid metabolism and to identify the lipid(s) necessary for cell cycle completion, we impaired different enzymatic steps in lipogenic routes. As we reported previously, reduced de novo FA synthesis arrested the cells at G2/M [Citation19,Citation51]. Surprisingly, although FA were used for PtdCho generation and newly synthesized PtdCho is increased at the mitotic exit [Citation19], no arrest was observed upon knockdown of CTα. This result is consistent with reports on the mutant cells CHO-MT58, which harbours a temperature sensitive mutation on the CT gene. Even at undetectable CT levels [Citation52] mutant cells are viable and proliferative for several days at the restrictive temperature [Citation53]. Although, under specific genetic backgrounds, CT deficiency induces polyploidy [Citation54], we have not seen changes in the cell cycle distribution in CHO-MT58 (a kind gift of Dr Claudia Kent Dixon) upon 24 h growth at the restrictive temperature (unpublished observations). Moreover, heterozygous mice (CTα+/-), with 50% CTα activity are viable and have no major phenotype [Citation55]. Thus, alternative pathways may provide enough PtdCho to support cell growth and proliferation. One such a route may be LysoPtdCho acylation [Citation35]. Indeed, there is some evidence that LysoPtdCho acylation may contribute to PtdCho synthesis at the mitotic exit [Citation8,Citation19]. Our results showed that the simultaneous inhibition of both PtdCho synthesis and lysophospholipid acylation (but not either alone) arrests cells at G2/M. Importantly, this suggests that it is the supply of PtdCho and not the reduction of a specific precursor that is necessary to complete the cell cycle. Combined, our previous and current studies would indicate that cells are more sensitive to the inhibition of FASN than to alterations in PtdCho metabolism. It is still unknown why exogenous FA are unable to support cell proliferation and survival upon FASN inhibition.
FASN has emerged as a putative therapeutic target for numerous cancers, but the side effects of some inhibitors have curtailed their clinical use and only one small molecule is currently under phase II trial (NCT03179904 clinicaltrials.gov). The combination of inhibitors of the cell cycle with chemotherapeutic agents may improve therapy efficiency [Citation56]. Thus, the G2/M arrest induced by FASN inhibition may enhance the effect of conventional chemotherapy. Conversely, the use of chemotherapy may increase the effect of FASN inhibitors and, thus, reduce their side effects. Indeed, we found a moderate synergistic effect at low doses of C75 and etoposide. At high doses, however, etoposide (and staurosporine) showed an antagonistic effect with C75. This complex response has also been observed when combining etoposide with other inhibitors [Citation57]. It is to be determined whether a different schedule of administration may improve the efficacy of the combined treatment.
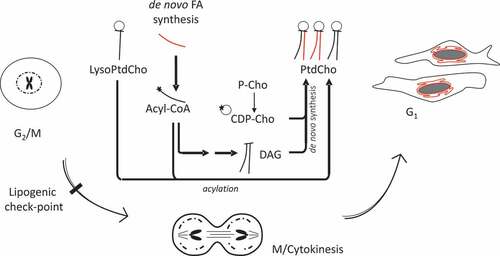
Overall, our results suggest that newly synthesized lipids are used for the reassembly/expansion of the nuclear envelope upon mitosis completion. The cells use either acylation of lysoPtdCho or the Kennedy (diacylglycerol, DAG) pathway to provide PtdCho, but a strong dependency on de novo synthesis of FA generates a cell cycle-related metabolic vulnerability ().
Figure 9. Working model.
Supplemental Material
Download Zip (3.3 MB)Acknowledgments
We are in debt to Dr. Lesley Wassef and Dr Giorgia Zadra for critical review of the manuscript and to Dr Massimo Loda and Dr Giorgia Zadra (Dana-Farber Cancer Institute, Harvard Medical School, USA) for reagents and advice. We are grateful to Verónica V. Moscoso and Leticia Aguirre Gonzalez for laboratory assistance and to María Elina Scaglia for the support with figure preparation.
NS and BC are researchers of the National Scientific and Technical Research Council (CONICET) Argentina. LRS is a fellow from the CONICET. KAG had a “Beca de Iniciación en la Investigación Científica Carlos y Eduardo Brenner” fellowship from the National Academy of Exact, Physical and Natural Sciences of Argentina (ANCEFN) and she is currently a fellow from the CONICET.
Disclosure statement
No potential conflict of interest was reported by the authors.
Supplementary material
Supplemental data for this article can be accessed here.
Correction Statement
This article has been republished with minor changes. These changes do not impact the academic content of the article.
Additional information
Funding
Related Research Data
References
- Tennant DA, Duran RV, Gottlieb E. Targeting metabolic transformation for cancer therapy. Nat Rev Cancer. 2010;10(4):267–277.
- Baenke F, Peck B, Miess H, et al. Hooked on fat: the role of lipid synthesis in cancer metabolism and tumour development. Dis Model Mech. 2013;6(6):1353–1363.
- Currie E, Schulze A, Zechner R, et al. Cellular fatty acid metabolism and cancer. Cell Metab. 2013;18(2):153–161.
- Pavlova NN, Thompson CB. The emerging hallmarks of cancer metabolism. Cell Metab. 2016;23(1):27–47.
- Bergeron JJ, Warmsley AM, Pasternak CA. Phospholipid synthesis and degradation during the life-cycle of P815Y mast cells synchronized with excess of thymidine. Biochem J. 1970;119(3):489–492.
- Warmsley AM, Pasternak CA. The use of conventional and zonal centrifugation to study the life cycle of mammalian cells. Phospholipid and macromolecular synthesis in neoplastic mast cells. Biochem J. 1970;119(3):493–499.
- Graham JM, Sumner MC, Curtis DH, et al. Sequence of events in plasma membrane assembly during the cell cycle. Nature. 1973;246(5431):291–295.
- Manguikian AD, Barbour SE. Cell cycle dependence of group VIA calcium-independent phospholipase A2 activity. J Biol Chem. 2004;279(51):52881–52892.
- Bosmann HB, Winston RA. Synthesis of glycoprotein, glycolipid, protein, and lipid in synchronized L5178Y cells. J Cell Biol. 1970;45(1):23–33.
- Kobayashi T, Pagano RE. Lipid transport during mitosis. Alternative pathways for delivery of newly synthesized lipids to the cell surface. J Biol Chem. 1989;264(10):5966–5973.
- Lin W, Arthur G. Phospholipids are synthesized in the G2/M phase of the cell cycle. Int J Biochem Cell Biol. 2007;39(3):597–605.
- Knutton S, Sumner MC, Pasternak CA. Role of microvilli in surface changes of synchronized P815Y mastocytoma cells. J Cell Biol. 1975;66(3):568–576.
- Frejtag W, Burnette J, Kang B, et al. An increase in surface area is not required for cell division in early sea urchin development. Dev Biol. 2003;259(1):62–70.
- Boucrot E, Kirchhausen T. Endosomal recycling controls plasma membrane area during mitosis. Proc Natl Acad Sci U S A. 2007;104(19):7939–7944.
- Emoto K, Inadome H, Kanaho Y, et al. Local change in phospholipid composition at the cleavage furrow is essential for completion of cytokinesis. J Biol Chem. 2005;280(45):37901–37907.
- Emoto K, Kobayashi T, Yamaji A, et al. Redistribution of phosphatidylethanolamine at the cleavage furrow of dividing cells during cytokinesis. Proc Natl Acad Sci U S A. 1996;93(23):12867–12872.
- Anderson DJ, Hetzer MW. Nuclear envelope formation by chromatin-mediated reorganization of the endoplasmic reticulum. Nat Cell Biol. 2007;9(10):1160–1166.
- Storck EM, Ozbalci C, Eggert US. Lipid cell biology: a focus on lipids in cell division. Annu Rev Biochem. 2018;87:839–869.
- Scaglia N, Tyekucheva S, Zadra G, et al. De novo fatty acid synthesis at the mitotic exit is required to complete cellular division. Cell Cycle. 2014;13(5):859–868.
- Whitfield ML, Zheng LX, Baldwin A, et al. Stem-loop binding protein, the protein that binds the 3ʹ end of histone mRNA, is cell cycle regulated by both translational and posttranslational mechanisms. Mol Cell Biol. 2000;20(12):4188–4198.
- Scaglia N, Chisholm JW, Igal RA. Inhibition of stearoylCoA desaturase-1 inactivates acetyl-CoA carboxylase and impairs proliferation in cancer cells: role of AMPK. PLoS One. 2009;4(8):e6812.
- Bligh EG, Dyer WJ. A rapid method of total lipid extraction and purification. Can J Biochem Physiol. 1959;37(8):911–917.
- Scaglia N, Igal RA. Stearoyl-CoA desaturase is involved in the control of proliferation, anchorage-independent growth, and survival in human transformed cells. J Biol Chem. 2005;280(27):25339–25349.
- Bagnato C, Igal RA. Overexpression of diacylglycerol acyltransferase-1 reduces phospholipid synthesis, proliferation, and invasiveness in simian virus 40-transformed human lung fibroblasts. J Biol Chem. 2003;278(52):52203–52211.
- Jao CY, Roth M, Welti R, et al. Metabolic labeling and direct imaging of choline phospholipids in vivo. Proc Natl Acad Sci U S A. 2009;106(36):15332–15337.
- Andreyev AY, Fahy E, Guan Z, et al. Subcellular organelle lipidomics in TLR-4-activated macrophages. J Lipid Res. 2010;51(9):2785–2797.
- Chang J, Ruiz V, Vancura A. Purification of yeast membranes and organelles by sucrose density gradient centrifugation. Methods Mol Biol. 2008;457:141–149.
- Favale NO, Pescio LG, Santacreu BJ, et al. Participation of prostaglandin D2 in the mobilization of the nuclear-localized CTP: phosphocholinecytidylyltransferase alpha in renal epithelial cells. Biochim Biophys Acta. 2016;1861(6):513–523.
- Bolte S, Cordelieres FP. A guided tour into subcellular colocalization analysis in light microscopy. J Microsc. 2006;224(Pt 3):213–232.
- Costes SV, Daelemans D, Cho EH, et al. Automatic and quantitative measurement of protein-protein colocalization in live cells. Biophys J. 2004;86(6):3993–4003.
- Drecktrah D, Chambers K, Racoosin EL, et al. Inhibition of a Golgi complex lysophospholipid acyltransferase induces membrane tubule formation and retrograde trafficking. Mol Biol Cell. 2003;14(8):3459–3469.
- Topaly J, Zeller WJ, Fruehauf S. Synergistic activity of the new ABL-specific tyrosine kinase inhibitor STI571 and chemotherapeutic drugs on BCR-ABL-positive chronic myelogenous leukemia cells. Leukemia. 2001;15(3):342–347.
- Ichite N, Chougule MB, Jackson T, et al. Enhancement of docetaxel anticancer activity by a novel diindolylmethane compound in human non-small cell lung cancer. Clin Cancer Res. 2009;15(2):543–552.
- Posakony JW, England JM, Attardi G. Mitochondrial growth and division during the cell cycle in HeLa cells. J Cell Biol. 1977;74(2):468–491.
- Esko JD, Nishijima M, Raetz CR. Animal cells dependent on exogenous phosphatidylcholine for membrane biogenesis. Proc Natl Acad Sci U S A. 1982;79(6):1698–1702.
- Modolell M, Andreesen R, Pahlke W, et al. Disturbance of phospholipid metabolism during the selective destruction of tumor cells induced by alkyl-lysophospholipids. Cancer Res. 1979;39(11):4681–4686.
- Vogler WR, Whigham E, Bennett WD, et al. Effect of alkyl-lysophospholipids on phosphatidylcholine biosynthesis in leukemic cell lines. Exp Hematol. 1985;13(7):629–633. (Abstract).
- Menendez JA, Vellon L, Lupu R. DNA topoisomerase IIalpha (TOP2A) inhibitors up-regulate fatty acid synthase gene expression in SK-Br3 breast cancer cells: in vitro evidence for a ‘functional amplicon’ involving FAS, Her-2/neu and TOP2A genes. Int J Mol Med. 2006;18(6):1081–1087.
- Graner E, Tang D, Rossi S, et al. The isopeptidase USP2a regulates the stability of fatty acid synthase in prostate cancer. Cancer Cell. 2004;5(3):253–261.
- Santos-Rosa H, Leung J, Grimsey N, et al. The yeast lipin Smp2 couples phospholipid biosynthesis to nuclear membrane growth. Embo J. 2005;24(11):1931–1941.
- Henry SM, Hodge LD. Evidence for a unique profile of phosphatidylcholine synthesis in late mitotic cells. J Cell Biol. 1983;97(1):166–172.
- Goss VL, Hocevar BA, Thompson LJ, et al. Identification of nuclear beta II protein kinase C as a mitotic lamin kinase. J Biol Chem. 1994;269(29):19074–19080.
- Deacon EM, Pettitt TR, Webb P, et al. Generation of diacylglycerol molecular species through the cell cycle: a role for 1-stearoyl, 2-arachidonyl glycerol in the activation of nuclear protein kinase C-betaII at G2/M. J Cell Sci. 2002;115(Pt 5):983–989.
- Gorjanacz M, Mattaj IW. Lipin is required for efficient breakdown of the nuclear envelope in Caenorhabditis elegans. J Cell Sci. 2009;122(Pt 12):1963–1969.
- Golden A, Liu J, Cohen-Fix O. Inactivation of the C. elegans lipin homolog leads to ER disorganization and to defects in the breakdown and reassembly of the nuclear envelope. J Cell Sci. 2009;122(Pt 12):1970–1978.
- Zhang X, Cai J, Zheng Z, et al. A novel ER-microtubule-binding protein, ERLIN2, stabilizes Cyclin B1 and regulates cell cycle progression. Cell Discov. 2015;1:15024.
- Huber MD, Vesely PW, Datta K, et al. Erlins restrict SREBP activation in the ER and regulate cellular cholesterol homeostasis. J Cell Biol. 2013;203(3):427–436.
- Wang G, Zhang X, Lee J-S, et al. Endoplasmic reticulum factor ERLIN2 regulates cytosolic lipid content in cancer cells. Biochem J. 2012;446(3):415–425.
- Shabbeer S, Omer D, Berneman D, et al. BRCA1 targets G2/M cell cycle proteins for ubiquitination and proteasomal degradation. Oncogene. 2013;32(42):5005–5016.
- Moreau K, Dizin E, Ray H, et al. BRCA1 affects lipid synthesis through its interaction with acetyl-CoA carboxylase. J Biol Chem. 2006;281(6):3172–3181.
- Zadra G, Photopoulos C, Tyekucheva S, et al. A novel direct activator of AMPK inhibits prostate cancer growth by blocking lipogenesis. EMBO Mol Med. 2014;6(4):519–538.
- Wang Y, Sweitzer TD, Weinhold PA, et al. Nuclear localization of soluble CTP: phosphocholinecytidylyltransferase. J Biol Chem. 1993;268(8):5899–5904.
- Sweitzer TD, Kent C. Expression of wild-type and mutant rat liver CTP: phosphocholine cytidylyltransferase in a cytidylyltransferase-deficient Chinese hamster ovary cell line. Arch Biochem Biophys. 1994;311(1):107–116.
- Shen Y-J, DeLong CJ, Tercé F, et al. Polyploid formation via chromosome duplication induced by CTP: phosphocholinecytidylyltransferase deficiency and Bcl-2 overexpression: identification of two novel endogenous factors. J Histochem Cytochem. 2005;53(6):725–733.
- Wang L, Magdaleno S, Tabas I, et al. Early embryonic lethality in mice with targeted deletion of the CTP: phosphocholinecytidylyltransferase alpha gene (Pcyt1a). Mol Cell Biol. 2005;25(8):3357–3363.
- Mills CC, Kolb EA, Sampson VB. Development of Chemotherapy with Cell-Cycle Inhibitors for Adult and Pediatric Cancer Therapy. Cancer Res. 2018;78(2):320–325.
- Gálvez-Peralta M, Flatten KS, Loegering DA, et al. Context-dependent antagonism between Akt inhibitors and topoisomerase poisons. Mol Pharmacol. 2014;85(5):723–734.