
ABSTRACT
Background: Nowadays, microRNAs (miRNAs) attract much attention in regulating anticancer drug resistance in cancers including multiple myeloma (MM). Bortezomib is the first-line choice in MM treatment, and bortezomib resistance caused by aberrant DNA repair leads to the recurrence and therapeutic failure of MM.
Objective: Our study aims to identify a miRNA that overcomes bortezomib resistance in MM.
Methods: We established bortezomib-resistant MM cell lines, and screened several miRNAs that have aberrant expressions in MM cell lines. The expression of DNA-repair-related proteins were assessed by western blot, and cell viability was determined by the MTT assay in bortezomib-resistant cell lines. The binding between miRNAs and 3ʹ-UTR of APE1 mRNA was confirmed by luciferase reporter assay. The mouse bortezomib-resistant xenograft was established to verify the therapeutic effect of miRNA overexpression.
Results: miR-520g and miR-520h were significantly downregulated in bortezomib-resistant MM cell lines, and overexpression of miR-520g and miR-520h together inhibited expression of homologous recombination-related protein Rad51 and cell viability of bortezomib-resistant MM cells in vitro by binding with 3ʹ-UTR of APE1 mRNA. Combined overexpression of miR-520g and miR-520h inhibited bortezomib-resistant MM tumor growth in vivo.
Conclusion: Our findings demonstrated that combined overexpression of miR-520g and miR-520h overcomes bortezomib resistance in MM through inhibition of DNA repair, offering a promising therapeutic target for MM treatment.
Introduction
Multiple myeloma (MM) is a malignant neoplasm of plasma cells that accumulate in bone marrow, leading to bone destruction and marrow failure. It is the second most common hematological malignancy after non-Hodgkin lymphoma [Citation1]. The annual incidence of MM is about 4–6 per 100,000 population in the United States and Europe, and about 1–2.5 per 100,000 population in China [Citation2]. In the last 20 years, the outcome of MM patients has been improved due to new therapeutic protocols. Now the combination of bortezomib, lenalidomide, and dexamethasone is the standard first-line treatment of stem cell transplant candidates and non-transplant candidates, making the median survival time reach 5–7 years [Citation3]. Nevertheless, most patients eventually develop disease recurrence, and the bortezomib resistance becomes the primary cause of recurrence and incurability of myeloma. One goal of our current study is to identify the potential mechanism of bortezomib resistance, and to distinguish a novel therapeutic target that can reduce bortezomib resistance in MM.
Thousands of DNA lesions occur in cells every day, especially in patients treated with chemotherapeutic agents. To counteract these challenges, DNA repair pathways are involved in protecting MM cells from the genotoxic effect of various kinds of drugs [Citation4]. Homologous recombination (HR) is one of the major DNA pathways in drug resistance of MM, and plays a critical role in bortezomib-related resistance [Citation5]. Bortezomib is a proteasome inhibitor and causes genotoxic effect and apoptosis of MM cells [Citation6]. It was reported that bortezomib-treated MM cells significantly reduced the protein expression level of Rad51, an HR-related protein, suggesting the anti-DNA repair function of bortezomib [Citation7]. Human apurinic/apyrimidinic endonuclease 1 (APE1) is an important DNA repair-related protein, and significantly contributes to dysregulation of HR, directly through transcriptional control of Rad51 as well as indirectly through its ability to induce DNA breaks [Citation8]. The evidence demonstrated that a small interfering RNA to APE1 sensitized cancer cells to bortezomib [Citation9]. However, the upstream regulatory mechanisms of APE1 are largely unknown.
MicroRNAs (miRNAs), a class of non-coding RNAs, are now attracting attention as the important gene regulatory factors in the study of pathobiology of many cancers including MM [Citation10]. They play important roles in post-transcriptional regulation of multiple human genes, including oncogenes and tumor suppressors. By binding to seed sequences (2–7nt) of 3ʹ-untranslated regions (UTR) in target mRNAs, miRNAs lead to translational repression or mRNA degradation [Citation11]. In recent years, miRNAs have been reported to play an important role in mediating anticancer drug resistance [Citation12]. For example, expressions of miR-27a and miR-451 cause overexpression of P-glycoprotein, a protein encoded by the multidrug resistance 1 (MDR1) gene, in the multidrug-resistant cell lines [Citation13]. In the ongoing study, we chose several miRNAs that have aberrant expressions in MM cells being reported in previous studies, including miR-378*, miR-520g, miR-520h, miR-1, miR-34c, and miR-361, aiming to identify a potential target to reverse bortezomib resistance in MM.
In this study, we demonstrated that miR-520g and miR-520h were significantly downregulated in bortezomib-resistant MM cell lines, and overexpression of miR-520g and miR-520h together inhibited cell viability of bortezomib-resistant MM cells in vitro by binding with 3ʹ-UTR of APE1 mRNA. Furthermore, we discovered that overexpression of miR-520g and miR-520h together inhibited bortezomib-resistant MM tumor growth in vivo.
Materials and methods
Generation of bortezomib-resistant MM cells and cell viability assay
Human MM cell lines RPMI-8266 and H929 were purchased from the Cell Bank of Chinese Academy of Sciences, and were cultured in RPMI 1640 medium (Gibco, Waltham, MA, USA) supplemented with 10% fetal bovine serum (FBS; Gibco), 1% (v/v) penicillin, and 100 μg/mL streptomycin at a 37℃ incubator with 5% CO2 and 95% air.
To generate bortezomib-resistant MM cell lines, RPMI-8266 and H929 cells were gradually exposed to the increased dose of bortezomib (from an initial dose of 4 nM to a final dose of 48 nM within 12 months with a gradient of 4 nM/month). Surviving cells were separated from dead cells by Ficoll-Paque density centrifugation. Then the cells were maintained in 48 nM bortezomib for 3 months and cultured in a bortezomib-free medium for 2 weeks before the experiments. Cell viability was determined by a modification of the MTT-reduction method [Citation14].
Western blot
Proteins were isolated from MM cells and tumor tissues using RIPA lysis and extraction buffer (Thermo Scientific, Waltham, MA, USA). The protein concentration was detected by BCA protein assay kit (Thermo Scientific). Equal amount of protein was loaded at 12% SDS-PAGE and blotted onto polyvinylidene fluoride (PVDF) membrane (Invitrogen, Waltham, MA, USA). After blocking, blots were incubated with primary antibodies against MDR1 (ab170904, 1:1000; Abcam, Cambridge, MA, USA), APE1 (ab189474, 1:1000; Abcam), Rad51 (ab133534, 1:10,000; Abcam), β-actin (1:3000; Cell Signaling Technology, Danvers, MA, USA). Anti-rabbit IgG and anti-mouse IgG (1:2000; Cell Signaling Technology) were used as secondary antibodies. Blots were visualized using Novex ECL Chemiluminescent Substrate Reagent Kit (Invitrogen).
Quantitative real-time polymerase chain reaction (qRT-PCR)
Total RNAs were extracted from MM cells and tumor tissues using TRIzol Reagent (Invitrogen), and the cDNA was synthesized using High Capacity cDNA Reverse Transcription Kit (Applied Biosystems, Waltham, MA, USA) according to the manufacturer’s instructions. The miRNA expressions were measured by using mirVana qRT-PCR miRNA Detection Kit (Invitrogen), and U6 was used as the internal control for miR-378*, miR-520g, miR-520h, miR-1, miR-34c and miR-361.
Cell transfection
miR-520g mimic and inhibitor, miR-520h mimic and inhibitor, and their corresponding control oligonucleotides [pre-negative control (NC) and NC], as well as the APE1 overexpressing plasmid (pcDNA-APE1), small interfering RNA against APE1 (siRNA-APE1), and si-control were synthesized by RiboBio (Guangzhou, China). MM cells were transiently transfected with the oligonucleotides, plasmids or small interfering RNA by using transfection reagent Lipofectamine 2000 (Invitrogen).
Dual luciferase reporter assay
The mutant (Mut) or wild type (WT) predicted 3ʹ-UTR binding sequences of APE1 mRNA was cloned into psiCHECK-2 vector (Promega, Madison, WI, USA). 293T cells were transfected with the vector carrying APE1 3ʹUTR-WT or APE1 3ʹUTR-Mut, miR-520g and/or miR-520h mimic or negative control (pre-NC) using Lipofectamine 2000 (Invitrogen). After 48-hour incubation, cells were collected to detect luciferase activity using Dual Luciferase Assay System (Promega) in a TD-20/20 Luminometer (Turner BioSystems, Madison, WI, USA).
Xenograft model
Lentivirus miR-520g (lenti-miR-520g), lentivirus miR-520h (lenti-miR-520h), and lentivirus negative control (lenti-NC) were purchased from Genechem (Shanghai, China). Lenti-NC-transfected or lenti-miR-520g/h-co-transfected bortezomib-resistant RPMI-8226R5 MM cells were mixed with matrigel and injected subcutaneously into the flank of NOD/SCID mice (5 × 10⁶ cells/mouse). There were 6 mice in each group. When tumors became palpable (200–300mm3), mice were treated with intratumorally injected with 0.5 mg/kg of bortezomib in one day intervals. Tumor growth was measured every 3 days. Mice were sacrificed at 42 days, and tumors were collected for the detection of miR-520g/h, APE1, Rad51 and MDR1.
Statistical analysis
Statistical significance levels were determined by two-tailed t test or one-way analysis of variance (ANOVA). The p values of <0.05 were considered significant. Data were presented as mean ± standard deviation (SD), and were analyzed using SPSS software (version 20.0; Chicago, IL, USA).
Results
Establishment of bortezomib-resistant cell lines 8266-BR and H929-BR
Gradually increased the concentration of bortezomib was used to deal with the two normal MM cell lines RPMI-8266 and H929 cells and their corresponding drug-resistant cell lines 8266-BR and H929-BR. The cell viability of RPMI-8266 and H929 cells was decreased by 82% in 20 nM bortezomib processing, and the increase of the concentration of bortezomib will maintain this activity level (RPMI-8266 cells) or small amplitude decreases (H929 cells). And cell viability of drug-resistant 8266-BR and H929-BR cells was gradually declined to respond to bortezomib, and in each concentration processing, the cell activity was significantly higher than that of normal cells ()). The expression of MDR1 protein, a drug-resistant related protein, in drug-resistant 8266-BR and H929-BR cells, was upregulated ()).
Figure 1. Establishment of drug resistance MM cell lines. Drug-resistant cell lines (8266-BR and H929-BR) were established with two MM cell lines RPMI-8266 and H929 by the treatment of bortezomib with low doses to high doses. (a) Compared cell viability of normal cells and drug resistance cells in response to doses of bortezomib by using MTT assay. (b) Determination of MDR1 expression in normal cells and drug resistance cells by using western blot. **p < 0.01 compared with RPMI-8266 or H929.
miR-520g and miR-520h were downregulated in drug-resistant MM cell lines
To determine the potential involved miRNAs in drug resistance of MM cells, the relative expression levels of a series of MM-related miRNAs, reported in previous studies, were compared between normal cells and drug resistance cells. As shown in ), the relative level of miR-520g and miR-520h were significantly reduced in both drug-resistant MM cell lines, suggesting the involvement of miR-520g and miR-520h in drug resistance of MM. We also detected the expression of APE1 and Rad51, two key factors in base-excision repair of DNA, and the results showed that both APE1 and Rad51 were upregulated in both drug-resistant MM cell lines ()).
Figure 2. Profile of miRNAs in drug-resistant MM cell lines. (a) A series of MM-related miRNAs was detected in normal cells and drug resistance cells by using qRT-PCR. (b) Determination of APE1 and Rad51 expression in normal cells and drug-resistant cells. **p < 0.01 compared with RPMI-8266 or H929.
Co-effect of miR-520g and miR-520h on Rad51 expression and cell viability
To investigate the co-effect of miR-520g and miR-520h on Rad51 expression, miR-520g/h inhibitors were induced in the two normal MM cell lines to knock down miR-520g/h, while miR-520g/h mimics were induced in the two bortezomib-resistant cell lines to overexpress miR-520g/h, then the protein expression level of Rad51 was detected. As shown in ), in the normal MM cell lines RPMI-8266 and H929 cells, qRT-PCR confirmed the downregulation of miR-520g/h after the knockdown of miR-520g/h. The protein expression level of Rad51 was upregulated by miR-520g/h knockdown, and appeared more significant upregulation by the knockdown of both miR-520g and miR-520h ()). After the overexpression of miR-520g/h in the bortezomib-resistant cell lines 8266-BR and H929-BR cells, the expression level of miR-520g/h was upregulated ()). The protein expression level of Rad51 was downregulated by miR-520g/h overexpression, and appeared more significant downregulation by the overexpression of both miR-520g and miR-520h ()).
Figure 3. Co-effect of miR-520g and miR-520h on Rad51 expression. Normal RPMI-8266 or H929 cells were transfected with miR-520g/h inhibitor to knock down miR-520g/h. After 24h transfection, cells were collected for the analysis of (a) miR-520g/h expression level and (b) Rad51 protein expression level. Drug-resistant 8266-BR and H929-BR cells were transfected with miR-520g/h to overexpress miR-520g/h. After 24h transfection, cells were collected for the analysis of (c) miR-520g/h expression level and (d) Rad51 protein expression level.
We also investigate the cell viability affected by the miR-520g/h knockdown or overexpression. After the miR-520g/h knockdown or overexpression respectively by inhibitors or mimics, normal and drug-resistant MM cells were treated with bortezomib with increased concentrations for 24 h, and cell viability was assessed by the MTT assay. In the normal MM cell lines RPMI-8266 and H929 cells, cell viability was reduced less slowly by miR-520g/h knockdown than the control (p < 0.05), which was more apparent after the knockdown of both miR-520g and miR-520h (p < 0.01) ()). In the drug-resistant MM cell lines 8266-BR and H929-BR cells, cell viability was reduced faster by miR-520g/h overexpression than the control (p < 0.05), which was more apparent after the overexpression of both miR-520g and miR-520h (p < 0.01) ()).
Figure 4. Co-effect of miR-520g/h on cell viability of (a) normal RPMI-8266 or H929 cells, and (b) drug-resistant 8266-BR and H929-BR cells in response to doses of bortezomib through MTT assay. *p < 0.05, **p < 0.01 compared with NC or pre-NC.
miR-520g and miR-520h target APE1
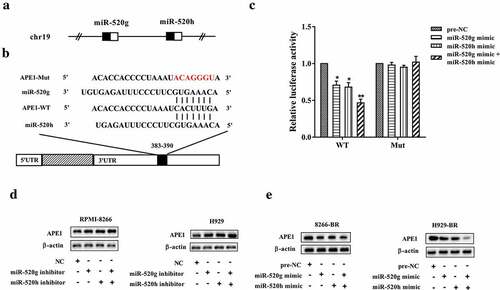
Both miR-520g and miR-520h were located on the human chromosome 19 (Figure 5(a)). By using an online database of binding site prediction (http://www.targetscan.org), there might be binding sites between 3ʹ-UTR of APE1 mRNA and miR-520g/h ()). To confirm the binding of APE1 mRNA and miR-520g/h, the luciferase reporter assay was performed. As shown in ), the relative luciferase activity was markedly reduced in the wild type (WT) 3ʹ-UTR group after miR-520g/h overexpression (p < 0.05), and was affected more significantly by overexpressing miR-520g and miR-520h together (p < 0.01), whereas the relative luciferase activity was not dramatically changed in the mutant (Mut) 3ʹ-UTR group. The protein expression level of APE1 was upregulated by miR-520g/h knockdown, but was downregulated by miR-520g/h overexpression. In addition, knocking down or overexpressing miR-520g and miR-520h together appeared more apparently in affecting APE1 protein expression level than knocking down or overexpressing miR-520g or miR-520h alone (,e)).
Figure 5. miR-520g and miR-520h target APE1. (a) Both miR-520g and miR-520h locate on chr19. (b) The paired binding site between miR-520g/h and APE1 mRNA 3ʹ-UTR. (c) Luciferase recombinant vector expressing target sequences of binding were co-transfected with miR-520g or miR-520h or both of miR-520g and miR-520h. Luciferase of cells was analyzed. Determination of APE1 protein level (d) in normal RPMI-8266 or H929 cells with miR-520g/h knockdown and in (e) drug-resistant 8266-BR and H929-BR cells with miR-520g/h overexpression. *p < 0.05, **p < 0.01 compared with pre-NC.
Effect of miR-520g/h-ape1 in drug resistance of MM cells
To elucidate the effect of miR-520g/h-APE1 in drug resistance of MM cells, rescue experiments were performed in normal and drug-resistant MM cell lines. The result indicated that downregulating APE1 by transfection with siRNA-APE1 in normal MM cell lines RPMI-8266 and H929 cells reduced the protein expression levels of Rad51 and MDR1 raised by miR-520g/h inhibition () and )). Upregulating APE1 by transfection with pcDNA-APE1 in drug-resistant MM cell lines 8266-BR and H929-BR cells restored the defect of protein expression levels of Rad51 and MDR1 caused by miR-520g/h overexpression () and )). Meanwhile, downregulating APE1 in RPMI-8266 and H929 cells reduced the cell viability raised by miR-520g/h inhibition, and upregulating APE1 in 8266-BR and H929-BR cells restored the defect of cell viability caused by miR-520g/h overexpression (,d)).
Figure 6. Determination of Rad51 protein level (a) in normal RPMI-8266 or H929 cells after co-knockdown of miR-520g/h and APE1 and (b) in drug-resistant 8266-BR and H929-BR cells after co-overexpression of miR-520g/h and APE1.
Figure 7. Effect of miR-520g/h-APE1 pathway in drug resistance of MM cells. Normal RPMI-8266 or H929 cells were transfected with both miR-520g/h inhibitor and siRNA-APE1 (shRNA interference for APE1) followed by treatment of bortezomib. After 24h, cells were collected for the analysis of (a) MDR1 protein expression level and (b) cell viability. Drug-resistant 8266-BR and H929-BR cells were transfected with both miR-520g/h and pcDNA-APE1 (recombinant pcDNA vector overexpressing APE1) followed by treatment of bortezomib. After 24h, cells were collected for the analysis of (c) MDR1 protein expression level and (d) cell viability. **p < 0.01 compared with NC or pre-NC. ##p < 0.01 compared with miR-520g/h inhibitor+si-control or miR-520g/h mimic+pcDNA.
Effect of miR-520g/h overexpression on drug resistance of 8226-R5 xenograft tumor in SCID mice
Bortezomib-resistant xenograft model was established by subcutaneous injection of bortezomib-resistant RPMI-8226R5 MM cells in SCID mice. Before the injection, bortezomib-resistant RPMI-8226R5 MM cells were transfected with lenti-NC (the control group) or lentiviral vectors overexpressing miR-520g/h (the lenti-miR-520g+ lenti-miR-520h group). Xenograft tumor was injected with 0.5mg/kg bortezomib after tumor growing into 200–300 mm3. During the 42 days, the tumor volume in the lenti-miR-520g+ lenti-miR-520h group was increased more slowly than the control group ()). After 42 days, the expression of miR-520g/h was enhanced, while the protein expression levels of APE1, Rad51, and MDR1 were reduced in tumor tissues of the lenti-miR-520g+ lenti-miR-520h group ()).
Figure 8. Effect of miR-520g/h overexpression on drug resistance of 8226-R5 xenograft tumor in SCID mice. Drug-resistant 8226-R5 cells that had been transfected with lentiviral vectors overexpressing miR-520g/h were subcutaneous transplanted into SCID mice. Xenograft tumor was injected with 0.5mg/kg bortezomib after tumor growing into 200-300 mm3. (a) Tumor volume was measured during 42 days. (b) The relative expression levels of miR-520g and miR-520h, and protein expression levels of APE1, Rad51, and MDR1 were determined in tumor tissues after 42 days. **p < 0.01 compared with lenti-NC.
Discussion
Accumulating studies have indicated reliable evidence supporting the role of miRNAs in MM pathogenesis, prognosis, and clinical outcome. For instance, let-7e, miR-125a-5p, and miR-99b were highly upregulated in MM patients with immunoglobulin heavy chain translocation [Citation15]; miR-34a, miR-202, and miR-125b were dramatically downregulated in MM and act as principal tumor suppressors [Citation16–Citation18]. However, whether the expression pattern of miRNAs is altered in MM patients under anticancer drug treatment hence the possible involvement in drug resistance has remained unknown. Neri et al. has presented their study at a meeting in 2009, that revealed the role of miRNAs in bortezomib resistance in MM [Citation19]. They found a series of miRNAs which were aberrantly expressed in MM cells isolated from bortezomib-resistant MM patients. Although further functional or mechanistic explorations were not performed by Neri et al., they offered us a theoretic basis for the current study. In our work, we screened 6 miRNAs that have been reported to be aberrantly expressed in MM patients, including upregulated miRNAs (miR-1, miR-34c, and miR-361) and downregulated miRNAs (miR-378*, miR-520g, and miR-520h) [Citation20]. By detecting the expression of these miRNAs in two normal MM cell lines and corresponding bortezomib-resistant cell lines, we chose miR-520g and miR-520h as the candidate miRNAs for further experiments due to their markedly downregulation in bortezomib-resistant MM cell lines.
Both miR-520g and miR-520h are located on the chromosome 19, and belong to the miR-515 family [Citation21]. Former studies have identified their correlations with drug resistance. Ectopic expression of miR-520g conferred resistance to 5-fluorouracil- or oxaliplatin-induced apoptosis of colorectal cancer cells [Citation22]; high miR-520g expression promoted chemoresistance to platinum-based chemotherapy in ovarian cancer [Citation23]. Overexpression of miR-520h restored doxorubicin-induced DNA damage to overcome drug resistance in gastric cancer [Citation24]; Transfection of miR-520h mimic and inhibitor in human embryonic stem cells confirmed its direct involvement in the regulation ABCG2 translation, a ubiquitous ATP-binding cassette transporter associated with multidrug resistance [Citation25]. Given the downregulation of both miR-520g and miR-520h in bortezomib-resistant MM cell lines in our study, we further investigated the correlation between miR-520g/h and bortezomib resistance in MM. Notably, miRNAs exert their function of translational repression or mRNA degradation by binding to seed sequences of 3ʹ-UTR in target mRNAs. By using online database (http://www.targetscan.org), we found there might be binding sites between miR-520g/h and 3ʹ-UTR of APE1 mRNA, and confirmed the targeted binding via luciferase reporter assay.
DNA repair pathways are critical to resolve the plethora of DNA lesions that occur each day in cells due to endogenous and exogenous stress. In that respect are several DNA repair pathways involved in MM recurrence and drug resistance, such as HR and base excision repair (BER). As a BER protein, the activity of APE1 largely determines the effectiveness of the DNA repair in the BER pathway [Citation26]. The injured DNA segments induced by chemo regent are removed by particular glycosylases, leaving an abasic site with the N-glycosyl bond intact. Then APE1 cleaves the DNA backbone at the abasic site, allowing the compliment of correct nucleotides. As reported, overexpression of APE1 in tumor tissues is closely correlated with a less effective response or resistance to cancer therapeutic agents [Citation27,Citation28]. Meanwhile, APE1 regulates the HR pathway via mediating the expression of Rad51, the key component of HR in MM. APE1 physically interacts with p73, a known transcriptional regulator of Rad51. It has been described that both P73 and APE1 binding to adjacent loci on Rad51 promoter, thus increasing the expression of Rad51 in MM cells [Citation8]. In our work, the protein expression level of APE1 was markedly increased in bortezomib-resistant MM cell lines, confirming the pro-resistant effect of APE1, which is consistent with the study of Xie et al [Citation29]. Meanwhile, we demonstrated that the HR-related protein Rad51 and drug-resistant protein MDR1 were subsequently changed by miR-520g/h-APE1 axis. Interestingly, the combined overexpression of miR-520g and miR-520h increased the anti-resistant effect in vitro, and the underlying mechanisms will deserve further investigations in the future.
In conclusion, our findings provided robust evidence that miR-520g and miR-520h overcome bortezomib resistance in MM by regulating APE1 expression. Moreover, combined overexpression of miR-520g and miR-520h inhibited bortezomib-resistant MM tumor growth in the mouse model, providing a novel target of treating bortezomib-resistant MM.
Availability of data and material
The datasets used and/or analyzed during the current study are available from the corresponding author on reasonable request.
Ethics approval and consent to participate
This study was proved by the medical ethic committee of People’s Hospital of Zhengzhou University. All animals-treatment operations were executed according to the Zhengzhou University Ethical Guidelines for Animal Experiment.
Disclosure statement
No potential conflict of interest was reported by the authors.
Additional information
Funding
References
- Kumar SK, Rajkumar V, Kyle RA, et al. Multiple myeloma. Nat Rev Dis Primers. 2017;3:17046.
- Siegel RL, Miller KD, Jemal A. Cancer statistics. CA Cancer J Clin. 2017;67(1):7–30.
- Shaji KK, Natalie SC, Melissa A, et al. NCCN guidelines insights: multiple myeloma, version 3.2018. J Natl Compr Cancer Network. 2018;16(1):11–20.
- Gourzones-Dmitriev C, Kassambara A, Sahota S, et al. DNA repair pathways in human multiple myeloma. Cell Cycle. 2013;12(17):2760–2773.
- West SC. Molecular views of recombination proteins and their control. Nat Rev Mol Cell Biol. 2003;4:435.
- Mateos M-V, J-M H, M-T H, et al. Bortezomib plus melphalan and prednisone in elderly untreated patients with multiple myeloma: results of a multicenter phase 1/2 study. Blood. 2006;108(7):2165.
- Paola N, Li R, Kathy G, et al. Bortezomib-induced “BRCAness” sensitizes multiple myeloma cells to PARP inhibitors. Blood. 2011;118(24):6368–6379.
- Kumar S, Gkotzamanidou M, Pal J, et al. Elevated APE1 mediates dysregulation of homologous recombination in myeloma: mechanisms and translational significance. Blood. 2014;124(21):2074.
- Duo J, Wang G, Han X, et al. APE1 gene silencing promotes the sensitivity of osteosarcoma U2-OS cells to bortezomib. Zhongguo Zhong Liu Lin Chuang. 2012;39:429–432.
- Benetatos L, Vartholomatos G. Deregulated microRNAs in multiple myeloma. Cancer. 2012;118(4):878–887.
- Vislovukh A, Vargas TR, Polesskaya A, et al. Role of 3ʹ-untranslated region translational control in cancer development, diagnostics and treatment. World J Biol Chem. 2014;5(1):40–57.
- Zheng T, Wang J, Chen X, et al. Role of microRNA in anticancer drug resistance. Int J Cancer J Inter Du Cancer. 2010;126(1):2–10.
- Zhu H, Wu H, Liu X, et al. Role of MicroRNA miR-27a and miR-451 in the regulation of 1/P-glycoprotein expression in human cancer cells. Biochem Pharmacol. 2008;76(5):582–588.
- Alley MC, Scudiero DA, Monks A, et al. Feasibility of drug screening with panels of human tumor cell lines using a microculture tetrazolium assay. Cancer Res. 1988;48(3):589–601.
- Marta L, Marta B, Luca A, et al. Identification of microRNA expression patterns and definition of a microRNA/mRNA regulatory network in distinct molecular groups of multiple myeloma. Blood. 2009;114(25):20–26.
- Cosco D, Cilurzo F, Maiuolo J, et al. Delivery of miR-34a by chitosan/PLGA nanoplexes for the anticancer treatment of multiple myeloma. Sci Rep. 2015;5:17579.
- Shen X, Guo Y, Qi J, et al. Study on the association between miRNA-202 expression and drug sensitivity in multiple myeloma cells. Pathol Oncol Res Por. 2015;22(3):531–539.
- Morelli E, Leone E, Cantafio MEG, et al. Selective targeting of IRF4 by synthetic microRNA-125b-5p mimics induces anti-multiple myeloma activity in vitro and in vivo. Leukemia. 2015;29(11):2173–2183.
- Neri P, Gratton K, Ren L, et al. miRNA expression in multiple myeloma as predictive model of response to bortezomib. Blood. 2009;114(22):4918.
- Chi J, Ballabio E, Chen X-H, et al. MicroRNA expression in multiple myeloma is associated with genetic subtype, isotype and survival. Biol Direct. 2011;6(1):23.
- Li M, Lee KF, Lu Y, et al. Frequent amplification of a chr19q13.41 microRNA polycistron in aggressive primitive neuroectodermal brain tumors. Cancer Cell. 2009;16(6):533–546.
- Zhang Y, Geng L, Talmon G, et al. MicroRNA-520g confers drug resistance by regulating p21 expression in colorectal cancer. J Biol Chem. 2015;290(10):6215–6225.
- Zhang J, Liu L, Sun Y, et al. MicroRNA-520g promotes epithelial ovarian cancer progression and chemoresistance via DAPK2 repression. Oncotarget. 2016;7(18):26516–26534.
- Shen Q, Yao Q, Sun J, et al. Downregulation of histone deacetylase 1 by microRNA-520h contributes to the chemotherapeutic effect of doxorubicin. FEBS Lett. 2014;588(1):184–191.
- Padmanabhan R, Chen KG, Gillet J-P, et al. Regulation and expression of the ATP-binding cassette transporter ABCG2 in human embryonic stem cells. Stem Cells. 2012;30(10):2175–2187.
- Wilson DM, Anton S. Small molecule inhibitors of DNA repair nuclease activities of APE1. Cell Mol Life Sci. 2010;67(21):3621–3631.
- Wang D, Xiang DB, Yang XQ, et al. APE1 overexpression is associated with cisplatin resistance in non-small cell lung cancer and targeted inhibition of APE1 enhances the activity of cisplatin in A549 cells. Lung Cancer. 2009;66(3):298–304.
- Wang D, Luo M, Kelley MR. Human apurinic endonuclease 1 (APE1) expression and prognostic significance in osteosarcoma: enhanced sensitivity of osteosarcoma to DNA damaging agents using silencing RNA APE1 expression inhibition. Mol Cancer Ther. 2004;3(3):679–686.
- Xie J, Zhang L, Li M, et al. Functional analysis of the involvement of apurinic/apyrimidinic endonuclease 1 in the resistance to melphalan in multiple myeloma. BMC Cancer. 2014;14:11.