
 ?Mathematical formulae have been encoded as MathML and are displayed in this HTML version using MathJax in order to improve their display. Uncheck the box to turn MathJax off. This feature requires Javascript. Click on a formula to zoom.
ABSTRACT
Although improvements in radiation therapy were made over the years, radioresistance is still a major challenge. Cancer cells are often deficient for DNA repair response, a feature that is currently exploited as a new anti-cancer strategy. In this context, combination of inhibitors targeting complementary pathways is of interest to sensitize cells to radiation. In this work, we used PARP (Olaparib) and RAD51 (B02) inhibitors to radiosensitize cancer cells to proton and X-ray radiation. More particularly, Olaparib and B02 were used at concentration leading to limited cytotoxic (alone or in combination) but increasing cell death when the cells were irradiated. We showed that, although at limited concentration, Olaparib and B02 were able to radiosensitize different cancer cell lines, i.e. lung and pancreatic cancer cells. Antagonistic, additive or synergistic effects were observed and correlated to cell proliferation rate. The inhibitors enhanced persistent DNA damage, delayed apoptosis, prolonged cell cycle arrest and senescence upon irradiation. These results demonstrated that radiation-induced synthetic lethality might widen the therapeutic window, hence extending the use of PARP inhibitors to patients without BRCAness.
1. Introduction
During the course of their treatment, about 50% of cancer patients will undergo radiotherapy [Citation1]. Although improvements were made over the last decades to optimize the therapeutic index, radioresistance remains a concern and two major strategies are envisaged by Baumann et al. to improve patient outcome [Citation2–Citation4]: improvement of radiation dose conformity and biological strategies to optimize cell response.
In the seeking of the optimal dose spatial distribution, the emerging use of high energy charged particles like protons or carbon ions are major advances [Citation5,Citation6]. The advantage of heavy-charged particles compared to photons is the Bragg peak, i.e. the significant increase in the depth dose profile at the end of the particle track allowing dose deposition with high accuracy and sparing of surrounding healthy tissues. Regarding biological strategies, synthetic lethality is proposed to optimize cancer cell response to radiation with the idea of exploiting the addiction of cancer cells to DNA repair. A successful example is the use of a poly(ADP-ribose) polymerase (PARP) inhibitor (PARPi) on tumor with breast cancer susceptibility 1 and 2 (BRCA1/2) mutations [Citation7,Citation8]. PARP is rapidly activated upon DNA damage and, in response, binds to induced single-strand breaks (SSBs). SSBs can be generated by ionizing radiation or induced by the base excision repair (BER) pathway after exposure to alkylating agent like temozolomide. PARP uses nicotinamide adenine dinucleotide (NAD+) as a substrate generating nicotinamide and ADP-ribose, eventually forming long branched poly(ADP-ribose) chains which recruit the BER proteins. The use of PARPi leads to the stabilization of these SSBs which are translated into double-strand breaks (DSBs) at the replication fork. These DSBs, produced during S phase, are repaired through the homologous recombination (HR) pathway in which BRCA1 and BRCA2 are key proteins, but, when the cells are BRCA1/2 deficient, these DSBs are not repaired and can lead to cell death. Although the treatment of BRCA1/2 mutated patients with PARPi is giving promising results, resistance to treatment has been reported [Citation9,Citation10]. Examples of identified resistance mechanisms are secondary mutations in BRCA genes restoring the open reading frame of BRCA2 [Citation11] and overexpression of RAD51 partially overcoming the initial HR defect [Citation12]. RAD51 is one of the key proteins of the HR pathway promoting the DNA strand exchange after searching for the homolog sequence. RAD51 mRNA and protein levels are higher in cancer cells than in normal cells. Therefore, RAD51 is now considered as a clinically relevant target for combined therapies [Citation10]. Small molecules have been developed to target RAD51, some lead to inhibition of RAD51-ssDNA nucleoprotein filament formation but others can also inhibit the D-loop formation [Citation13]. RAD51 inhibitors, like B02, lead to an inhibition of HR and sensitize cells to DSBs [Citation14–Citation18].
In our work, we propose to take advantage of the combination of PARP and RAD51 inhibitors, Olaparib (AZD2281) and B02, respectively. This strategy seems very promising not only to counteract the resistance associated with PARPi but also to extend the use of PARPi to patients without BRCA mutations. More particularly, we worked in the frame of radiation-induced synthetic lethality, i.e. we used PARPi and RAD51i at concentrations that led to limited cytotoxic (alone or in combination) but to an increased cell death when the cells were irradiated with protons or X-rays.
2. Material and methods
2.1. Cell culture and inhibitors
Human A549 non-small-cell lung cancer (NSCLC) cells were sub-cultured in Glutamax Modified Eagle’s Medium (Gibco Life Technologies) supplemented with 10% fetal bovine serum (FBS) (Gibco). KP4 and PANC1 pancreatic cancer cells were sub-cultured in 4500 mg/l glucose Dulbecco’s Modified Eagle’s Medium (Gibco Life Technologies) 10% FBS supplemented. For the experiment, the medium was supplemented with 0.5% penicillin/streptomycin (Sigma). Olaparib (AZD2281, S1060, Selleckchem), a poly(ADP-ribose) polymerase inhibitor, was used at 0.5 µM final concentration. B02 (Millipore), a RAD51 inhibitor, was used at 10 µM final concentration. Cells were incubated in the presence of the inhibitors for a total duration of 24 h.
2.2. Proton and x-ray irradiation
The experimental set-up and irradiation procedure for protons using a 2MV tandem accelerator are described in [Citation19,Citation20]. The proton beam energy was set to 1.3 MeV corresponding to a fixed linear energy transfer (LET) of 25 keV/µm within the cell monolayer. This LET is the one leading to the highest effect of protons in cells [Citation21] and is found at the end of each particles track composing the spread out Bragg peak found in clinic. The dose-rate was set to 2 Gy/min.
For X-ray irradiation, cells were seeded at the same density as for the proton irradiation (800 cells/µl) the day before the irradiation. Irradiations were performed at 225 kV (X-RAD 225-XL, PXI) and the dose-rate set to 2 Gy/min.
For proton and X-ray irradiation, 3 to 4 h before irradiation, the culture medium was replaced with medium containing: no inhibitor (No Inh.); 0.5 µM Olaparib (Ola.); 10 µM B02 (B02) or 10 µM B02 and 0.5 µM Olaparib (B + O). The medium was supplemented or not with 10% FBS.
2.3. Immunofluorescence labeling
Experiment was performed following the procedure described in [Citation22]. The primary antibodies used were: rabbit polyclonal antibody anti-RAD51 antibody (HPA039310, Sigma), mouse monoclonal anti-pADPr antibody (ab14459, Abcam) and rabbit anti-phospho-histone H2AX (9664, Cell Signaling). Primary antibodies were diluted at 1:400 in bovine serum albumin (BSA) 2% in phosphate buffer saline (PBS). Secondary antibodies used were Alexa 488 nm anti-rabbit antibody (Fisher Scientific) and Alexa 568 nm anti-mouse antibody (Fisher Scientific) diluted at 1:1000 in PBS-BSA 2%. Nuclei were stained with 2.5 mg/ml DAPI (Sigma). The observations were performed by confocal microscopy by keeping the photomultiplier at a constant gain (Leica SP5).
2.4. Colony forming assay and survival fraction
After the irradiation, cells were detached using trypsin, then counted and seeded in six-well plates at desired concentrations in medium supplemented with 10% FBS containing the inhibitors. More precision on the procedure can be found in [Citation19,Citation20]. After 24 h, the medium was refreshed with FBS-supplemented medium without inhibitors and cells were left to proliferate. Twelve days post irradiation, the number of visible colonies (containing more than 50 cells) was counted after staining with crystal violet in 2% ethanol. At least three independent experiments were performed, and data are presented as mean ± 1 SD.
Experimental data were fitted with the linear-quadratic model (LQ) using GraphPad Prism 5.0 (GraphPad Software) given by the formula:
where SF is the surviving fraction, α (Gy−1) and β (Gy−2) are the radiosensitivity parameters and D is the dose. The method used was least square regression line with data weighted with 1/SD2.
From the survival fraction data, the Sensitivity Enhancement Ratio (SER) is obtained as:
where D50 is the dose required to reach 50% survival.
Finally, when working with drugs, the coefficient of drug interaction (CDI) highlights the potentiation obtained when combining two of them. Based on the survival fraction curves, the CDI was calculated as follows:
where SFD is the survival fraction associated to a dose D in the case of no inhibitor (SFD), Olaparib (SFD-Ola.), B02 (SFD-B02) and the combination Olaparib + B02 (SFD-B+O).
2.5. Flow cytometry
After the irradiation, cells were detached using trypsin, then counted and seeded in six-well plates. 24, 48 and 72 h after irradiation, cells were trypsinized, rinsed with PBS. For cell cycle arrest, cells were fixed/permeabilized in 70% ethanol and kept at −20°C before incubation with 50 µg/ml RNAse for 15 min at 37°C staining with 10µg/ml propidium iodide (Sigma). For apoptosis assessment, a FITC Annexin V detection kit was used (BD Pharmignen, #556547). Analysis was performed using FACS Verse (BD Biosciences). Cell-cycle distributions were determined using ModFit. At least three independent experiments were performed, and data are presented as mean ± 1 SD.
2.6. Senescence-associated beta-galactosidase
After the irradiation, cells were detached using trypsin, then counted and seeded in six-well plates. Seven days after irradiation, A549 cells were fixed with 2% formaldehyde, 0.2% glutaraldehyde in PBS for 5 min. Cells were rinsed twice with PBS and incubated at 37°C for 16 h in the staining solution containing: x-gal (20 mg/ml) (#0428-1G, Amresco), phosphate buffer (pH 6), potassium ferricyanide (100 mM), potassium ferrocyanide (100 mM), NaCl (2.5 M) and MgCl2 (1 M). After incubation, cells were rinsed twice with PBS and twice with methanol before observation under optical microscope [Citation23].
3. Results
3.1. Determination of Olaparib and B02 concentration resulting in limited cytotoxicity
To work in the frame of radiation-induced synthetic lethality, non-toxic concentrations of the inhibitors were chosen. Clonogenic assays were used to evaluate this cytotoxicity. Concentrations equal to 0.5 µM for Olaparib and to 10 µM for B02 led to a limited toxicity alone and in combination (-) and were chosen for this work. We then verified that these concentrations exert an inhibitory effect on their respective targets. Cells were treated with 1 µM bleomycin for 2 h to produce SSBs and PARP inhibition by Olaparib was evaluated by poly(ADP-ribose) (pADPr) chain immuno-labeling ()). Similarly, RAD51 inhibition by B02 was measured on cells irradiated with 2 Gy X-ray and labeled for RAD51 3 h later (). Results showed a significant decrease in the target after treatment at the chosen concentration. The level of pADPr and RAD51 foci formation was also evaluated 3 h and 24 h after 2 Gy proton irradiation. Reduced levels of targets were observed when A549 cells were incubated with Olaparib or B02 (supplementary Figures S1-S2). Altogether, these results show that 0.5 µM Olaparib and 10 µM B02 allowed a significant inhibition of the respective targets.
Figure 1. Inhibitor cytotoxicity and efficiency. (a-b) A549 cells were exposed to increasing concentrations of Olaparib and B02 during 24 h. The survival fraction was determined using clonogenic assays 12 days after treatment. (a) Survival fraction obtained after exposure to Olaparib; (b) Survival fraction obtained after exposure to B02. Three independent experiments were performed, and data are presented as mean ± 1 SD. The data have been adjusted to a sigmoidal dose–response curve using GraphPad Prism. (c-d) Inhibitor efficiency at the chosen concentration: 3 h before exposure, A549 cells were incubated in the presence or absence of 0.5 µM Olaparib (Ola.), 10 µM B02 (B02) or the two inhibitors (B+O). (c) After a 2 h exposure to 1 µM bleomycin, A549 cells were labeled for pADPr and the proportion of pADPr positive cells determined; (d) 3 h after 2 Gy X-ray irradiation, A549 cells were labeled for RAD51 and cells with more than 5 RAD51 foci scored. Three independent experiments were performed, and data are presented as mean ± 1 SD. Mann-Whitney statistical analyses were performed (p > 0.05: ns; p < 0.05: *; p < 0.01: **; p < 0.001: ***).
3.2. Olaparib and B02 induce changes in DSB induction and repair after proton irradiation
In order to highlight the effect of the inhibitors on the DSB repair kinetics, A549 cells were irradiated with 2 Gy protons and labeled for phospho-H2AX (γH2AX) 30 min, 2 h and 24 h postirradiation ()) and quantify (–). After 30 min and 2 h, a significant increase in the number of foci per cell was observed in cells irradiated with 2 Gy compared to non-irradiated cells, with or without inhibitors. At 24 h, there was no longer a difference between irradiated and non-irradiated cells incubated in the absence of inhibitor, indicating DSB repair. However, if the cells were incubated in the presence of the inhibitors, the number of scored γH2AX foci was still significantly higher compared to non-irradiated cells. At 24 h, the number of foci recorded for cells irradiated with B02 (with or without Olaparib) was significantly higher compared to cells irradiated without inhibitor ()).
Figure 2. Olaparib and B02 induced changes in DSB repair. A549 cells were irradiated with 2 Gy protons. 3 to 4 h before irradiation, cells were incubated in the presence or absence of 0.5 µM Olaparib (Ola.), 10 µM B02 (B02) or the two inhibitors (B+O). 30 min, 2 h and 24 h after irradiation, cells were labeled for γ-H2AX. (a) Representative images; (b) Number of foci per cell counted on one focal plane 30 min, 2 h and 24 h after irradiation. One way ANOVA (Tukey) statistical analyses were performed (p > 0.05: ns; p < 0.05: *; p < 0.01: **; p < 0.001: ***); (c) Proportion of cells with more than 8 foci 30 min, 2 h and 24 h after 2 Gy irradiation; (d) Mean number of foci (Mean & SEM) after 2 Gy irradiation at 30 min, 2 h and 24 h. Data from two independent experiments (more than 100 cells per sample were counted).
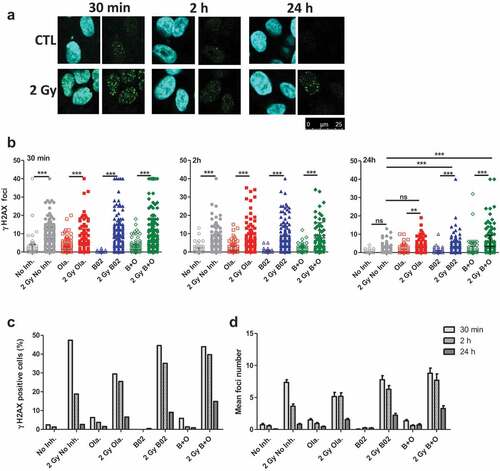
Based on the number of foci scored, the proportion of γH2AX positive cells presenting more than eight foci ()) and the mean number of foci per cell ()) were determined. Along post-irradiation time, γH2AX level decreased, indicating DSB repair. However, the proportion of positive cells at 24 h increased from 5% (0.8 foci/cell) in the absence of inhibitor, 7% (1.5 foci/cell) for Olaparib, 10% (2.2 foci/cell) for B02 to 15% (3.3 foci/cell) for cells incubated with Olaparib and B02.
3.3. Olaparib and B02 enhance proton irradiation-induced cell cycle arrest
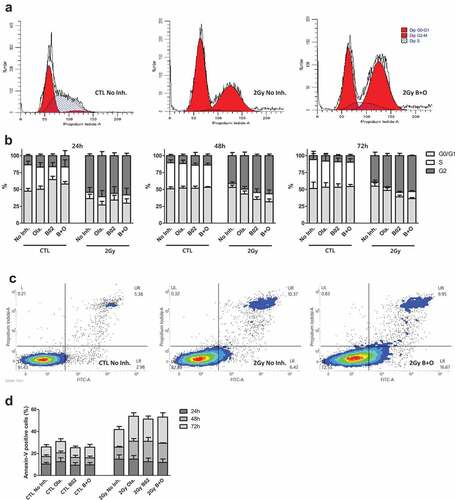
To determine the influence of the inhibitors and their combination on cell response after irradiation protein and mRNA extraction were performed 24 h post-irradiation. The results (Figure S3A-D) showed an increased abundance of p21 at protein and mRNA level, especially with inhibitor combination as well as a decreased level of Ki67. Based on these observations, cell cycle arrest was determined by flow cytometry 24, 48 and 72 h after 2 Gy proton irradiation in the presence or absence of inhibitors (-). Early and late apoptosis assessment was also performed at the same time point post-irradiation (-). In accordance with the results from the protein and mRNA analysis, B02 combined or not to Olaparib led to a decreased proportion of cells in S phase at 24 h in non-irradiated cells. This was no longer observed at later time points. As highlighted in ), proton irradiation induced a massive G2 cell cycle arrest 24 h after irradiation for cells incubated or not with inhibitors. Without inhibitor, G0/G1 level was back to the control level from 48 h after irradiation while S phase level was still low. For cells incubated with inhibitors, the proportion of G1 cells was still lower than respective controls 48 h after irradiation, especially in the case of cells incubated with B02 combined or not to Olaparib. No recovery of cells arrested in G2 phase was observed 72 h after irradiation for cells incubated with B02 and Olaparib while it reduced from 55% to 39% in cells irradiated without inhibitors and from 61% to 46% in cells incubated with Olaparib. Finally, ) highlights 15% of apoptotic cells 24 h after irradiation indicating limited apoptosis but this proportion increased over post-irradiation time leading to a cumulative proportion of apoptotic cells around 40% in the absence of inhibitor to more than 50% in cells exposed to both inhibitors.
Figure 3. Inhibitors effects on cell cycle arrest and apoptosis. A549 cells were irradiated with 2 Gy protons. 3 to 4 h before irradiation, cells were incubated in the presence or absence of 0.5 µM Olaparib (Ola.), 10 µM B02 (B02) or the two inhibitors (B + O). (a) Representative spectrum of flow cytometry analysis for cell cycle arrest obtained 72 h after irradiation; (b) Proportion of cells in G0/G1, S and G2 24 h, 48 h and 72 h after irradiation; (c) Representative spectrum of flow cytometry analysis of apoptosis obtained 72 h after irradiation; (d) Proportion of apoptotic (Annexin-V positive) cells. Three independent experiments were performed, and data are presented as mean ± 1 SD.
3.4. Proton-irradiation induces delayed cell death
After irradiation, cells that did not form colonies, but that were still attached to the dish were observed. Since massive cell cycle arrest and increased levels of p21 protein and mRNA were observed, we evaluated if proton irradiation-induced senescence. For that purpose, 7 days after irradiation, the cells were stained for beta-galactosidase (β-gal) under acidic pH allowing to detect senescent cells. Examples are presented in . Among the cell population, different features were observed: β-gal positive cells outside of a colony of less than four cells ()), these cells were not recorded for the quantification; colonies without any β-gal positive cells ()), these colonies were recorded as negative; colonies containing one or more β-gal positive cells ()), these colonies were recorded as positive colonies. All cells found in non-irradiated condition formed colonies and about 10% to 20% of these colonies were positive for β-gal. After 2 Gy proton irradiation, a large number of cells that did not produce clones and that exhibited a positive staining were observed. For the cells that generated colonies, the proportion of positive colonies was significantly higher for irradiated cells compared to non-irradiated cells (40% to 50%) ()).
Figure 4. Delayed cell death. A549 cells were irradiated with 2 Gy protons. 3 to 4 h before irradiation, cells were incubated in the presence or absence of 0.5 µM Olaparib (Ola.), 10 µM B02 (B02) or the two inhibitors (B+O). Seven days after irradiation A549 cells were stained for beta-galactosidase to detect senescent cells or with DAPI to visualize cell nuclei. (a–d): Colonies with more than four cells were recorded and scored as positive if they contained one or more blue cells. (a) Senescent cell outside of a colony, not recorded; (b) Colonies without senescent cells, recorded as negative; (c) Colonies with one or more senescent cells, recorded as positive; (d) Quantification β-gal positive colonies for cells irradiated with protons. Mann-Whitney statistical analyses were performed. Data based on two independent experiments each with 2 replicates (more than 50 colonies counted for each replicate). (e) Nuclei stained with DAPI 7 days after 2 Gy proton irradiation showing nuclei with normal shape or abnormal shape (enlarged, apoptotic, micronuclei, multinucleated); (f) Nuclei were counted within colonies or single cells and cells with micronuclei, giant nuclei, multinuclei or apoptotic nuclei scored. Data from three independent experiments.
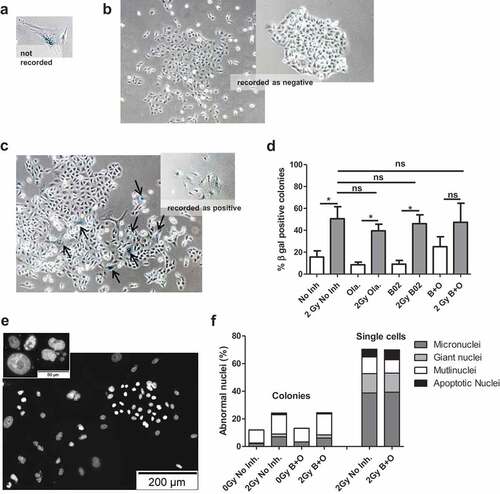
In parallel, cells were labeled with DAPI (-) allowing to detect cells undergoing apoptosis or cells with abnormal nucleus like giant nucleus, multinucleated cells or presenting micronuclei. In non-irradiated cells, incubated or not with Olaparib and B02, all cells were found in colonies and about 10–15% of the cells presented an abnormal shape (multinucleated for ~80% of them). After 2 Gy proton irradiation, cells were found amongst colonies as well as single cells staying attached to the coverslip. Amongst the colonies, 25% of the cells presented an abnormal shape with a majority of them being multinucleated (~60%), presenting micronuclei (~25–30%) or having an enlarged nucleus (~10%). In the cells that did not form colonies after irradiation, 70% of them displayed an abnormal shape with a higher proportion of micronuclei (55%), enlarged nuclei (20%) or even apoptotic bodies (10%). Although a clear effect of the irradiation was obtained, no difference was detected between cells incubated with or without Olaparib and B02.
3.5. Olaparib and B02 radiosensitize cells to protons and x-rays
To evaluate the radiosensitizing potential of the inhibitors and of their combination, A549 cell survival fraction curves were determined after exposure to increasing doses of protons or X-rays. To detect the effect of the inhibitors, 3 to 4 h before irradiation the cells were incubated in medium with serum and containing or not the inhibitors. The cells were incubated in the presence of inhibitors during 24 h then the medium was refreshed. For each inhibitor, the survival fraction was determined 12 days post-irradiation in comparison to the respective controls.
A549 cell survival fractions obtained after X-ray and proton irradiation are presented in . The results showed shouldered survival fractions after X-ray irradiation while a linear trend was obtained after proton irradiation with a significantly lower survival compared to X-rays. For the two types of radiation, radiosensitization was observed in the presence of the inhibitors.
Figure 5. Survival fraction. A549 cells were exposed to 225 kV X-rays or 25 keV/µm broad proton beam at 2 Gy/min. 3 to 4 h before irradiation, cells were incubated in medium with serum containing or not the inhibitors, i.e. no inhibitor, 0.5 µM Olaparib, 10 µM B02 and B02+ Olaparib. The survival fraction was determined using clonogenic assays. Cells were incubated for a total duration of 24 h with: No Inhibitor (black dot); 0.5µM Olaparib (red square); 10 µM B02 (blue up triangle), 10 µM B02 0.5 µM + Olaparib (green down triangle) then in control culture medium for 11 days. At least three independent experiments were performed, and data are presented as mean ± 1 SD. The data have been fitted using the Linear-Quadratic model for X-rays (filled symbols and lines) and Linear model for protons (empty symbols and dotted lines).
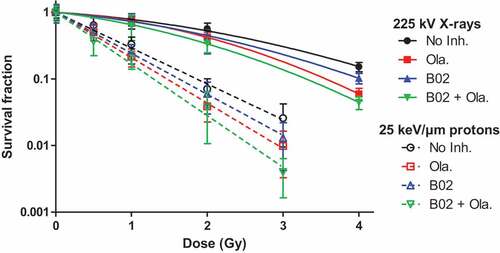
The data were adjusted to the Linear-Quadratic (X-rays) or Linear (protons) model. For both radiation types, the results showed a radiosensitization when using Olaparib and/or B02 with SER between 1.14 and 1.27 and a further enhancement if the inhibitors were combined with SER up to 1.46 associated to a decreasing survival at 2 Gy ().
Table 1. Radiosensitivity parameters, sensitivity enhancement ratio (SER) and survival fraction at 2 Gy of A549 cells irradiated with X-rays or protons in the presence or absence of inhibitors in medium with serum.
3.6. Combined effect of Olaparib and B02 after proton irradiation depends on proliferation rate
The survival fraction after proton irradiation was also determined for A549 cells irradiated in medium without serum (, top panel) and the coefficient of drug interaction calculated. CDI is used to highlight an antagonist (CDI >1), additive (CDI = 1) or synergistic (CDI <1) effect between two drugs. For cells irradiated in the presence of serum, CDI decreased with dose and ranged from 0.98 (0.5 Gy) to 0.89 (3 Gy) indicating an additive effect of the combination of Olaparib and B02 or even a slight synergy at higher doses. This synergy was no longer observed if cells were irradiated in medium without serum, the inhibitor combination led to an antagonist effect with CDI of 1.17 at 2 Gy. Indeed, although a radiosensitization was observed (SER≈1.20), the combination of inhibitors did not further decrease the survival fraction. To explain this marked effect of serum regarding the radiosensitization effect of the inhibitors, the proportion of proliferating cells at the irradiation time was assessed using pulsed BrdU incorporation. For that purpose, cells were handled in the exact same way as for irradiation and BrdU was added for 45 min before the irradiation time. Flow cytometry analysis allowed to determine the proliferating cell proportion but also to highlight differences in the rate of BrdU incorporation. The analysis showed a 40% BrdU positive population in all treatments, but a higher incorporation of BrdU in the cells incubated with serum. This indicates that the proliferating cells replicated DNA faster in the presence of serum (Figure S4). This can explain the higher effect of proton irradiation in the presence of the inhibitors when cells were incubated in medium with serum.
Figure 6. Survival fraction. A549, KP4 and PANC1 cells were exposed to 225 kV X-rays or 25 keV/µm broad proton beam at 2 Gy/min. 3 to 4 h before irradiation the cells were incubated in medium without serum (A549) or with serum (A549, KP4, PANC1). The survival fraction was determined using clonogenic assays. Cells were incubated for a total duration of 24 h with: No Inhibitor (black dot); 0.5µM Olaparib (red square); 10 µM B02 (blue up triangle), 10 µM B02 0.5 µM + Olaparib (green down triangle) then in control culture medium for 11 days. At least three independent experiments were performed, and data are presented as mean ± 1 SD. The data have been fitted using Linear model. One way ANOVA (Kruskal–Wallis) statistical analyses were performed (p > 0.05: ns; p < 0.05: *; p < 0.01: **; p < 0.001: ***).
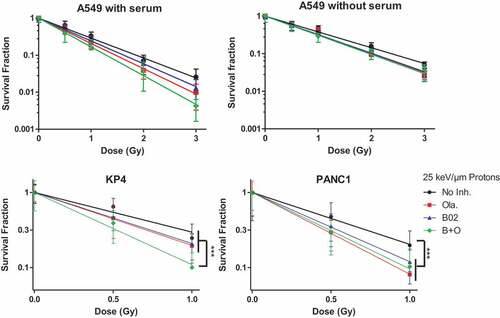
To highlight further that the proliferation rate influences the drug combination effect after proton irradiation, cells with different doubling time were irradiated. For that purpose, pancreatic cancer cells KP4 and PANC1 (17 and 32 h doubling time, respectively) were irradiated in the presence of the same inhibitors combination as A549 cells (doubling time equal to 22 h). As shown in (bottom panel), Olaparib and B02 radiosensitized pancreatic cancer cells with SER at 37% survival ranging from 1.3 (Ola. and B02) to 1.8 (B + O) for KP4, and from 1.3 (B02) to 1.6 (Ola.) for PANC1. However, the combination of the inhibitors only sensitized further KP4 cells to proton irradiation. Indeed, the combination of Olaparib and B02 led to a synergistic effect (CDI equal to 0.89, 0.79 at 0.5 and 1 Gy) in KP4 cells while for PANC1, displaying a reduced growth rate, the combination led to an increasing antagonist effect with dose (CDI equal to 1.41 and 1.99 at 0.5 and 1 Gy).
Altogether, these results showed that antagonist and additive/synergistic effect could be obtained with the same drug concentrations after proton irradiation, depending on the cell proliferation rate.
4. Discussion and conclusion
In this work, we proposed to take advantage of the combination of PARP and RAD51 inhibitors, Olaparib (AZD2281) and B02 used at a non-toxic concentration, to sensitize cancer cells to proton and X-ray irradiation. PARPi have been used in cell lines without BRCA mutations and showed synergy with DNA damaging agents, like chemotherapeutic drugs [Citation24–Citation26], or radiation [Citation27,Citation28]. For cells possessing efficient DNA repair machinery, the use of inhibitors impairing complementary pathways like PARPi and RAD51i seems very promising to increase cell death upon irradiation.
The cellular responses associated with the use of the inhibitors in non-irradiated cells were first studied and, as explained, we aimed for a limited toxicity. Compared to cells incubated without inhibitors, increased p21 abundance at protein and mRNA levels and decreased proportion of S-phase cells were observed leading to a higher proportion of β-gal positive cells. This can explain the decrease of 20% in clonogenic survival for cells incubated with both inhibitors. This toxicity is probably linked to replication stress. Indeed, RAD51 binds to ssDNA in order to prevent nucleolytic degradation and this protection is impaired in presence of B02 [Citation29]. Moreover, a study reported the induction of cellular senescence by transcriptional repression of DNA repair genes, like RAD51, in an amplifying loop involving p53/p21/RB factors [Citation30].
Our results showed that proton irradiation led to an increased p53 protein level. p53 activates a plethora of cellular responses including the initiation of apoptosis and cell cycle arrest. We detected apoptosis by flow cytometry in only 15% of cells 24 h after irradiation. This lack of apoptosis is not surprising as mitotic catastrophe, resulting from aberrant mitosis, is considered as the main cell death induced by ionizing radiation leading to the formation of large non-viable cells presenting micronuclei or multiple nuclei [Citation31–Citation33]. Cells undergoing mitotic catastrophe can survive days to eventually die by delayed apoptosis, necrosis or induced senescence. In previous works, we have shown that A549 cells irradiated with X-rays, protons or alpha particles preferentially undergo mitotic catastrophe with a limited proportion of cells undergoing apoptosis [Citation20,Citation34]. A small proportion of apoptotic cells was observed at different time post-irradiation and, although limited, the observed cumulative effect could account for the decrease in cell survival. In parallel, we observed increased p21 mRNA and protein levels after irradiation. p21 is an inhibitor of cyclin-dependent-kinases and its induction by p53 leads to cell cycle arrest in G1 due to the inhibition of CDK4 and CDK6 while it also prevents G2/M transition initiated by CDK1-cyclinB complex. In this work, we showed that 2 Gy proton irradiation led to a massive cell cycle arrest in G2 phase that persisted 72 h after irradiation. Beside transient cell cycle arrest, p21 activation has also been identified as a first step leading to accelerated senescence or stress-induced premature senescence [Citation35]. This can occur through CDK2 inhibition and ultimately leads to radiation-induced senescence [Citation36]. For example, Wouters et al. exposed p53 wild type HTC116 human carcinoma cells (p21+/+) and a derivative p21−/- to 10 Gy γ-rays and reported a significantly lower proportion of apoptotic cells with p21+/+ compared to p21−/- derivative. Although the survival fraction highlighted only a small protection associated to p21 knockout, the authors reported that the p21+/+ petri dishes contained a “lawn” of attached clonogenically dead cells while p21−/- did not [Citation37]. It is well accepted that radiation can lead to senescence and some studies focus now on the possible recovery or escape from this senescent state leading to resistance to treatment [Citation38–Citation41]. We observed that 50% of recorded colonies 7 days after proton irradiation contained senescent cells. Moreover, cells that did not produce clones displayed β-gal activity and, for the majority of them, were multinucleated, presented micronuclei or were enlarged. To detect any resurgence of those cells, single cell irradiated with 2 Gy protons were seeded and followed for about two months. Cells which did not produce colonies after 7 days never recovered, indicating that the senescence state observed was permanent, at least for isolated cells. These senescent cells are clonogenically dead but metabolically active and may be associated with possible benefit (immune cell attraction) or liability (promotion of cell proliferation and invasion) for tumor progression [Citation42–Citation44]. In this research, although the use of Olaparib and B02 led to increased cell death that could be associated to accumulation of apoptotic cells, it did not clear this senescent population, suggesting that a focus on the use of adjuvant senolytic drugs could be an interesting approach to improve radiation therapy.
We have shown that Olaparib and B02 radiosensitized A549 cells to protons and X-rays with SER up to 1.45. Although the SER were comparable, the survival fraction obtained after proton irradiation was as much as 10 times lower than the ones obtained with X-rays at 2 Gy when using the inhibitors alone or in combination. This was expected as the proton energy used in this work corresponds to the LET leading the highest effects of protons on cell survival. Twenty-four hours after 2 Gy proton irradiation, analysis of γ-H2AX, highlighted persistent damages in cells incubated with Olaparib, B02 or both. For Olaparib, the remaining γH2AX could be associated with a continuing production of DSBs from SSBs hitting the replication fork; for B02, HR being impaired, a lack of DSB repair is probably involved and explains the slower decrease in γH2AX level; and for the combination both production of DSBs and lack of repair could be implicated. Moreover, cells incubated with both inhibitors displayed increased levels of p21 mRNA and a higher proportion of G2 arrested cells as well as an increased proportion of apoptotic cells over 72 h post-irradiation compared to cells incubated without inhibitors. It was also highlighted that, for proton irradiation, serum drastically affects the effect of Olaparib-B02 combination. This is in agreement with the fact that radiosensitization using PARPi is replication dependent [Citation45]. Indeed, DNA synthesis was faster in the presence of serum, hence inducing supplementary stalled replication forks in the presence of Olaparib, followed by DBS formation and ultimately increased cell death. Finally, if combined with the effect of B02, the DSBs produced at the replication forks cannot be repaired by homologous recombination leading a further increase in cell death, i.e. to a synergy between the inhibitors. This was confirmed in two pancreatic cancer cell lines that display very different proliferation rate. Indeed, Olaparib and B02 combination led to a strong synergy only in the fast cycling KP4 cells while antagonism was observed for PANC1 cells. Nonetheless, a strong radiosensitization was observed for both cell lines with SER at 37% being as high as 1.6 for PANC1 treated with Olaparib and 1.8 for KP4 treated with inhibitors combined.
This work demonstrated the benefit of radiation-induced synthetic lethality, i.e. Olaparib and B02 led to limited cytotoxic (alone or in combination) but to an increased cell death when the cells were irradiated with protons or X-rays. Depending on the proliferation rate, antagonist, additive or synergistic effects were observed when combining Olaparib and B02 to proton irradiation. This type of approach suggests that the therapeutic window could be expanded as the enhanced cell killing only happens in the irradiated area and depends on a high proliferation rate. This would be especially the case in tumor with fast replicating cells in the vicinity of slow or non-proliferating healthy tissues like in the brain or in the pancreas.
Author contributions
ACW designed the work, acquired, analyzed and interpreted all the data with the help of AL and MS for data acquisition and analysis. SL and CM helped with the conception, design and data interpretation. ACW drafted the manuscript and all authors revised and approved it.
Supplemental Material
Download MS Word (8.8 MB)Acknowledgments
The authors thank T. Tabarrant for technical support, C. Demazy and N. Ninane for confocal microscopy acquisition. The authors thank B. Le Calvé for his intellectual input. The authors are thankful to the technological platforms SIAM and Morph-Im (University of Namur).
Disclosure statement
No potential conflict of interest was reported by the authors.
Supplementary Material
Supplemental data for this article can be accessed here.
Additional information
Funding
References
- Delaney G, Jacob S, Featherstone C, et al. The role of radiotherapy in cancer treatment. Cancer. 2005;104:1129–1137.
- Chargari C, Magne N, Guy JB, et al. Optimize and refine therapeutic index in radiation therapy: overview of a century. Cancer Treat Rev. 2016;45:58–67.
- Thariat J, Hannoun-Levi JM, Sun Myint A, et al. Past, present, and future of radiotherapy for the benefit of patients. Nat Rev Clin Oncol. 2013;10:52–60.
- Baumann M, Krause M, Overgaard J, et al. Radiation oncology in the era of precision medicine. Nat Rev. 2016;16:234–249.
- Durante M, JS L. Charged particles in radiation oncology. Nat Rev Clin Oncol. 2010;7:37–43.
- JS L, Durante M. Charged particle therapy–optimization, challenges and future directions. Nat Rev Clin Oncol. 2013;10:411–424.
- Bryant HE, Schultz N, Thomas HD, et al. Specific killing of brca2-deficient tumours with inhibitors of poly(adp-ribose) polymerase. Nature. 2005;434:913–917.
- Lesueur P, Chevalier F, Austry JB, et al. Poly-(adp-ribose)-polymerase inhibitors as radiosensitizers: a systematic review of pre-clinical and clinical human studies. Oncotarget. 2017;8:69105–69124.
- CJ L, Ashworth A. Mechanisms of resistance to therapies targeting brca-mutant cancers. Nat Med. 2013;19:1381–1388.
- Ward A, Khanna KK, Wiegmans AP. Targeting homologous recombination, new pre-clinical and clinical therapeutic combinations inhibiting rad51. Cancer Treat Rev. 2015;41:35–45.
- Barber LJ, Sandhu S, Chen L, et al. Secondary mutations in brca2 associated with clinical resistance to a parp inhibitor. J Pathol. 2013;229:422–429.
- Juvekar A, Burga LN, Hu H, et al. Combining a pi3k inhibitor with a parp inhibitor provides an effective therapy for brca1-related breast cancer. Cancer Discov. 2012;2:1048–1063.
- Budke B, Lv W, Kozikowski AP, et al. Recent developments using small molecules to target rad51: how to best modulate rad51 for anticancer therapy? ChemMedChem. 2016;11:2468–2473.
- Alagpulinsa DA, Ayyadevara S, Shmookler RRJ. A small-molecule inhibitor of rad51 reduces homologous recombination and sensitizes multiple myeloma cells to doxorubicin. Front Oncol. 2014;4:289.
- Huang F, Mazina OM, Zentner IJ, et al. Inhibition of homologous recombination in human cells by targeting rad51 recombinase. J Med Chem. 2012;55:3011–3020.
- Ma H, Takahashi A, Yoshida Y, et al. Combining carbon ion irradiation and non-homologous end-joining repair inhibitor nu7026 efficiently kills cancer cells. Radiat Oncol. 2015;10:225.
- Huang F, AV M. A small molecule inhibitor of human rad51 potentiates breast cancer cell killing by therapeutic agents in mouse xenografts. PloS One. 2014;9:e100993.
- Huang F, Motlekar NA, Burgwin CM, et al. Identification of specific inhibitors of human rad51 recombinase using high-throughput screening. ACS Chem Biol. 2011;6:628–635.
- Wéra AC, Riquier H, Heuskin AC, et al. In vitro irradiation station for broad beam radiobiological experiments. Nucl Instrum Methods Phys Res A. 2011;269:3120–3124.
- A-C W, Heuskin A-C, Riquier H, et al. Low-let proton irradiation of a549 non-small cell lung adenocarcinoma cells: dose response and rbe determination. Radiat Res. 2013;179:273–281.
- Folkard M, Prise KM, Vojnovic B, et al. Inactivation of v79 cells by low-energy protons, deuterons and helium-3 ions. Int J Radiat Biol. 1996;69:729–738.
- Piret J-P, Cosse J-P, Ninane N, et al. Hypoxia protects hepg2 cells against etoposide-induced apoptosis via a hif-1-independent pathway. Exp Cell Res. 2006;312:2908–2920.
- Debacq-Chainiaux F, Erusalimsky JD, Campisi J, et al. Protocols to detect senescence-associated beta-galactosidase (sa-betagal) activity, a biomarker of senescent cells in culture and in vivo. Nat Protoc. 2009;4:1798–1806.
- Miura K, Sakata K, Someya M, et al. The combination of olaparib and camptothecin for effective radiosensitization. Radiat Oncol. 2012;7:62.
- Cheng H, Zhang Z, Borczuk A, et al. Parp inhibition selectively increases sensitivity to cisplatin in ercc1-low non-small cell lung cancer cells. Carcinogenesis. 2013;34:739–749.
- Michels J, Vitale I, Senovilla L, et al. Synergistic interaction between cisplatin and parp inhibitors in non-small cell lung cancer. Cell Cycle (Georgetown, TX). 2013;12:877–883.
- Senra JM, Telfer BA, Cherry KE, et al. Inhibition of parp-1 by olaparib (azd2281) increases the radiosensitivity of a lung tumor xenograft. Mol Cancer Ther. 2011;10:1949–1958.
- Bridges KA, Toniatti C, Buser CA, et al. Niraparib (mk-4827), a novel poly(adp-ribose) polymerase inhibitor, radiosensitizes human lung and breast cancer cells. Oncotarget. 2014;5:5076–5086.
- Schlacher K, Wu H, Jasin M. A distinct replication fork protection pathway connects fanconi anemia tumor suppressors to rad51-brca1/2. Cancer Cell. 2012;22:106–116.
- Collin G, Huna A, Warnier M, et al. Transcriptional repression of DNA repair genes is a hallmark and a cause of cellular senescence. Cell Death Dis. 2018;9:259.
- Cohen-Jonathan E, Bernhard EJ, WG M. How does radiation kill cells? Curr Opin Chem Biol. 1999;3:77–83.
- Roninson IB. Broude EV Chang BD. If not apoptosis, then what? Treatment-induced senescence and mitotic catastrophe in tumor cells. Drug Resist Updat. 2001;4:303–313.
- Eriksson D, Stigbrand T. Radiation-induced cell death mechanisms. Tumour Biol. 2010;31:363–372.
- Riquier H, Wera AC, Heuskin AC, et al. Comparison of x-ray and alpha particle effects on a human cancer and endothelial cells: survival curves and gene expression profiles. Radiother Oncol. 2013;106:397-403.
- Ewald JA, Desotelle JA, Wilding G, et al. Therapy-induced senescence in cancer. J Natl Cancer Inst. 2010;102:1536–1546.
- Maier P, Hartmann L, Wenz F, et al. Cellular pathways in response to ionizing radiation and their targetability for tumor radiosensitization. Int J Mol Sci. 2016;17(1):102.
- Wouters BG, Giaccia AJ, Denko NC, et al. Loss of p21waf1/cip1 sensitizes tumors to radiation by an apoptosis-independent mechanism. Cancer Res. 1997;57:4703–4706.
- Coqueret O. Senescence: adaptation to DNA repair targeting drugs? Cell Cycle (Georgetown, TX). 2016;15:2549–2550.
- Guillon J, Petit C, Moreau M, et al. Regulation of senescence escape by tsp1 and cd47 following chemotherapy treatment. Cell Death Dis. 2019;10:199.
- Alotaibi M, Sharma K, Saleh T, et al. Radiosensitization by parp inhibition in DNA repair proficient and deficient tumor cells: proliferative recovery in senescent cells. Radiat Res. 2016;185:229–245.
- Gewirtz DA, Alotaibi M, Yakovlev VA, et al. Tumor cell recovery from senescence induced by radiation with parp inhibition. Radiat Res. 2016;186:327–332.
- Lecot P, Alimirah F, Desprez PY, et al. Context-dependent effects of cellular senescence in cancer development. Br J Cancer. 2016;114:1180–1184.
- Perez-Mancera PA, Young AR, Narita M. Inside and out: the activities of senescence in cancer. Nat Rev. 2014;14:547–558.
- Jonchere B, Vetillard A, Toutain B, et al. Irinotecan treatment and senescence failure promote the emergence of more transformed and invasive cells that depend on anti-apoptotic mcl-1. Oncotarget. 2015;6:409–426.
- Dungey FA, Loser DA, Chalmers AJ. Replication-dependent radiosensitization of human glioma cells by inhibition of poly(adp-ribose) polymerase: mechanisms and therapeutic potential. Int J Radiat Oncol Biol Phys. 2008;72:1188–1197.