
ABSTRACT
Clathrin regulates mitotic progression, in addition to membrane trafficking. However, the detailed regulatory mechanisms of clathrin during mitosis remain elusive. Here, we demonstrate novel regulation of clathrin during mitotic phase of the cell cycle. Clathrin heavy chain (CHC) was phosphorylated at T606 by its association partner cyclin G-associated kinase (GAK). This phosphorylation was required for proper cell proliferation and tumor growth of cells implanted into nude mice. Immunofluorescence analysis showed that the localization of CHC-pT606 signals changed during mitosis. CHC-pT606 signals localized in the nucleus and at the centrosome during interphase, whereas CHC signals were mostly cytoplasmic. Co-immunoprecipitation suggested that CHC formed a complex with GAK and polo-like kinase 1 (PLK1). Depletion of GAK using siRNA induced metaphase arrest and aberrant localization of CHC-pT606, which abolished Kiz-pT379 (as a phosphorylation target of PLK1) signals on chromatin at metaphase. Taken together, we propose that the GAK_CHC-pT606_PLK1_Kiz-pT379 axis plays a role in proliferation of cancer cells.
Introduction
Clathrin, a multimeric protein complex consisting of three clathrin heavy chains (CHCs) each associated with clathrin light chain, regulates not only membrane trafficking [Citation1], but also the mitotic (M) phase of the cell cycle by co-localizing with the mitotic spindle, which is a so-called moonlighting function [Citation2–Citation5]. This regulation involves modulation of the stability of kinetochore fibers (K-fibers), which are composed of many bundles of parallel microtubules (MTs) crosslinked by inter-MT bridges, during early mitosis to ensure chromosome movement. Clathrin forms a complex with transforming acidic coiled-coil protein 3 (TACC3) and colonic and hepatic tumor overexpressed gene (ch-TOG). This complex is anchored to the spindle and stabilizes K-fibers via physical crosslinking [Citation6,Citation7]. Phosphorylation of TACC3 by Aurora A is required to load the TACC3_ch-TOG complex onto mitotic spindle MTs. Inhibition of this kinase removes clathrin and TACC3 from spindles [Citation8], which induces destabilization of K-fibers and loss of inter-MT bridges [Citation9]. Notably, clathrin-mediated endocytosis (CME) does not occur during early mitosis due to increased membrane tension in mitotic cells [Citation10–Citation12]. In these cells, the actin cytoskeleton is required to support CME and overcome the enhanced load [Citation13]. Three-dimensional electron microscopy revealed that K-fiber MTs are linked by a network of MT connectors, dubbed “the mesh”, which stabilizes K-fibers by pulling MTs together [Citation14]. MT organization in the mitotic spindle is sensitive to the level of spindle-associated TACC3 [Citation15]. It remains elusive if this is the only mechanism underlying the moonlighting function of clathrin.
Polo-like kinase 1 (PLK1), a mitotic kinase that ensures the fidelity of the initiation, maintenance, and completion of mitosis, plays an essential role in centrosome maturation, spindle assembly, and MT-kinetochore attachment, thereby maintaining genomic stability [Citation16–Citation18]. Many PLK1 substrates are involved in various facets of cell cycle progression, including DNA replication, centrosome maturation, G2/M phase transition, MT dynamics, the spindle assembly checkpoint, sister chromatid cohesion, mitotic exit, and cytokinesis [Citation19,Citation20]. PLK1 also regulates the DNA damage response, including apoptosis and checkpoint adaptation [Citation19,Citation21]. Expression of PLK1 is tightly regulated because its aberrant expression causes aneuploidy and mitotic defects, which lead to tumorigenesis [Citation20]. Indeed, PLK1 is overexpressed in various types of human cancers and is associated with poor prognoses [Citation22,Citation23]. Thus, inhibitors of PLK1 kinase activity are expected to be useful for cancer therapy [Citation24]. PLK1 phosphorylates T379 of Kizuna (Kiz) at the centrosome, and this is essential for Kiz to maintain spindle pole integrity; depletion of Kiz causes fragmentation and dissociation of pericentriolar material from centrioles at prometaphase [Citation25]. Kiz associates with the centrosomal protein Cep72; Cep72-mediated MT organization controls chromosome alignment and generation of tension between kinetochores during mitosis [Citation26]. Phosphorylation of Kiz depends on a balance between the activities of PLK1 and CDC25B, a dual-specificity phosphatase [Citation27]. Unlike other substrates of PLK1 [Citation18,Citation28], the detailed function of Kiz in relation to PLK1 remains elusive.
Cyclin G-associated kinase (GAK), an association partner of CHC, not only regulates clathrin-mediated membrane trafficking [Citation29,Citation30], but also controls centrosome maturation and chromosome congression during mitosis [Citation31]. Depletion of GAK causes centrosome instability and generates protruded, misaligned, or abnormally condensed chromosomes, which leads to metaphase arrest [Citation31,Citation32]. These phenotypes are more severe than those of CHC-depleted cells [Citation2,Citation31]. By contrast, analysis of cells following silencing of OIP-AS1, a long noncoding RNA that reduces GAK mRNA stability and the GAK protein level, suggested that an untimely increase in the GAK level also causes the formation of monopolar, multipolar, and misaligned mitotic spindles [Citation33]. Indeed, GAK is modified and overexpressed in various cancer cell lines [Citation34]. Overexpression of GAK in osteosarcoma is associated with poor prognosis, and siRNA-mediated knockdown of GAK decreases the proliferation of osteosarcoma cells [Citation35]. The intensity of GAK immunostaining in surgical specimens positively correlates with the severity of prostate cancer [Citation34]. These results suggest that control of GAK during the cell cycle is important for the regulation of cell proliferation. However, the underlying molecular mechanism remains largely unknown.
In the present study, we show that GAK phosphorylates CHC at T606 in vitro and this is required for proper cell and tumor growth rates. Immunofluorescence (IF) analysis showed that CHC-pT606 signals were localized in the nucleus and at the centrosome during interphase, whereas non-phosphorylated CHC signals were mostly cytoplasmic. During mitosis, CHC-pT606 signals at the centrosome did not co-localize with CHC signals around asters. Depletion of GAK using siRNA caused metaphase arrest and aberrant localization of CHC-pT606, which abolished Kiz-pT379 signals on chromatin at metaphase. CHC-pT606, PLK1, and Kiz formed a complex and co-localized at the centrosome during M phase. Taken together, we propose that the GAK_CHC-pT606_PLK1_Kiz-pT379 axis plays a role in cell growth.
Results
GAK phosphorylates CHC at T606 in vitro
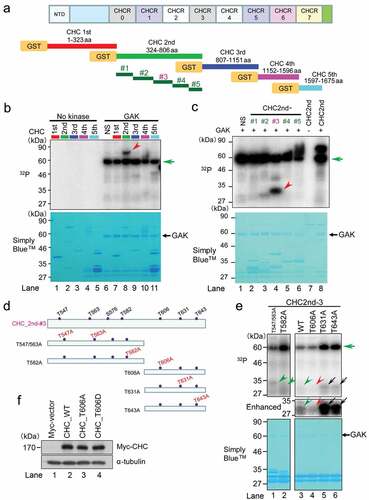
We previously reported that GAK associates with CHC both in vitro and in vivo[Citation36]. To examine the physiological role of this association, we tested if GAK phosphorylates CHC in vitro. We dissected CHC into five fragments and prepared affinity purified GST-tagged proteins (). In vitro kinase assays using GAK as a protein kinase and these proteins as substrates demonstrated that GAK phosphorylated the second fragment of CHC (red arrowhead in ). We divided this fragment into five parts and found that part #3 was clearly phosphorylated (red arrowhead in ) and part #2 was slightly phosphorylated (, lane 3). Because GAK mainly phosphorylated part #3 and preferentially phosphorylates threonine (T), we prepared five affinity purified GST-tagged mutant proteins in which the indicated T residue of part #3 was replaced by alanine (A) () to abolish phosphorylation at these sites (T547A, T563A, T582A, T606A, T631A, and T643A). The phosphorylated bands of the T631A and T643A mutant proteins were strong (black arrows), whereas those of the T547A/T563A and T582A mutant proteins were weak (green arrowheads) (). This is because that the reduction of autophosphorylated GAK, which shows a reduction in the kinase activity of GAK, occurred in WT, T606A, and T547/563A but not in T631A and T643A (green arrow). It is probable that the kinase activity of GAK was attenuated by extra-protein contamination from bacteria in the process of purifying GST-fused substrate proteins (WT, T606A, and T547/563A). Indeed, in Simply Blue staining gels, extra bands with high molecular weight (70 ~ 80 kDa) were found only in lanes 1, 3, and 4 of . By contrast to WT, the phosphorylated band of the T606A mutant protein was barely detectable (red arrowhead in ), although it may also be partly influenced by an extra-protein contamination. Taken together, these results suggest that GAK phosphorylates CHC at multiple sites, including T606 in part #3 and any sites in part #2. Because the part #3 was predominantly phosphorylated by GAK, which was more clearly diminished by T606A mutation compared with other mutations, we focused on the phosphorylation of T606 on CHC.
Figure 1. GAK phosphorylates CHC in vitro. (A) A schematic representation of GST-tagged CHC divided into five fragments and relevant amino acid numbers. NTD, N-terminal domain. CHCR, clathrin heavy-chain repeat. Five fragments divided from CHC 2nd fragment was also shown. (B) GAK phosphorylates the second CHC fragment, as detected by in vitro kinase assays. A radio-autograph of the SDS-PAGE gel after in vitro kinase assays using the indicated fragments (top panel) shows a strong band only with the second CHC fragment (red arrowhead). The green arrow indicates the band corresponding to auto-phosphorylated GAK. CBB staining (bottom panel) of the same SDS-PAGE gel to show the presence of the band at the same location. (C) GAK phosphorylates part #3 of the second CHC fragment, as detected by in vitro kinase assays. A radio-autograph of the SDS-PAGE gel after in vitro kinase assays using the indicated fragments (top panel) shows a strong band only with part #3 of the second CHC fragment (red arrowhead). The green arrow indicates the band corresponding to auto-phosphorylated GAK. CBB staining (bottom panel) of the same SDS-PAGE gel to show the presence of the band at the same location. (D) A schematic representation of part #3 of the second CHC fragment, in which the indicated T residue was replaced by A (red font). (E) A radio-autograph (top) and CBB staining (bottom) of the SDS-PAGE gel after in vitro kinase assays with GAK using WT fragment (167 amino acids) and the five regions (see Figure 1D) of part #3 of the second CHC fragment. Black arrows, green arrowheads and red arrowhead, indicate strongly phosphorylated, weakly phosphorylated and non-phosphorylated bands, respectively. A middle panel shows a part (27–35 kDa) of the enhanced image of radio-autograph. (F) Wb to demonstrate the successful construction of Tet-ON HeLa S3 cells expressing Myc-vector, Myc-CHC_WT, Myc-CHC_T606A, or Myc-CHC_T606D. α-tubulin was detected as a loading control.
To investigate the biological effects of CHC-T606 phosphorylation, we generated Tet-ON inducible HeLa S3 cell lines that, in response to doxycycline (Dox), expressed a non-phosphorylatable or phospho-mimetic (constitutively phosphorylated) mutant CHC protein in which the T606 residue was replaced by A or glutamic acid (D), respectively. Western blot (Wb) analysis of protein extracts purified from HeLa S3 cells expressing Myc-vector, Myc-CHC_WT, Myc-CHC_T606A, or Myc-CHC_T606D indicated the successful construction of these cell lines ().
Phosphorylation at CHC-T606 is required for proper cell growth rates
To examine if phosphorylation at CHC-T606 influences cell growth, we compared the growth rates of these Tet-ON inducible HeLa S3 cells. HeLa S3 cells expressing Myc-CHC_WT or Myc-CHC_T606D grew significantly faster than HeLa S3 cells expressing Myc or Myc-CHC_T606A in the presence of Dox (), suggesting that phosphorylation at CHC-T606 is required for proper cell growth rates at the level of tissue culture cells.
Figure 2. Phosphorylation of CHC-T606 is required for proper cell growth rates. (A) The growth rates of HeLa S3 cells expressing Myc-vector or Myc-CHC_T606A were slower than those of cells expressing Myc-CHC_WT or Myc-CHC_T606D in the presence of Dox (+). (B) HeLa S3 cells expressing Myc-CHC_T606A or Myc-CHC_WT were subcutaneously implanted into the lateral back of nude mice. The line graph shows the tumor volume measured using a caliper square at the indicated date. Dox was intraperitoneally administered at the indicated timings (red arrows). (C) Typical images of mice harboring tumors in the lateral back at the indicated date.
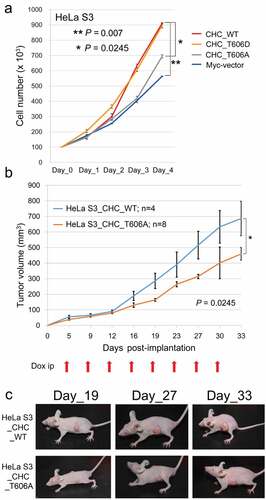
To determine if phosphorylation at CHC-T606 also affects cell growth rates in mice, we subcutaneously transplanted HeLa S3 cells expressing Myc-CHC_WT or Myc-CHC_T606A into the lateral back of nude mice and monitored tumor growth when Dox was intraperitoneally administered at the indicated timings (red arrows in ). Tumor growth was significantly slower in mice implanted with CHC_T606A-expressing cells than in mice implanted with CHC_WT-expressing cells (). Typical mice harboring these tumors are shown in . These results suggest that phosphorylation at CHC-T606 is required for proper cell growth rates.
CHC-pT606 localizes at the centrosome during mitosis
To elucidate why phosphorylation of CHC-T606 influences the cell growth rate, we first examined its subcellular localization during the cell cycle. For this purpose, we generated an anti-CHC-pT606 antibody (Ab) and confirmed that it specifically recognized the phosphopeptide (CILGNQMF[pT]HYDRAH), which was used as an antigen and for affinity purification, but not the non-phosphopeptide (CILGNQMFTHYDRAH), which was used for affinity purification alone, by performing a peptide competition assay (Fig. S1A, S1B).
IF showed that CHC-pT606 signals localized in the nucleus and centrosome (Fig. S1B, yellow arrowhead; see also , ) when the non-phosphopeptide was present in the IF mixture (Fig. S1B-i). By contrast, these nuclear and centrosome signals, but not α-tubulin or γ-tubulin signals, almost disappeared in the presence of the phosphopeptide (Fig. S1B-ii), which is clearly shown in the enhanced images of these panels (Fig. S1B-iii). These results further confirm the specificity of this Ab to the CHC molecules phosphorylated at T606.
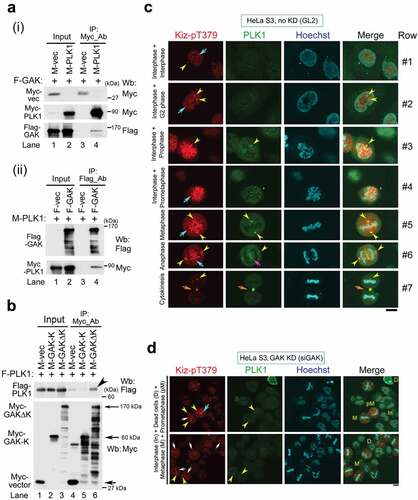
Figure 3. CHC-pT606 signals are observed in the nucleus during interphase and at the centrosome during M phase. (A) Subcellular localizations of CHC-pT606 and CHC during the cell cycle. IF analysis of HeLa S3 cells was performed using an anti-CHC-pT606 polyclonal Ab and an anti-CHC monoclonal Ab. Typical IF images at interphase and M phase are shown at different stages of the cell cycle. Contrast-enhanced images of CHC-pT606 and CHC signals are also shown in the rightmost panels. Yellow arrowheads and red arrows indicate the putative localizations of these signals at the centrosome and mitotic spindle, respectively. White arrows at metaphase indicate the localization of CHC-pT606 signals at mitotic spindle. (B) Co-localization of CHC-pT606 with γ-tubulin suggests that it localized at the centrosome. (C) Co-localization of CHC-pT606 with a part of CHC at the centrosomes in mitotic HeLa S3 cells fixed with formaldehyde (FA) and methanol (MeOH). DNA was counter-stained with Hoechst33258 to detect chromatin. (D) High-magnification images of the cells shown in C highlight the partial co-localizations of CHC-pT606 and CHC (white arrows) at asters during metaphase. (E) Enlarged images show that CHC-pT606 (white arrowheads) and CHC (pink arrowheads) signals co-localize primarily at the tips of mitotic spindle MTs. (F–H) Typical IF images of cells during interphase and M phase following siRNA-mediated knockdown using siGL2 (F, top panel in H) or siCHC (G, bottom panel in H). DNA was counter-stained with Hoechst33258 to detect chromatin. Yellow arrowheads indicate localization at the centrosome. Bars, 10 µm.
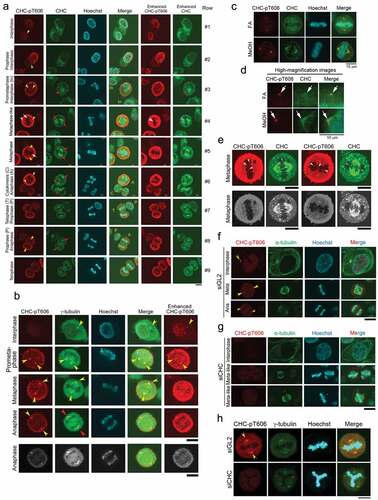
Simultaneous IF analysis using anti-CHC-pT606 and anti-CHC Abs indicated that CHC-pT606 signals localized in the nucleus during interphase, whereas CHC signals by staining with anti-CHC Ab were mostly cytoplasmic (Row #1 of ). Notably, a dot appeared at the periphery of the nucleus at interphase (yellow arrowhead in Row #1); this dot was localized at the centrosome because it co-localized with γ-tubulin, a centrosome marker (yellow arrowheads in ). At prophase, CHC-pT606 signals localized at granule-like structures at the nuclear membrane and near the condensed chromatin dots (Row #2 of ). At metaphase (Row #4, 5), both anti-CHC-pT606 and anti-CHC Abs recognized centrosome (yellow arrowheads) and mitotic spindle, either weakly (white arrows) or strongly (red arrows). Notably, the anti-CHC-pT606 Ab strongly labeled granules in some areas, which was distinct from the strong signals of CHC in the cytoplasm (Row #2) and at the mitotic spindle during M phase (red arrows in Rows #3–8). The cell membrane signal detected by anti-CHC-pT606 Ab started to become intense at prometaphase, remarkably increased from metaphase to anaphase (Rows #3–6), and gradually disappeared at telophase and cytokinesis (Rows #6–9), whereas the intensity of the centrosome signals (yellow arrowheads) remained almost constant (leftmost panels of ). The centrosomal localization of CHC-pT606 was confirmed by two different fixation protocols, including 4% formaldehyde (FA) and 100% methanol (MeOH) after treating cells with the microtubule-stabilizing buffer (, red). Notably, the signal to noise ratio of CHC on the mitotic spindles (including spindle poles) was increased in MeOH-fixed cells as compared with FA-fixed cells (, green). Enlarged images at metaphase revealed that CHC signals detected around asters partly co-localized with CHC-pT606 signals at the centrosome (white arrows in ), suggesting that phosphorylated CHC colocalizes with a part of CHC signals detected with anti-CHC Ab at the centrosome. To confirm the centrosomal localization of CHC-pT606 during mitosis, we attempted to examine the subcellular localization of GFP-tagged CHC mutants (non-phosphorylatable T606A and phospho-mimetic T606D) in synchronized HeLa S3 cells. IF analysis revealed that, during prophase, GFP-tagged CHC-T606D signals were concentrated at one or two asters (matured centrosomes) staining with α-tubulin antibody (Fig. S1C, bottom panels, yellow arrowheads), whereas CHC-T606A signals were dispersed in the proximity of the nucleus (Fig. S1C, top and second panels, white arrowheads). However, neither GFP-tagged CHC-T606A nor T606D were colocalized with centrosomal signals staining with γ-tubulin antibody (Fig. S1D). Unexpectedly, during metaphase, CHC-T606A and T606D were localized both at mitotic spindle and spindle poles (Fig. S1E). Interestingly, we also found that the mitotic localization of T606D at spindles persisted during cytokinesis (Fig. S1F, bottom panels, pink arrows), whereas T606A was mainly localized at microtubule bundles of the intercellular bridge (Fig. S1F, top panels, yellow arrows). However, the signals of CHC-T606D in cytokinesis did not colocalize with γ-tubulin signals. Therefore, we could not demonstrate that overexpressed GFP-tagged CHC-T606D mutant preferentially localize to the centrosomes in mitotic cells. Moreover, enlarged images also revealed that some CHC-pT606 signals were detected at the tips of MTs (white arrowheads of ), which co-localized at least partly with CHC signals on the mitotic spindle (pink arrowheads in ). Taken together, these results suggest that only a small fraction of CHC is phosphorylated at T606 and that this phosphorylated protein plays novel important roles in proper M phase progression by localizing at chromatin, the centrosome, the cell membrane, and the plus ends of MTs. We confirmed that the centrosome signals primarily detected by anti-CHC-pT606 antibody during M-phase (yellow arrowheads in ) are actually due to endogenous CHC-pT606, by performing siRNA-mediated knockdown using siGL2 as a negative control () or siCHC (). Indeed, we found that these centrosome signals detected in siGL2-treated cells (yellow arrowheads in , ) disappeared in siCHC-treated cells (, ), suggesting that the centrosome signals detected by anti-CHC-pT606 antibody are due to endogenous CHC-pT606 on the centrosomes.
Cell cycle arrest induced by siRNA-mediated knockdown of GAK causes aberrant localization of CHC-pT606
Next, to examine the role of the GAK_CHC-pT606 axis, we performed siRNA-mediated knockdown experiments. Wb analysis confirmed that knockdown of GAK by siRNA (siGAK = Ki9) [Citation31] greatly reduced the protein level of GAK (arrows in , lane 2) compared with that in siGL2 (negative control), whereas the CHC protein level was almost unaltered (, top and second panels, lane 2). When we performed Wb analysis of CHC-pT606 using asynchronous cells with siGAK (48 hrs after siRNA transfection), the predicted pT606 bands were not decreased in GAK-knockdown cells despite further increasing the amount of GAK siRNAs under two different experimental conditions (Fig. S2A): CHC-pT606 antibody was diluted with Can Get SignalTM solution (Experiment #1) and 0.5% skim milk in TBS-T (Experiment #2). These results suggest that CHC-pT606 antibody is not suitable to detect pT606 of CHC protein at least by Wb analysis. Because we could not examine by Wb analysis whether the CHC-pT606 level is reduced by siGAK-mediated GAK knockdown, we examined the CHC-pT606 level in GAK-knockdown cells by IF analysis. First, IF showed that M phase progression was perturbed in the cells in which siGAK-mediated GAK knockdown was successful (denoted by turquoise arrowheads in ), and most of these cells were arrested at metaphase, which was accompanied with misaligned chromosomes (pink arrowheads in ). Next, centrosome signals detected by anti-CHC-pT606 Ab were disappeared or decreased in these cells (-ii, 4C, 4D, S2B), further confirming the specificity of this antibody to CHC-pT606 molecules. Accordingly, the population of cells at M phase was greatly increased after siGAK treatment (bar highlighted by a purple arrow in ). Indeed, compared with siGL2-treated cells (Fig. S2C, S2E), IF also revealed unusually condensed chromatin (Hoechst panels of Fig. S2D, S2F), an abnormal number of centrosomes (CHC-pT606 and γ-tubulin panels of Fig. S2D, S2F) as we reported previously (the percentage of cells with abnormal chromosomes was approximately 75% and 20% in siGAK-treated and siGL2-treated cells, respectively)[Citation31], and disturbed localization of CHC on MTs (CHC panels of Fig. S2F) at metaphase in siGAK-treated cells. These results suggest that GAK plays a pivotal role as a protein kinase of CHC-T606.
Figure 4. siRNA-mediated knockdown of GAK perturbs the localization of CHC-pT606.
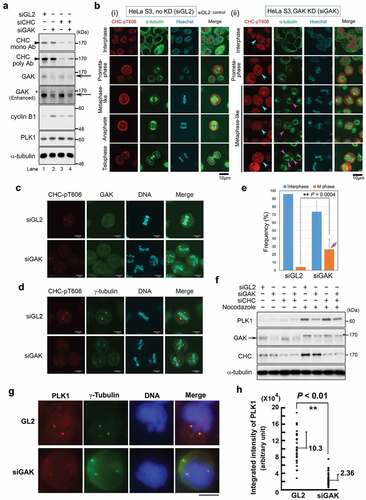
PLK1 plays an essential role in centrosome maturation, spindle assembly, and MT-kinetochore attachment, which is associated with increased levels of the protein during G2/M phase[Citation16]. Because CHC-pT606 were co-localized with GAK at the centrosomes (, ), we focused on the relationship between GAK-CHC axis and PLK1 during mitosis. When CHC was knocked down using siCHC (), the protein level of PLK1, which functions during G2/M phase, was slightly increased (lane 3 of , sixth panel from top). By contrast, the PLK1 levels were not apparently changed by treatment with siGAK (lane 2 of ), even if the amount of GAK siRNAs was increased (Fig. S2A). The protein level of cyclin B1, which is required for cells to progress into and exit M phase, was increased by treatment with siGAK (lane 2 in , fifth panel from top) or double siRNAs of siGAK and siCHC (lane 4 in ), but not by treatment with siCHC (lane 3 of ). This increased level of cyclin B1 is probably a secondary effect following arrest of the cell cycle at metaphase by siGAK. These results suggest that the protein level of PLK1, unlike cyclin B1, was not increased by GAK knockdown, although the population of mitotic cells were reliably increased in these cells. To further confirm this, siGAK-mediated and/or siCHC-mediated knockdown cells were treated with nocodazole, which arrests the cell cycle at prometaphase by inhibiting MT polymerization. Wb analysis revealed that expression level of PLK1 was markedly increased by treating with nocodazole in negative control (siGL2) and siCHC-single knockdown cells but not in siGAK single knockdown and siGAK/siCHC-double knockdown cells, suggesting that GAK knockdown prevented the upregulation of PLK1 during M phase (). Consistent with our previous report [Citation37], the band of GAK in the lysates of nocodazole-treated cells migrated slowly in the gel, probably due to phosphorylation ( and S2G, asterisks in second panels). Thus, it is likely that the upregulation of PLK1 during M phase was suppressed by GAK knockdown. Notably, the PLK1 level in non-transfected HeLa S3 cells was apparently increased in the presence of nocodazole (Fig. S2G, top panel). Then, the PLK1 protein level gradually decreased and the protein was almost undetectable after treatment with CHX for 4 h (Fig. S2H), suggesting that protein level of PLK1 is abundant in M phase but at the same time turnover is fast. These results indicate that GAK may promote upregulation of PLK1 in collaboration with CHC during mitosis, suggesting that GAK and PLK1 somehow interact each other.
To determine where in the cell the regulation in PLK1 protein level takes place, we performed immunostaining using anti-PLK1 antibody. Since PLK1 localizes to the centrosome and kinetochore, we first examined the difference in intensity of the fluorescent signals at the centrosomes between GL2- and siGAK-treated cells and found that the PLK1 protein level was reduced in this region of siGAK-treated cells (). We measured the integrated PLK1 intensity and found that there was a difference between GL2- and siGAK cells (). This result also encouraged us to study about the phosphorylation of Kiz, because phosphorylation of Kiz by PLK1 is important for maintaining centrosome structure during mitosis[Citation25].
CHC-pT606, PLK1, Aurora A, and Kiz co-localize at the centrosome during M phase
To examine the possible interactions between GAK, CHC, and PLK1, we first compared their IF staining patterns. Because GAK [Citation37,Citation38] and CHC-pT606 () co-localize with the centrosome marker γ-tubulin, we investigated if CHC-pT606 also co-localizes with other centrosomal proteins such as PLK1 and Aurora A during M phase. CHC-pT606 and PLK1 signals were both detected at the centrosome (yellow arrowheads in Fig. S3A, S3D-i), central spindle (green arrow), and midbody (pink arrowhead) during prophase, metaphase, anaphase, and telophase. Moreover, CHC-pT606 and Aurora A signals were both detected at the centrosome (yellow arrowheads in Fig. S3B, S3D-ii) and midbody (pink arrowheads) during metaphase, anaphase, and telophase. Images of the co-localization of CHC-pT606 with α-tubulin are provided to demonstrate M phase progression as a positive control (Fig. S3C).
We next examined if GAK associates with PLK1 by performing co-immunoprecipitation (Co-IP) assays. We previously reported that GAK and CHC directly associate[Citation36]. Flag-GAK and Myc-PLK1 associated with each other in vivo (). Dissection of GAK into two parts followed by Co-IP indicated that PLK1 associated with the non-kinase (∆K) portion (170 kDa) of GAK (arrowhead in ). However, we could not examine whether endogenous GAK and PLK1 proteins interacts with CHC-pT606 in vivo because the pT606 antibody was unavailable for immunoprecipitation and Wb assays. However, since Kiz is a potential substrate of PLK1, these results suggest a possibility that a GAK_CHC_PLK1_Kiz complex exists, although further study is needed to confirm the existence of one or multiple GAK protein complexes in vivo.
Figure 5. GAK, CHC, PLK1, and Kiz form a complex during M phase. (A) Co-IP showing the association of Myc-PLK1 and Flag-GAK. An anti-Myc Ab (i) or an anti-Flag Ab (ii) was used for immunoprecipitation. (B) Co-IP showing the association of Flag-PLK1 with Myc-GAKΔK (full-length GAK without the kinase domain, 170 kDa), but not with Myc-GAK-K (kinase domain alone, 60 kDa). The arrowhead indicates a band reflecting the preferential association of Flag-PLK1 with Myc-GAKΔK. Arrows indicate the bands corresponding to Myc-GAKΔK, Myc-GAK-K, and Myc. (C, D) Subcellular localizations of Kiz-pT379 and PLK1 in HeLa S3 cells at interphase and during M phase after siRNA-mediated knockdown (KD) using siGL2 (C) or siGAK (Ki9) (D). Yellow arrowheads indicate the centrosome. Turquoise, pink, and orange arrows indicate chromatin, the central region of the spindle, and the midbody, respectively. DNA was counter-stained with Hoechst33258 to detect chromatin. Bars, 10 µm.
Because an Ab against Kiz-pT379 (a phosphorylation target site of PLK1) was not commercially available, we prepared anti-Kiz-pT379 Ab using a phosphorylated peptide (STSSDL[pT]ISISEDD) from the middle region of Kiz and anti-Kiz Ab using GST-tagged C terminal region of Kiz (Fig. S4A, S4B). To confirm the specificity of the anti-Kiz Ab, we performed Wb assay using the GST-fusion protein and found that the Ab recognized a band of the expected size, which was also detected by an anti-GST Ab (Fig. S4C). Wb using extracts of HEK-293T cells expressing Myc-vector or Myc-Kiz (C-terminus) also showed that this Ab recognized a Kiz-specific band of the expected size, which was also recognized by an anti-Myc Ab (Fig. S4D). Knockdown of Kiz abolished this band, while it was retained in siGL2-treated HEK-293T cells (Fig. S4E). We also confirmed the specificity of the anti-Kiz-pT379 Ab by a dot blot analysis using phosphorylated and non-phosphorylated peptides (Fig. S4F). In IF, Kiz-pT379 signals were weakly observed at the centrosome (turquoise arrow) and at several dots in the nucleus during interphase, but exclusively at the centrosome (turquoise arrow) during metaphase, as judged by the localization of γ-tubulin (Fig. S4G). This centrosomal localization was specific to Kiz-pT379, as judged by a peptide competition assay (Fig. S4H). Kiz signals were observed exclusively at the centrosome in both interphase and metaphase (Fig. S4I). Thus, GAK, CHC-pT606, PLK1, Kiz, and Kiz-pT379 co-localize at the centrosome during M phase.
The GAK_CHC-pT606_PLK1_Kiz-pT379 axis regulates the accumulation of Kiz-pT379 on chromatin at metaphase
We next examined the effect of GAK knockdown on the subcellular localizations of these proteins. In HeLa S3 cells treated with negative control siGL2, Kiz-pT379 signals were faintly observed throughout the nucleus, a single dot was detected during interphase (turquoise arrow and yellow arrowhead in the top panel of ), and then two dots appeared at the centrosome during G2 phase (Row #2). At prophase, the Kiz-pT379 signals in the nucleus were aggregated and surrounded by chromatin (Hoechst), providing a scaffold for chromatin to condense (Row #3). The Kiz-pT379 signals partially moved to chromatin, where they co-localized with PLK1, as judged by the yellowish overlaid color that prevailed at this phase (Row #4). At metaphase, strong Kiz-pT379 signals were detected on chromatin at the metaphase plate, which at least partly co-localized with PLK1, as evidenced by the yellowish co-localized signals (turquoise arrow in Row #5 of ). At anaphase, unlike PLK1 signals, which were detected at both the centrosome and central spindle, Kiz-pT379 signals were observed at the centrosome alone (Row #6). Most Kiz-pT379 signals appeared at the midbody at cytokinesis (orange arrows in Row #7 of ).
However, these Kiz-pT379 signals on chromatin almost disappeared at metaphase after siGAK treatment (white arrows in ), although they were retained at prometaphase (turquoise arrow in ). By contrast, Kiz-pT379 and PLK1 signals were retained at the centrosome even after siGAK treatment (yellow arrowheads in ). IF analysis using anti-Kiz-pT379 and anti-GAK (9–13) Abs confirmed this difference in Kiz-pT379 signals between cells treated with siGL2 and those treated with siGAK (Fig. S5). These results suggest that the GAK_CHC-pT606_PLK1_Kiz-pT379 axis regulates the accumulation of Kiz-pT379 on chromatin at metaphase.
Overexpression of the CHC-T606D mutant protein hampers the localization of Kiz-pT379 on chromatin at metaphase
To examine the effect of CHC-T606 mutations, we performed Co-IP using extracts of Tet-ON inducible HeLa S3 cells expressing Myc-vector, Myc-CHC_WT, Myc-CHC_T606A, or Myc-CHC_T606D. The association levels of PLK1, GAK, and TACC3 (blue arrows) were almost equal between the CHC mutants and WT protein (Fig. S6). We did not detect association of CHC with Aurora A or γ-tubulin (Fig. S6).
Because the anti-Kiz-pT379 Ab was useful to detect endogenous Kiz-pT379 protein by IF (Fig. S4G), we examined its subcellular localization during M phase in these Tet-ON inducible HeLa S3 cells. Endogenous Kiz-pT379 signals were similarly detected at the centrosome in all these cells (yellow arrowheads in ). The centrosomal localization of PLK1 was also unaltered in these cells (). By contrast, endogenous Kiz-pT379 signals on chromatin were undetectable in Myc-CHC_T606D-expressing cells (white arrows in ), although they were detected on chromatin in cells expressing Myc-vector, Myc-CHC_WT, or Myc-CHC_T606A (turquoise arrows in ). When we examined the mitotic localization of exogenous Myc-CHC_WT, -CHC_T606A, and -CHC _T606D by staining these cell lines with anti-Myc antibody, we confirmed that these exogenous proteins localized at the mitotic spindle during metaphase (). Notably, Myc-CHC_T606D accumulated in the vicinity of the centrosomes during prophase, but which was not identical to the location of γ-tubulin signals (yellow arrowheads in ). Similarly to GFP-tagged CHC_T606D (Fig. S1D), exogenous Myc-CHC_T606D was not localized at the centrosomes. These results suggest that exogenous GFP-tagged or Myc-tagged CHC_T606D protein may need other factor(s) to localize at the centrosomes. Moreover, because these exogenous proteins were not localized at chromatin during metaphase (), the possibility that endogenous Kiz-pT379 protein on chromatin was competitively replaced by a large amount of exogenously expressed Myc-CHC_T606D protein can be rule out.
Figure 6. The localization of Kiz-pT379 on chromatin at metaphase is perturbed in HeLa S3 cells expressing Myc-CHC_T606D. (A, B, C) Typical IF images of Tet-ON inducible HeLa S3 cells expressing Myc-vector, Myc-CHC_WT, Myc-CHC_T606A, or Myc-CHC_T606D at interphase and during M phase. Cells were labeled with anti-Kiz-pT379 (A), anti-γ-tubulin (A, C), anti-PLK1 (B), and anti-Myc (C) Abs. DNA was counter-stained with Hoechst33258 to detect chromatin. Yellow arrowheads, turquoise arrows, and orange arrows indicate Kiz-pT379 signals at the centrosome, chromatin, and midbody, respectively. Pink arrows indicate co-localized Kiz-pT379 and chromatin signals. White arrows in Myc-CHC_T606D-expressing cells indicate the absence of Kiz-pT379. Scale bars, 10 µm. (D) Representative images of Kiz-pT379 immunofluorescence in GL2- and siGAK-treated cells. The scattered γ-tubulin foci (more than two) were merged with the Kiz-pT379 foci (white arrowheads). Scale bars, 10 µm. (E) Comparison of Kiz-pT379 signal intensity at the centrosome of GL2- and siGAK-treated cells using Metaview software. Integrated intensities of GL2-treated Kiz-pT379 dot foci (n = 50) and siGAK-treated Kiz-pT379 dot foci (n = 210) were scored. The dot graphs in (E) show the average + SE values of these measurements. All measurements are statistically significant when GL2 and siGAK are compared (P < 0.01).
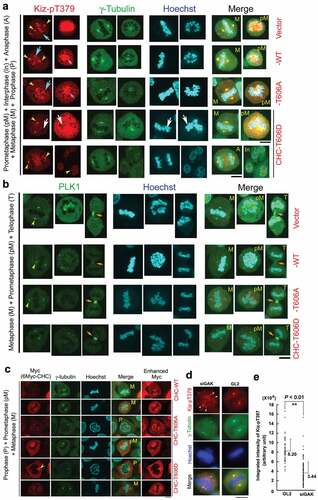
IF also revealed that that the intensity of Kiz-pT379 signal at the centrosome, because it colocalized with γ-tubulin foci, was low and scattered in siGAK-treated cells, while the signal was strong in GL2-treated cells (). Notably, the intensity of integrated Kiz-pT379 signal was lower in siGAK-treated cells than in GL2-treated cells (), indicating that the phosphorylation level of Kiz is reduced in siGAK-treated cells, which causes fragmentation of the components of pericentriolar material, such as γ-tubulin and PLK1. These results further confirm that the GAK_CHC-pT606_PLK1_Kiz-pT379 axis promotes the accumulation of Kiz-pT379 on chromatin at metaphase.
Finally, we examined the cell cycle profiles of HeLa S3 cells inducibly expressing Myc-CHC mutants by flow cytometry (FC) analysis (Fig. S7A–S7D). FC analysis showed that a slight increased S phase population and a slight reduced G1 phase population in HeLa S3 cells expressing Myc-CHC_WT, -CHC_T606A, and -CHC_T606D as compared with cells expressing Myc-empty vector before releasing from thymidine-double block (0 hr), suggesting overexpression of Myc-CHC had a small effect on cell cycle arrest at G1/S boundary induced by adding a large excess of thymidine and releasing from S phase arrest, or S phase progression during the process of synchronization by thymidine-double block method, which is independent of phosphorylation on T606 (Fig. S7B). Interestingly, FC analysis also showed an increased G1 phase population and a reduced G2/M phase population in HeLa S3 cells expressing Myc-CHC_T606D as compared with cells expressing Myc-CHC_WT and -CHC_T606A at 6 hrs after thymidine-double block and release (TDBR) treatment in the presence of Dox (red arrows in Fig. S7C). However, the difference between CHC_T606D and CHC_WT or CHC_T606A in G2/M phase population at 6 hours was disappeared at 12 hours (Fig. S7D), suggesting that the phosphorylation of CHC-T606 had no effect on the transition from late M phase to the next G1 phase. Indeed, it seems that the difference in G2/M phase at 6 hours was reflected in difference of G1 phase population at 12 hours. These results suggest that the expression of CHC-T606D causes severe defects in cell cycle progression, especially during G1 and/or G2/M phases, although it seems that ectopic overexpression of Myc-CHC_WT, as well as CHC_T606A and CHC_T606D, had a slight influence on the progression of S phase. Furthermore, FC analysis showed an increased sub-G1 phase population, a marker of cell death, in HeLa S3 cells expressing Myc-CHC_T606A compared with cells expressing Myc-CHC_WT and -CHC_T606D (Fig. S7E), which may support the idea that growth of CHC_T606A-expressing cells was delayed (). Therefore, these results suggest that the cell count data can be more directly correlated with the frequency of cell death rather than the cell cycle disorder.
Discussion
In the present study, we showed that GAK phosphorylates CHC at T606 in vitro (). We generated Tet-ON inducible HeLa S3 cell lines and showed that cells expressing Myc-CHC_WT or Myc-CHC_T606D grew significantly faster than cells expressing Myc or Myc-CHC_T606A in the presence of Dox (). Moreover, tumor growth was significantly slower in mice implanted with CHC_T606A-expressing cells than in mice implanted with CHC_WT-expressing cells (, ). FC analysis also revealed that the overexpression of Myc-CHC_T606D causes defects in cell cycle progression during G1 and/or G2/M phases, whereas that of Myc-CHC_T606A promotes cell death (Fig. S7). These results suggest that phosphorylation of CHC-T606 is required for proper cell growth rates and cell proliferation. Simultaneous IF analysis using anti-CHC-pT606 and anti-CHC Abs indicated that CHC-pT606 signals were localized in the nucleus during interphase, while most non-phosphorylated CHC signals were cytoplasmic (). Moreover, CHC-pT606 signals were observed at the centrosome during M phase (, ), whereas CHC signals were primarily detected on MTs during this phase (, –). Interestingly, CHC-pT606 and CHC signals co-localized at metaphase; both were observed at the tips of MTs (). siRNA-mediated knockdown of GAK arrested the cell cycle at metaphase and reduced the level of CHC-pT606, suggesting that GAK plays a pivotal role as a protein kinase of CHC-T606 (). IF and Co-IP analyses demonstrated that GAK interacts with CHC, PLK1, and Kiz and co-localized at the centrosome and partly on chromatin during M phase (, ). Moreover, the GAK_CHC-pT606_PLK1_Kiz-pT379 axis might regulate the accumulation of Kiz-pT379 on chromatin at metaphase ().
In human cancer cells, the membrane trafficking and mitotic functions of clathrin and GAK appear to be independent [Citation37,Citation39]. Clathrin also plays a critical role in centrosome positioning by promoting acto-myosin cortical tension in Caenorhabditis elegans embryos [Citation40]. CHC specifically associates with phosphorylated TACC3 and recruits it to spindle poles for proper spindle assembly and chromosome alignment in Xenopus [Citation41]. CHC-pT606 and GAK signals move from chromatin to the centrosome () [Citation37] when the cell enters mitosis and membrane trafficking is inhibited [Citation39,Citation42], suggesting that the GAK_CHC-pT606 axis plays a role during mitosis. Because the association levels between TACC3 and CHC-pT606 mutant proteins were similar (Fig. S6B) and the subcellular localizations of CHC-pT606 and CHC around asters were distinct; however, a part of CHC signals colocalized with CHC-pT606 signals at the centrosome (, ), the GAK_CHC-pT606 axis appears to be almost independent of the TACC3_ch-TOG_CHC complex. Notably, CME is inhibited whereas clathrin-independent endocytosis is enhanced during mitosis [Citation43]. GAK is phosphorylated by c-Src at Y412 and Y1149, and the band shift of GAK due to phosphorylation occurs primarily during M phase, indicative of a moonlighting function[Citation37]. GAK-pY412/pY1149 signals are detected in the nucleus during interphase, move to chromatin at prophase, and accumulate on the centrosome at metaphase and on MTs at anaphase [Citation37]; this movement is similar to that of CHC-pT606 signals (). Interestingly, we also found that CHC-T606A, but not T606D, was localized at microtubule bundles of the intercellular bridge during late telophase/cytokinesis (Fig. S1F), suggesting that the phosphorylation of T606 may prevent the localization of CHC to the microtubule bundles for completion of abscission during cytokinesis [Citation44], although we could not find severe defects in M/G1 phase transition at least by FC analysis (Fig. S7C, S7D). GAK is overexpressed during the progression of prostate cancer to androgen independence [Citation45], in U2OS osteosarcoma cells [Citation35], and in surgical specimens from prostate cancer patients [Citation34]. Two different gene fusions involving CHC have been described in human cancers [Citation39]. These results suggest that the evolutionarily conserved moonlighting function of CHC and GAK is a potential diagnostic and therapeutic target in cancer.
Kiz is essential for bipolar spindle formation due to its stabilization of the pericentriolar matrix of the centrosome, the major site of MT nucleation, which is crucial for faithful chromosome segregation at mitosis [Citation25,Citation26]. Kiz-T379 is a key phosphorylation substrate of PLK1 at centrosomes, and inhibition of PLK1 induces centrosomal fragmentation [Citation46]. GAK, CHC, and PLK1 formed a complex (, S6), and GAK, CHC-pT606, PLK1, Kiz, and Kiz-pT379 co-localized at the centrosome during M phase (, , S3, S4, and S5). Moreover, another population of Kiz-pT379 signals aggregated and was surrounded by chromatin (prophase), moved to chromatin where it co-localized with PLK1 (prometaphase), remained at the centrosome alone, in contrast with PLK1, and localized at the midbody in cytokinesis (). We also showed that the cell and tumor growth rates of T606A mutant cells, in which with Kiz-pT379 localized to the chromatin (hereafter, ch-pKiz) were lower than those of WT cells with ch-pKiz, whereas the cell growth rate of T606D mutant cells without ch-pKiz resemble those of WT cells with ch-pKiz (, ). Thus, these results suggest that the existence of ch-pKiz is not necessarily related to the growth rate of cancer cells. Instead, T606A mutant cells exhibited an increased tendency to promote cell death compared with WT and T606D mutant cells, whereas T606D mutant cells without ch-pKiz exhibited cell cycle defects (Fig. S7). Therefore, these results will not be necessarily denied the relationship between ch-pKiz and cancer malignancy with chromosomal instability, although the further study (for example, a rescue experiments of the cell cycle defects in CHC-T606D cells by ectopically expressing Kiz-T379D mutant) is needed in the future. This dynamic behavior of Kiz-pT379, independent of Kiz, suggests that Kiz-pT379 plays a pivotal role in proper mitotic progression.
Based on these results, we propose a working hypothesis in which the GAK_CHC-pT606_PLK1_Kiz-pT379 axis plays an important role in mitotic cell growth (Fig. S8). As a daylighting function, GAK plays an essential role in clathrin-mediated membrane trafficking (Fig. S8A). As a moonlighting function, GAK is activated and phosphorylates CHC-T606 to control Kiz-pT379 phosphorylation by PLK1 in normal cells, which is important for proper mitotic progression (Fig. S8B-i). However, in cancer cells, GAK is overexpressed [Citation34] and its kinase activity is greatly enhanced. This may cause over-phosphorylation of CHC-T606, which influences the phosphorylation of Kiz-T379 by PLK1 and causes overgrowth of cancer cells (Fig. S8B-ii). In GAK-depleted cells, CHC-T606 is not phosphorylated by GAK, which disturbs control of the CHC_PLK1_Kiz complex and thereby induces metaphase arrest (Fig. S8B-iii). The phosphorylation of CHC-T606 by GAK on the centrosome may be a key to understanding the reason why the GAK_CHC-pT606_PLK1_Kiz-pT379 axis functions at a specific location, but not overall locations. Indeed, GAK-knockdown decreased CHC-pT606, PLK1, and Kiz-pT379 (on PLK1 activity) on the centrosome (, ). Moreover, endogenous CHC-pT606 was preferably localized at the centrosome during mitosis (), although we could not demonstrate that exogenous GFP-tagged CHC localized to the centrosomes (Fig. S1D). Therefore, these results also suggest that the centrosome may function as a scaffold to facilitate the signal transduction by phosphorylation in the GAK_CHC-pT606_PLK1_Kiz-pT379 axis. On the other hand, GAK knockdown prevented the upregulation of PLK1 during M phase (). Taken together, it is likely that GAK regulates the subcellular localization of PLK1-phosphorylated Kiz (Kiz-pT379) through CHC-pT606, whereas it promotes the mitotic expression of PLK1 in a CHC-independent manner. Namely, GAK_CHC-pT606 axis regulates PLK1_Kiz-pT379 axis but not PLK1 expression, whereas GAK and CHC may contribute to PLK1 expression independently of each other.
This model suggests that inhibitors of GAK kinase activity are potentially useful molecular targeted anti-cancer drugs at the bedside. Indeed, we have shown that GAK is a putative bona fide target of gefitinib in osteosarcoma cells, and co-administration of gefitinib and luteolin efficiently causes apoptotic death of osteosarcoma and prostate cancer cells [Citation34,Citation35]. We also showed that Withaferin A, a major bioactive component of the Indian herb Withania somnifera, induces death of prostate cancer cells [Citation47]. miR-206, which inhibits renal cell cancer growth by directly targeting GAK, is considered a potential therapeutic target in renal cell cancer [Citation48]. GAK is a promising drug target for the treatment of viral infections [Citation49] and the major therapeutic target in Parkinson’s disease [Citation50]; therefore, it may be useful to use chemical compounds developed to treat these diseases [Citation50–Citation52] as anti-cancer drugs.
Materials and methods
Antibodies
Monoclonal antibodies raised against the following proteins were purchased from the indicated commercial sources: α-tubulin (Sigma-Aldrich, T5168) and γ-tubulin (Sigma-Aldrich, T6557), GAPDH (MBL, M171-3 or M171-7), Myc (MBL, M047-3), Aurora A (CST, 12,100), PLK1 (Thermo Fisher, 33–1700), CHC (BD, 610,500), FLAG (Sigma-Aldrich, F3165), and TACC3 (CST, 8069). Polyclonal antibodies raised against the following proteins were purchased from the indicated commercial sources: CHC (Abcam, ab21679), Aurora A (CST, 3092), Myc (MBL, 562–5), FLAG (Sigma-Aldrich, F7425), and cyclin B1 (Santa Cruz, sc-752). Anti-GAK monoclonal antibodies, GAK (9–10) and GAK (9–13), were generated in our laboratory [Citation36]. Antibodies against CHC-pT606 and Kiz-pT397 were generated using peptides (CILGNQMF[pT]HYDRAH for CHC-pT606 and STSSDL[pT]ISISEDD for Kiz-pT397) as antigens by Genscript. The generated antibodies were successively affinity purified using the corresponding non-phosphopeptides and then phosphopeptides by Genscript. These peptides were chemically synthesized by Genscript. Anti-Kiz rabbit polyclonal antibody was generated using GST-fused human Kizuna C-terminus (amino acids 562–673) as an antigen by Genscript. For Wb analysis, CHC-pT606 antibody was diluted at 1:250 with Can Get Signal (TOYOBO, Japan) and 0.5% skim milk in TBS-T.
In vitro kinase assays
GST-fused CHC fragments (1–323 aa, 324–806 aa, 807–1151 aa, 1152–1596 aa, and 1597–1675 aa) prepared as purified recombinant proteins were used as substrates. Affinity purified GST-GAK was used as a protein kinase. In radioactive kinase assays, the kinase and each substrate were mixed in kinase buffer (60 mM HEPES [pH 7.5], 5 mM MgCl2, 5 mM MnCl2, 12.5 mM DTT, and 3 mM Na3VO4) containing 40 μM [γ-32P]-labeled ATP (10 μCi, Perkin-Elmer, NEG502A). Each reaction mixture was incubated at 30°C for 30 min, and the reaction was stopped by addition of Laemmli buffer. Samples were boiled for 5 min and then analyzed by SDS-polyacrylamide gel electrophoresis (PAGE) and CBB staining with Simply Blue™ Safe Stain (Invitrogen). The [γ-32P] signals were detected by the image analyzer FLA7000 (Fujifilm). In non-radioactive assays, non-labeled ATP was used and detected by phospho-specific antibodies.
Tumorigenesis in nude mice
All animal experiments were performed with the approval of the Animal Experiments Committee of Osaka University (permission number: H28-E6). A total of 5 × 10⁶ cells prepared in 50 μL of DMEM were subcutaneously injected into the left flanks of BALB/c Slc-nu/nu female nude mice (4 weeks old; Japan SLC, Inc.) using a 26-G needle. Tumor growth was monitored every 2 or 3 days, and tumor volume was measured using a caliper square. Dox (1.6 mg per mouse) was intraperitoneally injected about twice per week.
Purification of recombinant proteins
Each CHC fragment or Kiz-coding region was inserted between the AscI and NotI sites of the pGEX6P (+AscI) vector and introduced into E. coli BL21 cells (RIL). The cells were then collected and lysed in phosphate-buffered saline containing 1% Triton X-100, 1 µg/mL leupeptin, 1 µg/mL aprotinin, 1 µg/mL pepstatin A, 1 mM benzamidine, 100 µg/mL PMSF, 1 mM NaF, and 1 mM Na3VO4 by brief sonication. After centrifugation, the clear lysate was adsorbed to Glutathione Sepharose 4B (Amersham Pharmacia Biotech, #27–4574-01). Then, the GST-fused protein was eluted from the column in elution buffer containing 10 mM reduced glutathione (Nacalai Tesque, #08786–61).
IF analyses
For formaldehyde (FA) fixation, HeLa S3 cells plated on coverslips were treated with 4% FA/PBS (-) for 10 min at room temperature (RT), followed by sequential incubations in 0.1% Triton X-100/PBS (-) for 10 min and then 0.05% Tween-20/PBS (-) for 10min. For methanol (MeOH) fixation, HeLa S3 cells plated on coverslips were treated with 100% ice-cold MeOH at −20°C for 10 min after pretreatment of the cells with microtubule-stabilizing buffer (80 mM Pipes-KOH, pH6.8, 5 mM EGTA, 1 mM MgCl2, 0.5% Triton X-100) for 5 min at RT, followed by washing the cells three times in PBS (-). IF staining was performed as described in our previous reports [Citation37,Citation53]. The signal intensity of immuneflurescence images was measured by MetaVue software (Molecular Devices) or FLUOVIEW software Ver. 4.2a (Olympus).
Knockdown and cell cycle synchronization
For siRNA-mediated knockdown, HeLa S3 cells were transfected with siRNA duplexes against GAK, CHC, or a negative control GL2 using Lipofectamine 2000 (Invitrogen). Sequences of siRNA sense strands were as follows: siGAK (Ki9), 5ʹ-GAUGUGCGGUUGUUCCUGGdTdT-3ʹ; siCHC, 5ʹ-AUCCAAUUCGAAGACCAAUdTdA-3ʹ; siGL2 (firefly luciferase), 5ʹ-CGUACGCGGAAUACUUCGAdTdT-3ʹ. After transfection, the cells were treated with 2.5 mM thymidine for 24 hrs, washed twice, and then cultured in thymidine-free medium (TFM) for 11 hrs (thymidine-single block and release). For thymidine-double block and release (TDBR), the cells treated with 2.5 mM thymidine for 18 hrs were cultured in TFM for 9 hrs, followed by a release in TFM for the indicated times after second treatment with 2.5 mM thymidine for 18 hrs. These experiments were partly supported by UNITECH Co., Ltd (Chiba, Japan).
Plasmid transfection and Tet-on inducible cell lines
The AscI-NotI fragment of Human CHC-WT, -T606A, and – T606D were cloned into pEGFP3B, a modified version of pEGFP-C1(Clontech) or pTRET3-6Myc vector containing 6Myc-tag and a multiple cloning site linker, a modified version of pTRE-Tight vector (Clontech). HeLa S3 cells were transfected with pEGFP3B-CHCs (WT, T606A, and T606D) using Lipofectamine and PLUS reagent according to the manufacturer’s instructions (Invitrogen). HeLa S3/Tet-On cells were co-transfected with pTRET3-6Myc-CHCs and linear hygromycin marker (Clontech) in a similar way. To obtain single colonies, transfected HeLa S3/Tet-On cells were selected by limiting dilution with selection medium including 200 μg/mL hygromycin. Positive clones were identified by Wb analysis after 48 h incubation in the presence or absence of 1 μg/mL doxycycline (Dox).
Statistical analysis
Significant differences were determined by the Student’s t-test using Microsoft Excel 2013 software (Microsoft). Data obtained in vitro are shown as means ± SD, from three independent experiments. Data obtained in vivo are expressed as means ± SE. P values <0.001 (***), <0.01 (**) and <0.05 (*) were considered to be statistically significant.
Other methods
Details of other methods were described in our previous reports [Citation37,Citation53].
Author contributions
Y.Y., N.Y., T.S., H.S., Y.N., K.F., and K.O. performed cell culture, immunostaining, FC, and Wb analyses. T.S. and Y.N. determined the phosphorylation site of CHC by GAK and performed other phosphorylation-related experiments. T.S. isolated the Tet-ON inducible cell lines. Y.Y. and T.U. conducted mouse-related experiments. Y.Y., T.U., and M.K. performed IHC analysis. N.Y., M.K., and H.N. conceived the experimental design. Y.Y., N.Y., and H.N. wrote the manuscript. All authors read and approved the final manuscript.
Supplemental Material
Download Zip (4.1 MB)Acknowledgments
We are grateful to Dr. Satomi Mukai, Dr. Ippei Nagamori and Ms. Yorika Kato for technical advice and assistance. We also thank Dr. Christopher Patil of Bioedit Ltd. for critically reading this manuscript.
Disclosure statement
No potential conflict of interest was reported by the authors.
Supplementary Material
Supplemental data for this article can be accessed here.
Additional information
Funding
Related Research Data
References
- McMahon HT, Boucrot E. Molecular mechanism and physiological functions of clathrin-mediated endocytosis. Nat Rev Mol Cell Biol. 2011;12(8):517–533.
- Royle SJ, Bright NA, Lagnado L. Clathrin is required for the function of the mitotic spindle. Nature. 2005;434(7037):1152–1157.
- Royle SJ. Mitotic moonlighting functions for membrane trafficking proteins. Traffic. 2011;12(7):791–798.
- Royle SJ. The role of clathrin in mitotic spindle organisation. J Cell Sci. 2012;125(Pt 1):19–28.
- Royle SJ. Protein adaptation: mitotic functions for membrane trafficking proteins. Nat Rev Mol Cell Biol. 2013;14(9):592–599.
- Booth DG, Hood FE, Prior IA, et al. A TACC3/ch-TOG/clathrin complex stabilises kinetochore fibres by inter-microtubule bridging. Embo J. 2011;30(5):906–919.
- Hood FE, Royle SJ. Pulling it together: the mitotic function of TACC3. Bioarchitecture. 2011;1(3):105–109.
- Cheeseman LP, Booth DG, Hood FE, et al. Aurora A kinase activity is required for localization of TACC3/ch-TOG/clathrin inter-microtubule bridges. Commun Integr Biol. 2011;4(4):409–412.
- Gutiérrez-Caballero C, Burgess SG, Bayliss R, et al. TACC3-ch-TOG track the growing tips of microtubules independently of clathrin and Aurora-A phosphorylation. Biol Open. 2015;4(2):170–179.
- Miller SE, Mathiasen S, Bright NA, et al. CALM regulates clathrin-coated vesicle size and maturation by directly sensing and driving membrane curvature. Dev Cell. 2015;33(2):163–175.
- Skruzny M, Desfosses A, Prinz S, et al. An organized co-assembly of clathrin adaptors is essential for endocytosis. Dev Cell. 2015;33(2):150–162.
- Wood LA, Royle SJ. Zero tolerance: amphipathic helices in endocytosis. Dev Cell. 2015;33(2):119–120.
- Kaur S, Fielding AB, Gassner G, et al. An unmet actin requirement explains the mitotic inhibition of clathrin-mediated endocytosis. Elife. 2014;3:e00829.
- Nixon FM, Gutiérrez-Caballero C, Hood FE, et al. The mesh is a network of microtubule connectors that stabilizes individual kinetochore fibers of the mitotic spindle. Elife. 2015;4:e07635.
- Nixon FM, Honnor TR, Clarke NI, et al. Microtubule organization within mitotic spindles revealed by serial block face scanning electron microscopy and image analysis. J Cell Sci. 2017;130(10):1845–1855.
- Schmucker S, Sumara I. Molecular dynamics of PLK1 during mitosis. Mol Cell Oncol. 2014 Oct 29;1(2):e954507.
- Archambault V, Lépine G, Kachaner D. Understanding the Polo Kinase machine. Oncogene. 2015;34(37):4799–4807.
- Combes G, Alharbi I, Braga LG, et al. Playing polo during mitosis: PLK1 takes the lead. Oncogene. 2017;36(34):4819–4827.
- Kumar S, Sharma AR, Sharma G, et al. PLK-1: angel or devil for cell cycle progression. Biochim Biophys Acta. 2016;1865(2):190–203.
- Liu J, Zhang C. The equilibrium of ubiquitination and deubiquitination at PLK1 regulates sister chromatid separation. Cell Mol Life Sci. 2017;74(12):2127–2134.
- Reinhardt HC, Yaffe MB. Phospho-Ser/Thr-binding domains: navigating the cell cycle and DNA damage response. Nat Rev Mol Cell Biol. 2013;14(9):563–580.
- Liu Z, Sun Q, Wang X. PLK1, A Potential Target for Cancer Therapy. Transl Oncol. 2017;10(1):22–32.
- Zhang Y, Wu Z, Liu D, et al. Augmented expression of polo-like kinase 1 indicates poor clinical outcome for breast patients: a systematic review and meta-analysis. Oncotarget. 2017;8(34):57723–57732.
- Gutteridge RE, Ndiaye MA, Liu X, et al. Plk1 Inhibitors in Cancer Therapy: from Laboratory to Clinics. Mol Cancer Ther. 2016;15(7):1427–1435.
- Oshimori N, Ohsugi M, Yamamoto T. The Plk1 target Kizuna stabilizes mitotic centrosomes to ensure spindle bipolarity. Nat Cell Biol. 2006;8(10):1095–1101.
- Oshimori N, Li X, Ohsugi M, et al. Cep72 regulates the localization of key centrosomal proteins and proper bipolar spindle formation. Embo J. 2009;28(14):2066–2076.
- Thomas Y, Peter M, Mechali F, et al. Kizuna is a novel mitotic substrate for CDC25B phosphatase. Cell Cycle. 2014;13(24):3867–3877.
- Liu XS, Song B, Liu X. The substrates of Plk1, beyond the functions in mitosis. Protein Cell. 2010;1(11):999–1010.
- Kirchhausen T, Owen D, Harrison SC. Molecular structure, function, and dynamics of clathrin-mediated membrane traffic. Cold Spring Harb Perspect Biol. 2014;6(5):a016725.
- Park BC, Yim YI, Zhao X, et al. The clathrin-binding and J-domains of GAK support the uncoating and chaperoning of clathrin by Hsc70 in the brain. J Cell Sci. 2015;128(20):3811–3821.
- Shimizu H, Nagamori I, Yabuta N, et al. GAK, a regulator of clathrin-mediated membrane traffic, also controls centrosome integrity and chromosome congression. J Cell Sci. 2009;122(Pt 17):3145–3152.
- Tanenbaum ME, Vallenius T, Geers EF, et al. Cyclin G-associated kinase promotes microtubule outgrowth from chromosomes during spindle assembly. Chromosoma. 2010;119(4):415–424.
- Kim J, Noh JH, Lee SK, et al. LncRNA OIP5-AS1/cyrano suppresses GAK expression to control mitosis. Oncotarget. 2017;8(30):49409–49420.
- Sakurai MA, Ozaki Y, Okuzaki D, et al. Gefitinib and luteolin cause growth arrest of human prostate cancer PC-3 cells via inhibition of cyclin G-associated kinase and induction of miR-630. PLoS One. 2014;9(6):e100124.
- Susa M, Choy E, Liu X, et al. Cyclin G-associated kinase is necessary for osteosarcoma cell proliferation and receptor trafficking. Mol Cancer Ther. 2010;9(12):3342–3350.
- Sato J, Shimizu H, Kasama T, et al. GAK, a regulator of clathrin-mediated membrane trafficking, localizes not only in the cytoplasm but also in the nucleus. Genes Cells. 2009 May;14(5):627–641.
- Fukushima K, Wang M, Naito Y, et al. GAK is phosphorylated by c-Src and translocated from the centrosome to chromatin at the end of telophase. Cell Cycle. 2017;16(5):415–427.
- Naito Y, Shimizu H, Kasama T, et al. Cyclin G-associated kinase regulates protein phosphatase 2A by phosphorylation of its B’γ subunit. Cell Cycle. 2012;11(3):604–616.
- Blixt MK, Royle SJ. Clathrin heavy chain gene fusions expressed in human cancers: analysis of cellular functions. Traffic. 2011;12(6):754–761.
- Spiró Z, Thyagarajan K, De Simone A, et al. Clathrin regulates centrosome positioning by promoting acto-myosin cortical tension in C. elegans embryos. Development. 2014;141(13):2712–2723.
- Fu W, Jiang Q, Zhang C. Novel functions of endocytic player clathrin in mitosis. Cell Res. 2011;21(12):1655–1661.
- Schweitzer JK, Burke EE, Goodson HV, et al. Endocytosis resumes during late mitosis and is required for cytokinesis. J Biol Chem. 2005;280(50):41628–41635.
- Gao Z, Niu X, Zhang Q, et al. Mitochondria chaperone GRP75 moonlighting as a cell cycle controller to derail endocytosis provides an opportunity for nanomicrosphere intracellular delivery. Oncotarget. 2017;8(35):58536–58552.
- Smith CM, Chircop M. Clathrin-mediated endocytic proteins are involved in regulating mitotic progression and completion. Traffic. 2012;13(12):1628–1641.
- Ray MR, Wafa LA, Cheng H, et al. Cyclin G-associated kinase: a novel androgen receptor-interacting transcriptional coactivator that is overexpressed in hormone refractory prostate cancer. Int J Cancer. 2006;118(5):1108–1119.
- Yuan J, Sanhaji M, Krämer A, et al. Polo-box domain inhibitor poloxin activates the spindle assembly checkpoint and inhibits tumor growth in vivo. Am J Pathol. 2011;179(4):2091–2099.
- Nishikawa Y, Okuzaki D, Fukushima K, et al. Withaferin A Induces Cell Death Selectively in Androgen-Independent Prostate Cancer Cells but Not in Normal Fibroblast Cells. PLoS One. 2015;10(7):e0134137.
- Wei C, Wang S, Ye ZQ, et al. miR-206 inhibits renal cell cancer growth by targeting GAK. J Huazhong Univ Sci Technolog Med Sci. 2016;36(6):852–858.
- Bekerman E, Neveu G, Shulla A, et al. Anticancer kinase inhibitors impair intracellular viral trafficking and exert broad-spectrum antiviral effects. J Clin Invest. 2017;127(4):1338–1352.
- Perrett RM, Alexopoulou Z, Tofaris GK. The endosomal pathway in Parkinson’s disease. Mol Cell Neurosci. 2015;66(Pt A):21–28.
- Li J, Kovackova S, Pu S, et al. Isothiazolo[4,3-b]pyridines as inhibitors of cyclin G associated kinase: synthesis, structure-activity relationship studies and antiviral activity. Medchemcomm. 2015;6(9):1666–1672.
- Kovackova S, Chang L, Bekerman E, et al. Selective Inhibitors of Cyclin G Associated Kinase (GAK) as Anti-Hepatitis C Agents. J Med Chem. 2015;58(8):3393–3410.
- Ohno S, Ikeda JI, Naito Y, et al. Comprehensive phenotypic analysis of knockout mice deficient in cyclin G1 and cyclin G2. Sci Rep. 2016;6:39091.