
ABSTRACT
Intrinsic and/or acquired resistance to cisplatin is a significant obstacle in the treatment of muscle-invasive bladder cancer. p73, a p53 homolog and determinant of chemosensitivity, is rarely mutated in bladder cancer (BC). However p73 expression and therefore function can be repressed through epigenetic changes. In this study, we sought to identify DNA methylation status of p73, expression of TAp73 isoform, and their role in cisplatin sensitivity in BC. Primary tumor samples from 338 bladder cancer patients showed decreased TAp73 expression in MIBC compared to superficial BC. Low TAp73 protein expression was associated with shorter overall survival. To investigate if the loss of expression was methylation dependent, we utilized Illumina 450K methylation arrays to interrogate over 150 BC patient samples. We found 12 distinct CpGs in the p73 gene locus that were hypermethylated in tumors compared to adjacent normal tissues. Patients with high p73 promoter methylation specifically at CpG site cg07382920 had worse survival. In vitro, treatment with a DNA demethylating agent, decitabine (DAC), decreased TAp73 methylation and upregulated expression in both CR-T24 (cisplatin resistant T24 cells) and wild type T24 cells. Furthermore, treatment with DAC increased cisplatin response in wild type T24 and CR-T24. Our studies indicate that TAp73 expression and P1 promoter methylation, specifically at the cg073892920 site, may have prognostic and diagnostic value in MIBC. In the setting of P1 promoter hypermethylation, DAC could be used as a potentiating agent of cisplatin-based chemotherapy.
KEYWORDS:
Introduction
Bladder cancer is the sixth most common cancer in the United States and the second most common genitourinary cancer. There are an estimated 80,470 new cases and 17,670 deaths each year [Citation1]. Approximately 30% of patients present with muscle-invasive bladder cancer (MIBC). The standard approach to therapy of MIBC (>T1) is neoadjuvant, cisplatin-based, combination chemotherapy followed by radical cystectomy [Citation2]. The increase in survival with neoadjuvant chemotherapy followed by cystectomy compared to cystectomy alone is approximately 15% [Citation3–Citation5]. Delaying cystectomy to give chemotherapy to patients who may be cisplatin resistant could be detrimental. Therefore it is critical to identify reliable biomarkers that determine a patients’ likelihood of cisplatin response [Citation6,Citation7].
During tumorigenesis, the processes for maintaining normal DNA methylation patterns is impaired, leading to global DNA hypomethylation and promoter DNA hypermethylation in tumor tissues [Citation8,Citation9]. Promoter DNA hypermethylation is frequent in bladder cancer and has been previously investigated to identify biomarkers for bladder cancer prognosis [Citation10–Citation12]. Multiple studies have examined cancer-related genes with high rates of methylation that significantly correlate with various parameters such as poor prognosis, tumor grade and stage, and muscle invasion in bladder cancer [Citation13–Citation15]. One study examined 10 tumor suppressor genes in 98 bladder cancer patients and found CDH1 and FHIT methylation significantly associated with poor survival [Citation13]. Another study identified Wnt-antagonist genes (sFRP-1, sFRP-2, sFRP-4, sFRP-5, Wif-1, and Dkk-3) as having high DNA promoter hypermethylation and low expression in bladder tumors compared to normal bladder mucosa which related to poor prognosis and higher tumor grade and stage [Citation16]. A third study identified different methylation patterns that can distinguish muscle-invasive disease from non-muscle invasive disease [Citation17]. These studies suggest there may be a role for promoter methylation as a clinical biomarker in bladder cancer.
p53 is mutated in approximately 50% of MIBC [Citation18,Citation19] and is not predictive of cisplatin response. p73 is a member of the p53 family of transcription factors and can function as a tumor suppressor [Citation20,Citation21]. p73 is rarely mutated in cancer, however, expression can be altered through epigenetic changes such as promoter methylation or loss of heterozygosity [Citation21,Citation22]. p73 has many isoforms that arise due to alternative promoter sites within the gene as well as C-terminal splicing [Citation23]. When transcription of p73 starts from the P1 promoter site, the resulting transcript contains the transcriptional activation domain and is referred to as TAp73 [Citation24]. Due to structural similarity and homology within the DNA-binding domain, TAp73 functions similarly to wild-type p53 and is considered to be pro-apoptotic [Citation22,Citation25].
Little is known about p73 isoform expression in bladder cancer or the contribution of p73 to disease progression. In this study, we find a loss of TAp73 expression in tumor vs. normal tissue and survival advantage in patients with higher TAp73 levels and lower p73 promoter methylation. Furthermore, we show that treating with decitabine, a hypomethylating agent, can alter promoter methylation, increase TAp73 isoform expression in MIBC cell lines, and increase response to cisplatin. Overall, this study identifies decitabine as a potential therapeutic intervention to increase TAp73, a prospective biomarker, to augment cisplatin response in preclinical bladder cancer models.
Results
Higher TAp73 protein expression is associated with lower tumor grade and greater overall survival
To assess the clinical significance of TAp73 expression in bladder cancer, we examined 338 primary tumor and 16 metastatic tumor samples compiled on tissue microarrays (TMAs) and stained with anti-TAp73. The clinicopathological characteristics of patients are listed in Supplementary Table 1. shows representative immunohistochemical images with positive and negative staining of TAp73. Mean TAp73 H-scores, determined by intensity and % positive nuclei, were reported by grade and stage (Supplementary Table 2). There was a significant loss of TAp73 protein expression with increasing disease grade. We found significantly lower H-scores in patients with intermediate disease (Mean H-score: 35.3) compared to high-grade patients (Mean H-score: 12.3) (, Supplementary Table 2, p < 0.001). TAp73 expression was lower in patients with muscle-invasive disease (Mean H-score: 8.6) compared with patients who had superficial disease (Mean H-score: 24.4) (, Supplementary Table 2, p < 0.001).
Figure 1. Loss of TAp73 expression in MIBC is associated with lower overall survival.
Primary tumor samples from 338 bladder cancer patients were stained for TAp73 expression and analyzed using Aperio ScanScope. Protein expression was defined by H-scores, calculated as described in materials and methods. (a) Immunohistochemical staining showing representative images with positive and negative staining of TAp73. (b&c) Tap73 H-scores based on grade or phenotype. (d&e) Kaplan-Meier plot of overall and disease-specific survival in individuals stratified into quartiles (High > 16.1, 1.06 ≤ Intermediate ≤ 16.1, Low < 1.06) based on TAp73 H-scores. Clinicopathological characteristics of this patient cohort are detailed in Supplementary Table 1.
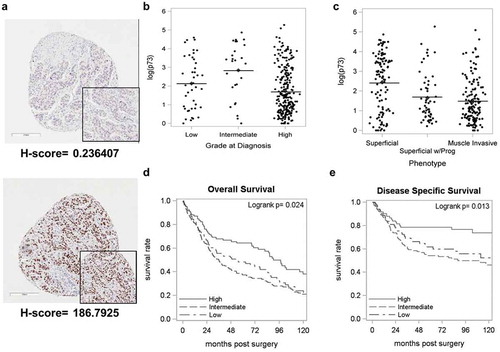
We then investigated the association between TAp73 expression and survival based on H-score. The median age of this cohort was 69 years (range: 36-91years), and median follow-up was 132 months (range: 8–229 months). Complete loss of TAp73 was observed in 154 (45.6%) patients. The median overall survival was 54.3 months in patients with low TAp73 H-scores compared to 90.3 months in patients with high TAp73 H-scores (p < 0.05, , Supplementary Table 3). The same trend was observed with disease-specific survival (p < 0.05, , Supplementary Table 3). In summary, our results show that loss of TAp73 correlates with worse patient survival.
P73 promoter is frequently hypermethylated in muscle-invasive bladder cancer and is associated with worse survival in patients
Tumor samples (n = 106) and adjacent normal tissue (n = 52) with no evidence of disease were interrogated using Illumina 450K DNA methylation array. We found 12 distinct CpGs within the p73 gene that were hypermethylated in tumors compared to adjacent normal tissues (p < 0.05, ). Hypermethylation was detected in 9 CpG sites in the P1 promoter region (, ), one CpG site in the P2 region (), and 2 CpG sites near exon 14 (). We specifically compared 52 tumor samples with their matched normal samples and confirmed an increase in methylation in tumor samples at all CpG sites within the p73 gene (Supplementary Figure 2a-c). Overall, we found 49 out of 52 patients (94.23%) with higher methylation in tumors compared to their matched normal tissue. This suggests that p73 promoter hypermethylation is a common occurrence in bladder cancer.
Figure 2. p73 promoter is frequently hypermethylated in muscle-invasive bladder cancer.
Tumor and adjacent tissue with no evidence of disease were interrogated using Illumina 450K DNA methylation array. (a) Representative image showing CpG sites analyzed by Illumina array and pyrosequencing (in circles). Exons coding regions are displayed as numbered boxes. Box plots of average methylation pattern in individual MIBC patients. Beta values of average methylation interrogated across (b) 12 CpG sites, (c) 9 CpGs in P1 and (d) 1 CpG in P2.
Next, we evaluated the prognostic significance of p73 promoter methylation in tumor samples from bladder cancer patients. We defined β-value>0.46 as high methylation and β-value≤0.46 as low methylation. The median overall survival was 24 months for patients with high methylation levels in the p73 promoter, compared with 31 months for patients with low p73 methylation (p = 0.65, Supplementary Figure 3a-b). We then analyzed p73 promoter methylation specifically in patients who had received cisplatin-based chemotherapy. The overall survival for patients who received cisplatin based or neoadjuvant chemotherapy was significantly worse when the promoter region was methylated ((cisplatin: 13.5 vs. 30 months, p < 0.01, ). We identified a specific CpG site ‘cg07382920ʹ in the P1 promoter region, which when highly methylated (β-value>0.44) significantly associated with worse overall median survival (49 vs. 20 months, p < 0.05, Supplementary Figure 3c, 3d). Furthermore, patients treated with cisplatin based or neoadjuvant chemotherapy who had high methylation at cg07382920 had worse survival compared with patients who had low methylation; however, this result was not statistically significant (Supplementary Figure 4a-d). Further studies are required to validate the significance of cg07382920 methylation on p73 expression. Overall our results suggest that p73 promoter hypermethylation is a prognostic indicator for cisplatin response in bladder cancer patients.
Figure 3. High promoter methylation in patients is associated with poor survival outcome.
(a&b) Kaplan-Meier survival analysis with high methylation (solid line) and low methylation (dashed line) in patients after cisplatin treatment. (c&d) Kaplan-Meier survival analysis with high methylation (solid line) and low methylation (dashed line) in patients after chemotherapy.
Decitabine decreases TAp73 promoter methylation and increases expression
To determine whether promoter DNA methylation regulates p73 expression, we treated immortalized epithelial bladder cells SV-HUC and bladder cancer cell lines (HT1376, 253J, T24) with DNA hypomethylating agent decitabine (DAC) at escalating doses (0,1,5 μM). We performed pyrosequencing to interrogate 5 CpG sites in the P1 region and 6 CpG sites in the P2 region, which transcribes a second predominant ΔNp73 isoform, following DAC treatment. Significant demethylation was observed in the P1 promoter region for all four cell lines (). However with the P2 promoter region, we found demethylation in a dose-dependent manner with SV-HUC only but not in HT1376, 253J, and T24 ().
Figure 4. Decitabine decreases TAp73 promoter methylation and increases expression.
Cells were treated with 0, 1, or 5 µM DAC. Total RNA, DNA, and protein nuclear extracts were harvested at 48h. (a&b) P1 and P2 promoter methylation was analyzed using pyrosequencing following DAC treatment. Average methylation across the interrogated CpG sites is represented. (c&d) TAp73 and ∆Np73 mRNA expression levels following treatment. Results are the mean ± SEM of the relative expression level to GAPDH. (e) qPCR products on agarose gel after DAC treatment in 253J cells. (f) TAp73 and DNMT1 protein levels after DAC treatment with Histone H3 as a loading control. *p < 0.05, **p < 0.01, ***p < 0.001.
DAC treatment increased mRNA expression of both TAp73 and ΔNp73 isoforms in all cell lines (d). 253J had undetectable mRNA levels by qPCR, but we verified increased expression by visualizing PCR products (). Western blot analysis further confirmed DAC-depleted DNMT1 expression in all cell lines (). A monoclonal antibody specific for full-length TAp73 but not reacting to ΔNp73 or p53 was used to detect protein expression levels. TAp73 expression increased after DAC treatment in SV-HUC, HT1376, and T24, while 253J did not show any detectable TAp73 protein (). RNA sequencing analysis was used to determine expression levels of different p73 isoforms including TAp73 and ΔNp73 isoforms after 1 μM DAC treatment in SV-HUC and T24 cells. Increased mRNA expression was observed after DAC treatment with all isoforms except in TAp73α, and TAp73δ, TAp73ξ in SV-HUC cells (Supplementary Figure 5). These C-terminal splice variants were also differentially expressed in tumor and non-tumor tissues obtained from bladder cancer patients (Supplementary Figure 6).
Our results showed that DAC treatment demethylates P1 promoter region and increases TAp73 expression. However, DAC did not significantly demethylate P2 promoter region, suggesting the increased ΔNp73 mRNA expression is through mechanisms other than DNA methylation.
Decitabine mediated demethylation of the P1 promoter region sensitizes bladder tumor cells to cisplatin treatment
To test if DAC could sensitize bladder cancer cells to cisplatin treatment, we treated T24 cells with DAC or cisplatin alone or pretreated with DAC followed by cisplatin. We analyzed P1 and P2 promoter methylation levels following treatment using pyrosequencing. Demethylation occurred following DAC treatment, whether alone or in combination with cisplatin treatment in the P1 promoter region (p < 0.05, ). Cisplatin treatment alone did not change methylation levels compared to control cells (). No significant DNA methylation changes were observed in the P2 promoter region after treatment with DAC, cisplatin or combination of DAC and cisplatin (). TAp73 expression levels increased significantly after treatment, with the most enhanced effect observed following combination treatment (p < 0.01, ). Interestingly, ΔNp73 expression increased with DAC (p < 0.01, ) and combination treatment (p < 0.001, ), and reduced with cisplatin treatment alone (p < 0.001, ).
Figure 5. Pretreatment with decitabine sensitizes T24 cells to cisplatin.
(a-i) T24 cells were pretreated with 2 µM DAC for 48 hours, followed by 0.5 µg/mL cisplatin treatment. Total RNA, DNA, and protein nuclear extracts were harvested at 24 hours following cisplatin treatment. (a&b, f&g) Promoter P1, P2 methylation was analyzed using pyrosequencing in T24 and CR-T24 cells respectively. Average methylation across the interrogated CpG sites following treatment is represented. (c&d, h&i) TAp73 and ∆Np73 mRNA expression levels after treatment in T24 and CR-T24 cells respectively. Results are the mean ± SEM of the relative expression level to GAPDH. (e)TAp73 and DNMT1 protein level were evaluated using immunoblot analysis, using Histone H3 as a loading control. (j&k) T24 and CR-T24 cells were subjected to in vitro clonogenic assay. Cells were pretreated with 0.5 µM DAC for 48 hours, followed by 0.25 µg/mL cisplatin (T24) or 1µg/mL cisplatin (CR-T24) treatment for 24 hours. Colonies were stained with crystal violet after an incubation period of 10 days. Results are indicated as surviving fraction as compared to control cells treated with media alone. *p < 0.05, **p < 0.01, ***p < 0.001.
We further used a cisplatin-resistant variant of T24, CR-T24 cell line [Citation26], to evaluate promoter methylation and TAp73 and ΔNp73 isoform expression following treatment. TAp73 expression was undetectable in CR-T24 cell line (Supplementary Fig 7a-b). CR-T24 cells were more methylated than wild-type T24, and significant demethylation was observed in both P1 and P2 promoter region with the combination treatment (p < 0.05, ). Treatment with DAC alone and combination treatment with DAC and cisplatin significantly increased TAp73 mRNA expression (). We did not see a significant increase in TAp73 levels with cisplatin treatment alone (). There were no significant changes in expression with ΔNp73 isoform following treatment (). Our data confirmed P1 promoter methylation was associated with silencing of p73 expression and treatment with DAC increases TAp73 expression through promoter demethylation.
Clonogenic assays were performed with wild type T24 and CR-T24 cells to assess proliferation following treatment. The surviving fraction of T24 cells treated with DAC (50.30 ± 13.37, p < 0.05) or cisplatin (39.30 ± 2.858, p < 0.0001) alone reduced the surviving fraction compared to control treated cells. Combination treatment with DAC and cisplatin had significantly fewer colonies when compared to DAC or cisplatin alone group (6.000 ± 2.800, p < 0.05; ,k). Similar results were obtained using 253J cells (Supplementary Fig 8). In CR-T24 cells, we found the surviving fraction reduced with DAC (14.57 ± 0.8164, p < 0.05), slightly decreased with cisplatin (92.90 ± 5.161, p < 0.01) and significantly reduced with combination treatment (4.013 ± 1.518, p < 0.05, ,k). These results suggested that DAC potentiates cisplatin-induced anti-proliferative effects in T24 cells.
Patients who underwent neoadjuvant therapy exhibit P1 promoter hypermethylation and lower TAp73 expression
To assess if cisplatin treatment in patients contributed to p73 promoter hypermethylation, we analyzed 9 matched tumor and adjacent non-tumor samples from patients who underwent neoadjuvant chemotherapy. The clinicopathological characteristics of these patients are listed in Supplementary Table 4. We investigated TAp73 and ΔNp73 expression and methylation status in these patients. P1 promoter methylation was higher in tumors compared to adjacent non-tumors (p < 0.05, ) which correlated with lower TAp73 expression in tumors (not significant, ). In the P2 promoter region, we found non-tumors to be significantly more methylated than tumors (p < 0.05, ). There was increased ΔNp73 expression in non-tumors compared with tumors (p < 0.001, ). FFPE samples from 28 matched tumors and adjacent non-tumors from patients who underwent neoadjuvant chemotherapy were stained with TAp73. We found H-scores were significantly lower in tumors compared to non-tumors in these patients (p < 0.05, ). Our patient data confirms that P1 promoter methylation is associated with TAp73 silencing, while further work is required to fully understand the mechanism of ΔNp73 expression.
Figure 6. Analysis of MIBC patient tumor samples indicates p73 promoter hypermethylation in tumor compared to adjacent normal tissue.
Genomic DNA and total RNA was obtained from patients who underwent neoadjuvant treatment and subsequent cystectomy. (a&b) Average methylation across interrogated CpG sites in P1 and P2 promoter region. (c&d) TAp73 and ∆Np73 mRNA expression level in patients are indicated as ∆Ct. (e) H-scores in tumors and adjacent non-tumors from patients who underwent neoadjuvant therapy. *p < 0.05, **p < 0.01, ***p < 0.001.
Discussion
Epigenetic changes, such as DNA methylation and histone modifications, contribute to tumorigenesis [Citation27]. Specifically, in bladder cancer, DNA methylation patterns have been used to distinguish non-muscle invasive disease from muscle invasive disease [Citation17]. In our study, the p73 P1 promoter, which transcribes pro-apoptotic TAp73, was found to be frequently hypermethylated that was associated with reduced expression and worse survival. These results highlight the potential prognostic and diagnostic importance of TAp73 methylation and expression in patients with muscle-invasive bladder cancer. Furthermore, we showed that TAp73 expression could be increased by decitabine-induced demethylation and thereby contribute to increased cisplatin response. This data suggests there is potential to use epigenetic therapies in the treatment of MIBC to alter TAp73 expression.
p73 has isoforms other than TAp73. The N-terminally truncated isoform, ΔNp73, is transcribed from an intrinsic promoter site (P2) and lacks the transcriptional activation domain [Citation28]. However, due to the similarity in the DNA-binding and protein-protein interaction domains, ΔNp73 can bind to and prevent transcriptional activity of TAp73 [Citation29]. ΔNp73 is therefore considered to be anti-apoptotic [Citation28–Citation30]. Unexpectedly, we also saw an increase in ΔNp73 mRNA expression with decitabine treatment, despite no methylation changes in the P2 promoter after treatment. It may be possible that by increasing TAp73 protein levels with treatment TAp73 is transactivating ΔNp73 [Citation31]. However, the ratio of TAp73 to ΔNp73 isoforms is an important factor in response to chemotherapy [Citation32,Citation33]. Higher TAp73 levels can overcome the repressive function of ΔNp73 and induce apoptosis after treatment with chemotherapy [Citation32,Citation33]. Therefore, despite seeing a slight increase in ΔNp73 mRNA, we still have a reduction in surviving fraction with decitabine and cisplatin combination [Citation32,Citation33]. In cells resistant to cisplatin, the P2 promoter region had increased methylation compared to wild type T24 cells. Treatment with decitabine either alone or in combination with cisplatin increased TAp73 mRNA expression, with no effect on ΔNp73 mRNA expression in resistant cells. The lack of effect on ΔNp73 is likely due to the increase in P2 promoter methylation and the inability of DAC to significantly lower P2 promoter methylation. This increase in P2 promoter methylation may be sufficient to prevent TAp73 transactivation of ΔNp73. In summary, using decitabine to resensitize cells to cisplatin by increasing TAp73 levels but not ΔNp73 can be explored as an option in the cisplatin resistance setting.
Other isoforms can be further classified based on their C-terminal splice variants (α, β, δ, ε, γ, etc.). Whether or not these isoforms are expressed as well as the functional consequences of these variants remains unknown [Citation30]. Further characterization of p73 isoforms should include C-terminal splice variants. Decitabine treatment appears to increase all p73 isoforms in T24 cells, but the clinical impact of individual isoform expression, aside from TA or ΔN distinction, is still unknown. Further experiments are required to determine the clinical significance of p73 C-terminal splice variants.
Neoadjuvant cisplatin-based chemotherapy is the standard approach to treat MIBC. One shortcoming of neoadjuvant chemotherapy is delaying cystectomy in patients that do not respond to cisplatin and intrinsic and acquired resistance to cisplatin [Citation7]. In addition, there are no clinical biomarkers to identify patients that will respond to cisplatin. MIBCs frequently harbor p53 mutations; however p53 status does not correlate with response to cisplatin [Citation6,Citation18,Citation19]. Identifying genes important in cisplatin response may have potential in distinguishing patient populations suitable for neoadjuvant cisplatin therapy. Our study shows that p73 P1 promoter methylation and protein expression may have the potential to identify patients that will respond to cisplatin-based chemotherapy. Pretreating with decitabine could further increase the clinical response to cisplatin by decreasing promoter methylation and increasing TAp73 protein expression. Identifying patients who are more likely to benefit from neoadjuvant cisplatin therapy through decitabine pretreatment would greatly improve the benefit of neoadjuvant cisplatin-based chemotherapy in MIBC patients.
Materials and methods
Immunohistochemistry and TMA analysis
TMA slides were stained with anti-TAp73 and were digitally scanned using Aperio Scanscope (Aperio Technologies, Inc.) with 20x bright-field microscopy. The Aperio platform was used to develop a quantitative image analysis algorithm macros for the quantification of immunohistochemistry (IHC) slides. Briefly, these algorithms used color de‐convolution to separate diaminobenzidine (DAB) from the hematoxylin counterstain thereby providing stain separation. Each algorithm was tailored to fine-tune the cell feature detection using cellular, nuclear, and stain parameters, creating an algorithm macro based on the cell compartment location of the target protein. The macro was adjusted for each antibody target and tissue combination to optimize results.
The Nuclear algorithm detects the positive (DAB) nuclear staining for the individual tumor cells and quantifies their staining intensity. The analysis results provided the total number of detected cells, the percentage of cells per scoring class (0, 1+, 2+ and 3+) and the percentage of positively stained cells along with each samples average staining intensity of the positive nuclei as a score of 0, 1+, 2+ and 3 + . The H Score for each sample was calculated using the formula: (3 x percentage of strongly staining nuclei) + (2 x percentage of moderately staining nuclei) + (percentage of weakly staining nuclei), giving a range of 0 to 300.
Illumina infinium 450K array
174 bladder tumor samples obtained from patients at Roswell Park Cancer Institute were analyzed by Illumina 450K array for methylome changes as described previously in Ramakrishnan et al [Citation34].
Tumor cell lines and cell culture
CDDP sensitive human T24 cells and its resistant counterpart (CR-T24) were maintained in McCoy’s medium. Cell line HT-1376 was cultured in Eagle’s Minimum Essential medium, SV-HUC in F-12K medium and 253J in RPMI medium. All media were supplemented with 10% FBS and 1% penicillin/streptomycin sulfate. Cells were grown at 37°C in a humidified atmosphere containing 5% CO2.
RNA isolation and cDNA synthesis
Total RNA was extracted using the Direct-zol RNA MiniPrep kit (Zymo Research, Cat. No. R2050) and quantified using a Nanodrop 8000 system (Thermo Scientific). cDNA was synthesized from 1 µg of total RNA using the Transcriptor First Strand cDNA Synthesis Kit (Roche, Cat. No. 04 379 012 001) using both random hexamer and anchored oligo (dT18) primers.
QRT-PCR
PCR was performed on a 7300 Real-Time PCR System (Applied Biosystems). TaqMan Assays supplied by Life Technologies were used to interrogate p73 transcripts containing the transactivation domain (TA isoforms; Hs01056228_m1), transcripts lacking the transactivation domain (ΔN isoforms; Hs01065727_m1). Optimized reaction conditions utilized 1µL 20X TaqMan assay (Life Technologies), 100 ng cDNA, and 10 µL TaqMan Universal PCR Master Mix (Life Technologies, Cat No: 4304437). The cycling profile for each run was 50°C for 2 min, 95°C for 10 min, and 40 cycles of 95°C for 15 s, followed by 60°C for 10 min, using the default ramp rate. Glyceraldehyde-3-phosphate dehydrogenase (GAPDH) was amplified as an endogenous control. Expression levels were calculated using the 2−ΔCT method.
DNA isolation and bisulfite conversion
Genomic DNA was extracted using Gentra Puregene Cell Kit (Qiagen, Cat No./ID: 158388) and quantified using a Nanodrop 8000 (Thermo Scientific). Bisulfite conversion of 1 µg genomic DNA was performed to convert all unmethylated cytosines to uracils while leaving the methylated cytosines unchanged (EZ DNA Methylation- Lightning Kit; Zymo).
Pyrosequencing
Pyrosequencing assays were developed to determine the methylation status in the extrinsic P1 promoter of TAp73 isoforms and the intrinsic P2 promoter of ΔNp73 isoforms.P1 promoter was analyzed using PyroMark CpG Assay (Hs_CG07382920_03_PM). For P2 promoter region, the forward primer used was GGAAGGAGTTTTGGTGGGTTTAATT, reverse biotinylated primer-CACCCCTTTATTCCTCATAAATATTCA, Sequencing primer- GGTGGGTTTAATTATGG. The primer sets were mixed with bisulfite converted DNA and PCR was performed using Qiagen’s PyroMark PCR Kit (Cat No: 978703), following manufacturer instructions. The PCR products were bound to Streptavidin Sepharose High-Performance beads (GE Healthcare Life Sciences, Cat No: 17–5113-01). A sequencing primer was then allowed to anneal to the PCR product for 5 minutes at 80°C. The sequencing reaction utilized PyroMark Advanced Q24 Reagents (Qiagen, Cat No: 970902) and was carried out using a PyroMark Q24 System and PyroMark Software 2.0 (Qiagen). Percentage methylation was calculated by averaging across all CpG sites interrogated.
Western blot
Cells were cultured to 75–80% confluence and lysed in Triton X-100/SDS lysis buffer (1% Triton X-100, 0.1% SDS, 50mM Tris, 150mM NaCl) containing protease inhibitors (Roche, Cat No: 4693159001). Protein concentrations were determined using Bio-Rad protein assay. Equal amounts of protein lysates (40ug) were resolved on a 4–20% gradient SDS-PAGE and electrotransferred onto PVDF membranes. Blots were incubated with primary antibodies specific to TAp73 (1:1000, Bethyl Laboratories, Cat No: A300-126A), DNMT1 (1:1000, Cell Signaling, Cat No: (D63A6) XP® Rabbit mAb #5032), Histone H3 (1:1000, Cat No: (D1H2) XP® Rabbit mAb #4499) overnight at 4°C. HRP-conjugated secondary antibodies were detected using Luminata Crescendo Western HRP Substrate. The membranes were stripped using Restore Plus Western Blot Stripping Buffer (Thermo Scientific, Cat No: 46428) and GAPDH antibody (1:2000, # ab9485, Abcam) was used for assessment of protein loading.
Clonogenic assay
A clonogenic assay was performed to examine the in vitro effects of 5-Aza-2ʹ-deoxycytidine on tumor cell sensitivity to cisplatin. T24/CR-T24 cells were plated and incubated for 24 hours. After attachment, cells were pretreated with either 2 uM DAC or control media for 48 hours. Cells were then either treated with 1 ug/mL cisplatin or control media. Treated cells were then trypsinized and reseeded in triplicate in a six well plate. After a 10 day incubation period at 37°C in a humidified atmosphere containing 5% CO2, cell monolayers were washed with PBS, fixed with 4% glutaraldehyde and stained with 0.5% crystal violet. Colonies were counted using a light microscope. To calculate surviving fraction, we divided the cloning efficiency of treated cells by the cloning efficiency of untreated control cells.
Statistical analysis
The association between H-score with grade and phenotype was evaluated using the Kruskal-Wallis exact test, with pairwise comparisons made using the Bonferroni adjusted Wilcoxon rank sum test. Overall survival and progression-free survival was evaluated by using standard Kaplan-Meier survival curves with comparisons made using log-rank tests. All analyses were performed using SAS for Windows, version 9.4 (SAS Institute, Inc., Cary, NC). P < .05 was considered statistically significant.
Supplemental Material
Download Zip (1,016 KB)Disclosure statement
No potential conflict of interest was reported by the authors.
Supplementary material
Supplemental data for this article can be accessed here.
Related Research Data
References
- Siegel RL, Miller KD, Jemal A. Cancer statistics, 2019. CA Cancer J Clin. 2019;69:7–34.
- Stenzl A, Cowan NC, De Santis M, et al. Treatment of muscle-invasive and metastatic bladder cancer: update of the EAU guidelines. Eur Urol. 2011;59:1009–1018.
- Black P, So A. Perioperative chemotherapy for muscle-invasive bladder cancer. Can Urol Assoc J. 2009;3:S223–S7.
- Grossman HB, Natale RB, Tangen CM, et al. Neoadjuvant chemotherapy plus cystectomy compared with cystectomy alone for locally advanced bladder cancer. N Engl J Med. 2003;349:859–866.
- Hashimoto K, Shindo T, Itoh N. Efficacy of neoadjuvant gemcitabine and cisplatin in the management of muscle-invasive urothelial carcinoma of the bladder. Nihon Hinyokika Gakkai Zasshi. 2015;106:1–6.
- Chang FL, Lai MD. The relationship between p53 status and anticancer drugs-induced apoptosis in nine human bladder cancer cell lines. Anticancer Res. 2000;20:351–355.
- Gore JL, Lai J, Setodji CM, et al. Mortality increases when radical cystectomy is delayed more than 12 weeks: results from a surveillance, epidemiology, and end results-medicare analysis. Cancer. 2009;115:988–996.
- Das PM, Singal R. DNA methylation and cancer. J Clin Oncol. 2004;22:4632–4642.
- Esteller M. Dormant hypermethylated tumour suppressor genes: questions and answers. J Pathol. 2005;205:172–180.
- Besaratinia A, Cockburn M, Tommasi S. Alterations of DNA methylome in human bladder cancer. Epigenetics. 2013;8:1013–1022.
- Kandimalla R, van Tilborg AA, Zwarthoff EC. DNA methylation-based biomarkers in bladder cancer. Nat Rev Urol. 2013;10:327–335.
- Kim YJ, Kim WJ. Can we use methylation markers as diagnostic and prognostic indicators for bladder cancer? Investig Clin Urol. 2016;57(Suppl 1):S77–88.
- Maruyama R, Toyooka S, Toyooka KO, et al. Aberrant promoter methylation profile of bladder cancer and its relationship to clinicopathological features. Cancer Res. 2001;61:8659–8663.
- Sathyanarayana UG, Maruyama R, Padar A, et al. Molecular detection of noninvasive and invasive bladder tumor tissues and exfoliated cells by aberrant promoter methylation of laminin-5 encoding genes. Cancer Res. 2004;64:1425–1430.
- Yates DR, Rehman I, Abbod MF, et al. Promoter hypermethylation identifies progression risk in bladder cancer. Clin Cancer Res. 2007;13:2046–2053.
- Urakami S, Shiina H, Enokida H, et al. Combination analysis of hypermethylated Wnt-antagonist family genes as a novel epigenetic biomarker panel for bladder cancer detection. Clin Cancer Res off J Am Assoc Cancer Res. 2006;12:2109–2116.
- Wolff EM, Chihara Y, Pan F, et al. Unique DNA methylation patterns distinguish noninvasive and invasive urothelial cancers and establish an epigenetic field defect in premalignant tissue. Cancer Res. 2010;70:8169–8178.
- Schlichtholz B, Presler M, Matuszewski M. Clinical implications of p53 mutation analysis in bladder cancer tissue and urine sediment by functional assay in yeast. Carcinogenesis. 2004;25:2319–2323.
- Uchida T, Wada C, Ishida H, et al. p53 mutations and prognosis in bladder tumors. J Urol. 1995;153:1097–1104.
- Flores ER, Sengupta S, Miller JB, et al. Tumor predisposition in mice mutant for p63 and p73: evidence for broader tumor suppressor functions for the p53 family. Cancer Cell. 2005;7:363–373.
- Tomasini R, Tsuchihara K, Wilhelm M, et al. TAp73 knockout shows genomic instability with infertility and tumor suppressor functions. Genes Dev. 2008;22:2677–2691.
- Melino G, De Laurenzi V, Vousden KH. p73: friend or foe in tumorigenesis. Nat Rev Cancer. 2002;2:605–615.
- Murray-Zmijewski F, Lane DP, Bourdon JC. p53/p63/p73 isoforms: an orchestra of isoforms to harmonise cell differentiation and response to stress. Cell Death Differ. 2006;13:962–972.
- Moll UM, Slade N. p63 and p73: roles in development and tumor formation. Mol Cancer Res. 2004;2:371–386.
- Thanos CD, Bowie JU. p53 Family members p63 and p73 are SAM domain-containing proteins. Protein Sci. 1999;8:1708–1710.
- Ciamporcero E, Shen H, Ramakrishnan S, et al. YAP activation protects urothelial cell carcinoma from treatment-induced DNA damage. Oncogene. 2016;35:1541–1553.
- Esteller M. Epigenetic gene silencing in cancer: the DNA hypermethylome. Hum Mol Genet. 2007;16(Spec No 1):R50–9.
- Stiewe T, Zimmermann S, Frilling A, et al. Transactivation-deficient ΔTA-p73 acts as an oncogene. Cancer Res. 2002;62:3598–3602.
- Ishimoto O, Kawahara C, Enjo K, et al. Possible oncogenic potential of DeltaNp73: a newly identified isoform of human p73. Cancer Res. 2002;62:636–641.
- Rufini A, Agostini M, Grespi F, et al. p73 in Cancer. Genes Cancer. 2011;2:491–502.
- Grob TJ, Novak U, Maisse C, et al. Human delta Np73 regulates a dominant negative feedback loop for TAp73 and p53. Cell Death Differ. 2001;8:1213–1223.
- Conforti F, Yang AL, Agostini M, et al. Relative expression of TAp73 and DeltaNp73 isoforms. Aging (Albany NY). 2012;4:202–205.
- Muller M, Schilling T, Sayan AE, et al. TAp73/Delta Np73 influences apoptotic response, chemosensitivity and prognosis in hepatocellular carcinoma. Cell Death Differ. 2005;12:1564–1577.
- Ramakrishnan S, Hu Q, Krishnan N, et al. Decitabine, a DNA-demethylating agent, promotes differentiation via NOTCH1 signaling and alters immune-related pathways in muscle-invasive bladder cancer. Cell Death Dis. 2017;8:3217.