
ABSTRACT
Sirtuin1 (SIRT1) has recently emerged as a pivotal regulator of glucose metabolism and insulin sensitivity. However, the underlying mechanism has not been fully elucidated. In this study, we investigated the role of SIRT1 in the development of obesity and insulin resistance by generating mice with adipose-specific ablation of Sirt1 (Ad-Sirt1-/- mice). Ad-Sirt1-/- mice exhibited increased fat mass, impaired glucose tolerance, attenuated insulin sensitivity, and increased exosomes, whereas the administration of exosomes inhibitor effectively ameliorated the impaired metabolic profile in Ad-Sirt1-/- mice. Moreover, the increased exosomes were proved to be a result of defective autophagy activity in Ad-Sirt1-/- mice and restoration of SIRT1 activity efficiently improved metabolic profiles in vitro. Further study demonstrated that Sirt1 deficiency-induced exosomes modulated insulin sensitivity at least partially via the TLR4/NF-κB signaling pathway. Therefore, our findings implicated SIRT1 as a key factor in metabolic regulation, and adipose Sirt1 deficiency could exert an effect on the development of obesity and insulin resistance by promoting exosome release.
Introduction
Adipose tissue plays a key role in systemic metabolic homeostasis, which not only acts as an energy storage but also functions as an important endocrine organ to secrete a variety of adipokines and hormones (such as leptin, adiponectin and tumor necrosis factor α) [Citation1,Citation2]. Adipose dysfunction could lead to abnormal adipokine secretion, larger adipocyte size and excessive deposition of lipid, thus resulting in metabolic diseases such as nonalcoholic fatty liver, obesity and type 2 diabetes. In fact, obesity is closely related to insulin resistance, and obesity-induced insulin resistance is one of the most important risk factors for the development of type 2 diabetes [Citation2–Citation4].
Emerging evidence has shown that adipose Sirt1 have important effects on the development of obesity and insulin resistance [Citation5–Citation10]. SIRT1 is a highly conserved NAD+-dependent protein deacetylase, which participates in the regulation of cell senescence, inflammation, autophagy, insulin sensitivity as well as glucose and lipid metabolism through lysine residue deacetylation on both histone or non-histone proteins [Citation5,Citation11–Citation14]. Selective overexpression of Sirt1 in adipose tissue enhances energy homeostasis and prevents aging-associated metabolic disorders, such as blunted insulin sensitivity, suggesting that adipose Sirt1 is a key player in maintaining systemic energy homeostasis and insulin sensitivity [Citation6]. Sirt1 gene expression in adipose tissue and peripheral blood mononuclear cells was significantly suppressed in obese subjects compared to control subjects, and down-regulation of Sirt1 may contribute to obesity-associated metabolic abnormalities [Citation15,Citation16]. It was reported that adipocyte-specific Sirt1 deficiency led to increased whole-body adiposity and Ad-Sirt1-/- mice were predisposed to insulin resistance and obesity [Citation7]. However, a recent study revealed that Ad-Sirt1-/- mice aggravated HFD-induced insulin resistance independent of adiposity [Citation10]. Additionally, there were confusing results that Ad-Sirt1-/- mice exhibited impaired glucose and insulin tolerance in the context of chow diet or short-term HFD exposure, while Ad-Sirt1-/- mice became more glucose tolerant and insulin sensitive than control mice when challenged with chronic HFD [Citation9]. Consequently, much remains to be elucidated regarding the underlying role of SIRT1 in the development of obesity and insulin resistance.
Exosomes are a class of extracellular vesicles, sized around 100 nm in diameter, and were suggested involving in the pathologies of obesity and insulin resistance [Citation17,Citation18]. For example, exosomes control lipid storage and cell size in adipocytes [Citation19]. Adipose tissue of obese mice secretes more exosomes which are associated with systemic insulin resistance [Citation20,Citation21]. In fact, an increasing number of exosomes have been shown to correlate with a higher risk of obesity and insulin resistance [Citation17,Citation18,Citation20]. Besides, exosomes simultaneously orchestrate insulin signaling in peripheral tissues [Citation18,Citation20–Citation22]. Exosomes also could contribute to aging and Alzheimer’s Disease, which are accompanied by decreased SIRT1 activity [Citation11,Citation23,Citation24]. Additionally, myotube-derived exosomal miRNAs were suggested to downregulate SIRT1 during muscle cell differentiation [Citation25].
Collectively, these studies support a pivotal regulatory role of SIRT1 and exosomes in the development of obesity and insulin resistance. In the present study, we aimed to characterize the definite role of SIRT1 and to address the potential interaction of adipose SIRT1 and exosomes during this process. Our results provide evidence that adipose-specific knockdown of Sirt1 induced increased exosomes which in turn led to excessive fat accumulation, disordered glucose and lipid metabolism as well as impaired insulin sensitivity, thus contributing to the development of obesity and insulin resistance. We also demonstrated that Ad-Sirt1-/-–derived exosomes impaired insulin signaling at least partially through TLR4/NF-κB signaling pathway. These findings may be helpful for understanding the pathogenesis of obesity and insulin resistance, thereby providing novel therapeutic strategies for the treatment of these metabolic dysfunctions.
Materials and methods
Animals
B6.129-Tg (Adipoq-cre/Esr1*)1Evdr/J mice were purchased from the Jackson Laboratory (stock number:024671). Sirt1flox/flox mice was a kind gift from Professor Xiang Gao of Nanjing University [Citation26]. The experimental animals used in the present study were generated by a two-step breeding strategy. Hemizygous Adipoq-CreER transgenic mice were crossed with homozygous Sirt1-flox mice to generate heterozygous Sirt1-flox offspring with an Adipoq-Cre allele. These offsprings were then crossed with homozygous Sirt1-flox mice to generate the following offspring: Adipoq-Cre+;Sirt1flox/flox and Adipoq-Cre-;Sirt1flox/flox. The Cre transgene was detected by PCR with a thermal cycler (BIO-RAD, PTC-1148, Singapore) using the primers: Common Forward, 19212, 5ʹ- CTC TGG GAG AGG CGA GTA TG-3ʹ, Wild-type Reverse,19213, 5ʹ-TAA CGT CAT CTT CGG CAT GA-3ʹ, Mutant Reverse, oIMR9377, 5ʹ- ATG TTT AGC TGG CCC AAA TG-3ʹ. The 425-base pair (bp) PCR product was detected as a transgene, and the 207-bp PCR product was detected as an internal positive control. The sequences of PCR primers for genotyping Sirt1flox/flox mice are as follows: Forward,7909, 5ʹ- GGT TGA CTT AGG TCT TGT CTG-3ʹ, Reverse, 7912, 5ʹ- CGT CCC TTG TAA TGT TTC CC-3ʹ. Only 705-bp PCR product can be detected in homozygous Sirt1flox/flox mice, and only 505-bp PCR product can be detected in wild-type mice. The 705-bp and 505-bp PCR products were both detected in heterozygous mice (Sirt1flox/wt). For inhibition of exosome secretion in vivo, 16-week-old mice were injected intraperitoneally every 3 days for 1 month with GW4869 (2.5 mg/kg) or glutathione (20 mg/kg), respectively. For the insulin signaling test, mice were injected intraperitoneally with insulin (2 IU/kg) at the end of the study period. Fifteen minutes later, the animals were euthanized and the tissue samples were collected and stored at -80°C until analysis. The Adipoq-Cre+;Sirt1flox/flox mice were viable and fertile in the absence of tamoxifen. Mice were housed on a 12-h light/dark cycle and given ad libitum access to water and regular diet. All studies were performed in accordance with the Institutional Animal Care and Use Committee of Xi’an Jiaotong University.
Tamoxifen administration
Tamoxifen (Sigma-Aldrich, T5648) was dissolved in a small volume of ethanol, diluted with corn oil (Sigma-Aldrich, C8267) at a concentration of 20 mg/ml, and stored at -20°C until use. Mice were injected intraperitoneally with tamoxifen (0.2 mg/mouse) at 9–12 days after birth. And for adult stages, mice were intraperitoneally injected with tamoxifen (50 mg/kg body weight) once a week from 8 week until dissection at 20 week.
Cell culture and treatment
3T3-L1 preadipocytes, BNL.CL2 hepatocytes were purchased from the American Type Culture Collection (ATCC) and cultured in DMEM with 10% fetal bovine serum (HyClone). 3T3-L1 preadipocytes were induced to differentiate into mature adipocytes with cocktail induction media (0.5 mM isobutylmethylxanthine, 1 μM dexamethasone, 10 μg/mL insulin and DMEM with 10% FBS) and insulin media (10 μg/ml insulin and DMEM with 10% FBS), in turn, every 2 days. And four days later, the culture media was changed to 10% FBS/DMEM, and change the fresh medium every two days. Full differentiation is usually achieved on the 12th day. The primary adipocytes were obtained and cultured under the standard protocol. For insulin signaling, cells were stimulated with 10 nM insulin for 10 min. For the restoration of autophagic activity, primary adipocytes was treated with 10 nM rapamycin for 4 h. To investigate the in vitro effects of exosomes, exosomes obtained from 0.1 g of adipose tissue were used to treat adipocytes and hepatocytes for 24 h, respectively.
Gene silencing
Gene silencing was performed according to the manufacturer’s instructions. Cells were transfected with Atg7 siRNA (Santa Cruz, sc-41448) or Tlr4 siRNA (Santa Cruz, sc-40261) using lipofectamine 2000 (Invitrogen). An siRNA consisting of a scrambled sequence of similar length was used as a control siRNA. The cells seeded in 6-well plates were transfected with siRNA and cultured in DMEM containing 10% FBS for 72 h.
Isolation of exosomes
Fresh blood was collected in heparin anticoagulant tubes and inverted 8–10 times without shaking for proper mixing with an anticoagulant. The blood samples were then centrifuged at 1500 g for 15 min to obtain plasma. And plasma exosomes were isolated using Total Exosome Isolation (from plasma) (Thermo Fisher Scientific, Item number:4484450) according to the manufacturer’s instructions. Exosomes in cell culture media were isolated using Total Exosome Isolation (from cell culture media) (Thermo Fisher Scientific, Item number: 4478359) as recommended by the manufacturer. To isolate exosomes derived from tissues, the adipose tissue of 20-week-old mice was washed with PBS and cut into small pieces, then transferred to six-well plates containing serum-free DMEM (24 h). Exosomes were isolated using differential centrifugation as previously reported [Citation18]. Briefly, cell debris and organelles were eliminated by centrifugation at 300 g for 10 min and the supernatant was centrifuged at 2,000 g for 20 min to eliminate the larger vesicles. The supernatant obtained was centrifuged at 10,000 g for 30 min and filtered using a 0.2 μm filter to eliminate microvesicles. Ultracentrifugation (100,000 g for 70 min at 4°C) was performed to pellet exosomes with Ultra-Centrifuge (OPTIMA L100XP, Beckman). Then, the pellet was washed with PBS to reduce its contamination by soluble proteins and ultracentrifuged at 100,000 g for 70 min at 4°C again. The final pellet enriched with exosomes was resuspended in PBS and quantified by Bradford protein assay.
Transmission electron microscopy
Firstly, 20 µl exosome samples were loaded onto Formvar-carbon-coated grids for 20 min at room temperature. Secondly, excess exosome samples on the grids were removed with a clean filter paper. Then, the grids were stained with 1% uranyl acetate for 1 min, dried and examined by the transmission electron microscopy (H-7650, Japan) [Citation27].
Metabolic studies
For glucose tolerance tests (GTT), mice were starved overnight and injected intraperitoneally with 10% glucose at a dose of 1 g/kg body weight; for insulin tolerance tests (ITT), mice were starved for 5 h and injected intraperitoneally with 0.75U/kg body weight recombinant human insulin. And blood was obtained from the mouse tail at time points 0, 15, 30, 60, 90, and 120 min for glucose measurement in GTT and ITT. In our study, GTT and ITT were performed in mice at the age of 8 weeks and 20 weeks. The fasting blood glucose was measured by a blood glucose meter. Plasma glycerol and FFA were determined using Free Glycerol Reagent (Sigma) and Free Fatty Acid Quantitation Kit (Sigma), respectively. The plasma levels of leptin and adiponectin were measured by Mouse Leptin ELISA Kit (Sigma) and Mouse Adiponectin ELISA Kit (Sigma), respectively. Hepatic triglyceride contents were measured using a triglyceride detection kit (Sigma). Insulin-stimulated glucose uptake in adipose tissue was performed as described [Citation10,Citation28]. Briefly, primary adipocytes were isolated from epididymal adipose tissue of control and Ad-Sirt1-/- mice. Cells fasted overnight were changed to glucose-free KRH buffer and stimulated with 100 nM insulin or vehicle control for 13 min. Glucose uptake was initiated by addition of 2-deoxyglucose (Sigma) to a final concentration of 100 μM and 0.5 μCi 1-deoxy-D-2-[1,2-3H(N)]glucose (Perkin Elmer) per well in glucose-free KRH buffer. After incubation for 15 min, cells were washed twice by ice-cold KRH buffer plus 25 mM glucose and lysed in 10% SDS and counted for radioactivity in Ultima Gold scintillation cocktail (Perkin Elmer) using an LS6500 Multi-Purpose Scintillation Counter (Beckman Coulter). Non-carrier-mediated uptake was determined in the presence of 5 μM cytochalasin B (Sigma) and deducted from the totals, which were normalized by protein concentrations. For the measurement of glucose uptake in mature 3T3-L1 adipocytes, the cells were incubated with 100 μM insulin for 10 min and 50 μM 2-(N-(7-nitrobenz-2-oxa-1,3-diazol-4-yl)amino)- 2-deoxyglucose (2-NBDG) for 15 min, after the treatment of purified exosomes for 24 h. The cellular uptake of 2-NBDG was measured using a microplate reader at excitation and emission wavelengths of 465 nm and 540 nm, respectively.
Autophagy flux analysis
Autophagy flux analysis was performed as previously described [Citation29,Citation30]. Briefly, adipose tissue explants were cut into small fragments and incubated in the complete medium (DMEM with 2 mM glutamine, 1% antibiotic solution, and 10% FBS) for 1 h. Then, the tissue fragments were incubated in the complete medium supplemented with chloroquine (Sigma) for 4 h. And the lysates were immediately prepared for western blot analysis.
mRNA isolation and analysis by real-time PCR
Total RNA was extracted from adipose tissues, liver or muscle tissues with Trizol reagent (Invitrogen) and converted into cDNA using a cDNA synthesis kit (Thermo Fisher Scientific). Quantitative real-time PCR was performed using SYBR Green in the 7300 Real-Time PCR System (Applied Biosystems). The gene expression levels were normalized by the average levels of Gapdh.
Western blot analyses
Western blot analysis was carried out according to standard protocol. The following antibodies were used: anti-SIRT1 (1:1000), anti-ATG7 (1:1000), anti-LC3 (1:500), anti-pAKT (Ser473) (1:1000), anti-AKT (1:1000), anti-CD63 (1:500) and anti-ALIX (1:500), anti-NF-κB (1:1000) and anti-adiponectin (1:1000) (Abcam); anti-IRS-1 (1:300), anti-pY20 (1:300), TLR4 (1:200) and anti-P62 (1:200) (Santa Cruz); anti-IKKβ (1:1000) and anti-pIκBα (1:1000) (Cell Signaling Technology).
Statistical analysis
Statistical analysis was performed with SPSS 17.0 software (SPSS Inc., Chicago, IL, USA). Data were calculated from three to four independent experiments and presented as means ± SEM. Statistical analysis was performed using two-tailed Student’s t-tests for two groups and one-way ANOVA for more than two groups. A value of P< 0.05 was considered statistically significant.
Results
Increased body weight and fat mass in Ad-Sirt1-/-mice
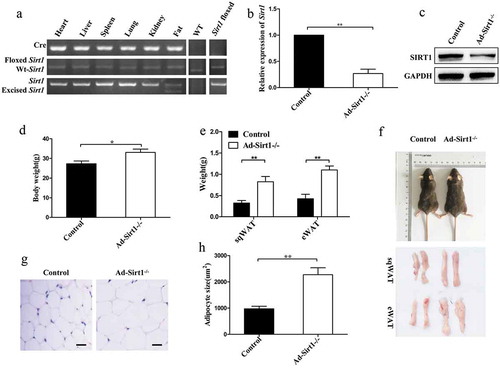
Evidently strong reduction of SIRT1 expression was observed in the adipose tissue of Ad-Sirt1-/- mice compared to control mice, indicating adipose-specific knockdown of Sirt1 (. And Ad-Sirt1-/- mice exhibited remarkably increased body weight and fat mass (). Consistently, larger adipocyte size was observed in Ad-Sirt1-/- mice (). In contrast to the difference in fat mass, there was no significant difference in the weight of heart, liver, spleen, lung, and kidney between control and Ad-Sirt1-/- mice (data not shown), suggesting that expanded fat may be responsible for the increased body mass in Ad-Sirt1-/- mice.
Figure 1. Increased body weight and fat mass in Ad-Sirt1-/- mice at the age of 20 weeks.
(a): PCR products amplified from genomic DNA isolated from different tissues of Ad-Sirt1-/- mice as well as adipose tissue from wild-type and control (Sirt1flox/flox) mice. (b): Real-time PCR analysis of Sirt1 expression in adipose tissues. (c): Western blot analysis of SIRT1 expression in the adipose tissue. (d): Body weight. n = 10 mice per group. (e): Subcutaneous and epididymal fat mass. n = 8–10 mice per group. (f): Representative picture of the body, subcutaneous fat and epididymal fat of control and Ad-Sirt1-/- mice at the age of 8 weeks. (g): Representative H&E stain images of epididymal adipose tissue isolated from 8-week-old control and Ad-Sirt1-/- mice. Scale bars, 25 µm. (h): Adipocyte size quantification for epididymal adipose tissue from 8-week-old mice. n = 6–8 mice per group. The data are expressed as the mean ± SEM. *P < 0.05, **P < 0.01.
Ad-Sirt1-/-mice develop insulin resistance
Given that Ad-Sirt1-/- mice exhibited increased fat mass and body weight, we next investigated the effect of adipose Sirt1 deficiency on insulin sensitivity. Ad-Sirt1-/- mice exhibited impaired glucose tolerance and insulin sensitivity at 20 weeks of age, as assessed by glucose tolerance tests (GTT) and insulin tolerance tests (ITT) (). Consistently, Ad-Sirt1-/- mice showed significantly higher levels of fasting blood glucose than control mice (Supplementary Fig. 1A). Despite the increased body weight and fat mass were evident in Ad-Sirt1-/- mice as early as 8 weeks old (), no significant change in glucose and insulin tolerance was observed in Ad-Sirt1-/- mice at this age (data not shown).
Figure 2. 20-week-old Ad-Sirt1-/- mice develop insulin resistance.
Glucose tolerance tests (a) and insulin tolerance tests (b). n = 8–10 mice per group. Western blot analysis of insulin signaling in adipose tissue (c) and liver (d). Fasting plasma levels of adiponectin (e) and leptin (f). n = 8 mice per group. The data are expressed as the mean ± SEM. *P< 0.05, **P < 0.01, ***P < 0.001.
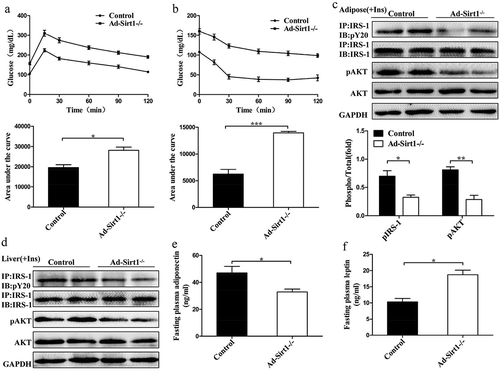
To gain further insight into insulin sensitivity, we then examined insulin signaling in adipose tissue, liver, and skeletal muscle. Impaired insulin signaling was observed in the adipose tissue and liver of Ad-Sirt1-/- mice, as evidenced by reduced tyrosine phosphorylation of IRS-1 and serine phosphorylation of AKT (). However, the phosphorylation levels of IRS-1 and AKT remained hardly change in the skeletal muscle of Ad-Sirt1-/- mice compared to controls (Supplementary Fig. 1B). Fasting plasma levels of adiponectin were evidently reduced in Ad-Sirt1-/- mice (), while the leptin levels were significantly higher in Ad-Sirt1-/- mice possibly as a result of the increased fat mass ().
Ad-Sirt1-/- mice exhibit impaired glucose and lipid metabolism
Since Ad-Sirt1-/- mice developed obesity and insulin resistance, we next explored the glucose and lipid metabolism in these mice. Firstly, reduced glucose uptake was observed in the adipose tissue of Ad-Sirt1-/- mice compared to control mice (), while there was no significant difference in glucose uptake of the skeletal muscle between these two groups of mice (data not shown). Then, we observed markedly lower β-oxidation rates in the adipose tissues of Ad-Sirt1-/- mice than controls, as evidenced by significantly lower mRNA expression of β-oxidation-related genes, such as Ppara and Acadl (). While no significant difference in the β-oxidation rates of liver or skeletal muscle was identified between control and Ad-Sirt1-/- mice (data not shown). We next measured parameters of lipolysis which correlated to fat mass in addition to β-oxidation. Compared to controls, higher fasting plasma glycerol concentrations were observed in Ad-Sirt1-/- mice (), indicating increased lipolysis rates in the enlarged adipose tissue. In line with this, higher mRNA expression of the lipolysis-related genes, such as Lipe, Mgll, and Pnpla2 were observed in the adipose tissue of Ad-Sirt1-/- mice (). Moreover, higher fasting plasma levels of free fatty acids (FFA) were observed in Ad-Sirt1-/- mice (), which could be a result of both enhanced lipolysis and reduced β-oxidation.
Figure 3. Ad-Sirt1-/- mice exhibit impaired glucose and lipid metabolism.
(a): Glucose uptake in adipose tissue. n = 6–8 mice per group. (b): Relative mRNA levels of genes associated with β-oxidation in adipose tissues. (c): Fasting plasma levels of glycerol. n = 8 mice per group. (d): Relative mRNA levels of lipolysis-related genes in the adipose tissue. (e): Fasting plasma levels of FFA. n = 8 mice per group. (f): Relative mRNA levels of genes associated with fatty acid and TG synthesis in the liver. (g): Hepatic triglyceride content in mice. n = 7–9 mice per group. (h): Relative mRNA levels of genes associated with gluconeogenesis in the liver. The data are expressed as the mean ± SEM. *P< 0.05, **P < 0.01.
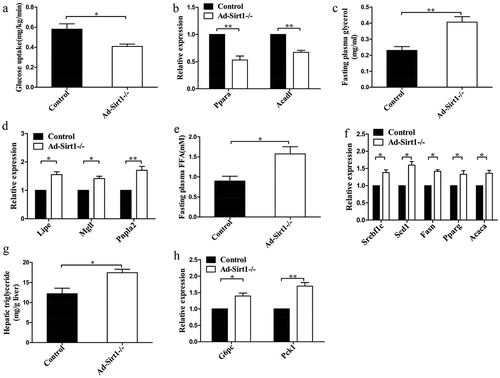
Compared to control mice, the relative mRNA expression of genes related to fatty acid and TG synthesis was remarkably higher in the liver of Ad-Sirt1-/- mice, including Srebf1c, Scd1, Fasn, Pparg and Acaca (). Consistently, a markedly increased trend in hepatic triglyceride content was observed in Ad-Sirt1-/-mice (). The increased hepatic lipid accumulation could result from enhanced endogenous hepatic fatty acid synthesis and increased exogenous fatty acid supply from the accumulated adipose mass. Additionally, Ad-Sirt1-/- mice exhibited enhanced gluconeogenesis, as evidenced by significantly higher mRNA expression of gluconeogenic genes such as G6pc and Pck1 (), which may be responsible for hyperglycemia in Ad-Sirt1-/- mice.
Increased exosomes in Ad-Sirt1-/- mice
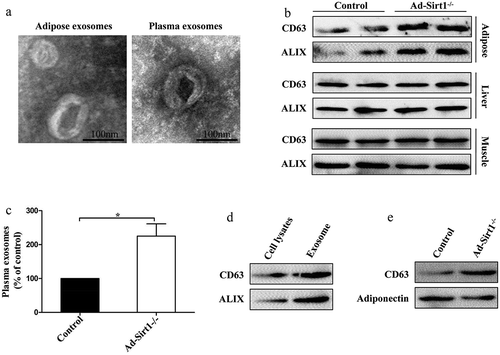
Emerging evidence revealed that exosomes might interact with SIRT1 activity in some metabolic abnormalities, and there may a close connection between SIRT1 and exosomes [Citation11,Citation23,Citation25]. Thus, we determined whether adipose Sirt1 deficiency-induced obesity and insulin resistance are mediated by exosomes. First of all, the transmission electron microscope was used to examine extracellular vesicle particles we obtained, in order to make sure that the particles we obtained were exosomes. The diameters of the particles isolated from adipose tissue and plasma of mice were around 100 nm, which is consistent with a previous study [Citation18](). Moreover, the electron micrographs showed that the appearance of the particles we obtained was highly similar to another study [Citation17](). Ad-Sirt1-/- mice exhibited markedly more exosomes in the adipose tissue than control mice, as evidenced by higher expression levels of exosome marker proteins (CD63 and ALIX) (). In parallel, remarkably higher plasma levels of exosomes were observed in Ad-Sirt1-/- mice compared to controls (). However, we found no significant difference in exosomes secretion of the liver and muscle between control and Ad-Sirt1-/- mice (). Our results also demonstrated that isolated particles from adipose tissues of mice were enriched in exosomal proteins compared to total adipocyte lysates (). Moreover, the exosomal protein marker CD63 and adipocyte-specific marker adiponectin were clearly detectable on exosomes isolated from plasma of mice (). Hence, we inferred that increased plasma exosomes might be attributed for increased secretion of adipocyte-derived exosomes in Ad-Sirt1-/- mice, indicating that exosomes produced in Sirt1-deficient adipose tissue may have a systemic effect on metabolic regulation.
Figure 4. Increased exosomes in Ad-Sirt1-/- mice.
(a): Electron micrographs of exosomes isolated from adipose tissue and plasma. (b): Western blot analysis of exosomes marker proteins expression in adipose, liver and muscle tissues. (c): Semi-quantification of exosomes concentration in plasma of control and Ad-Sirt1-/- mice by Bradford protein assay. n = 8–10 mice per group. (d): Western blot analysis of exosomal proteins in adipocyte lysates and purified exosomes. (e): Western blot analysis of exosomal proteins and adipocyte-specific protein in exosomes isolated from plasma of mice. The data are expressed as the mean ± SEM. *P< 0.05.
Inhibition of exosomes secretion reverses the impaired metabolism in Ad-Sirt1-/- mice
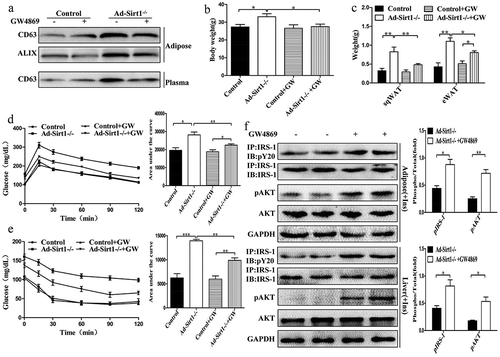
We then administered control and Ad-Sirt1-/- mice with GW4869, a widely used pharmacological agent for blocking exosome generation. Reduced exosomes were observed in the adipose tissue and plasma of Ad-Sirt1-/- mice treated with GW4869 compared to the vehicle-treated group (Ad-Sirt1-/- mice); however, there was no significant difference in exosomes secretion between control mice (Sirt1f/f mice) which were treated with GW4869 or vehicle (). As expected, the higher body weight and increased fat mass in Ad-Sirt1-/- mice compared to control mice were attenuated in Ad-Sirt1-/- mice after administration of GW4869 (). Ad-Sirt1-/- mice treated with GW4869 exhibited higher degrees of glucose and insulin tolerance as well as lower levels of fasting blood glucose than the vehicle-treated group (, Supplementary Fig. 2A). In terms of peripheral insulin sensitivity, increased adipose and hepatic insulin sensitivity were observed in Ad-Sirt1-/- mice exposure to GW4869, as evidenced by higher phosphorylation levels of IRS-1 and AKT in these two tissues compared to the vehicle-treated group (). And GW4869 treatment reversed the reduced glucose uptake (Supplementary Fig. 2B) and β-oxidation rates (Supplementary Fig. 2C) but also reversed the enhanced lipolysis in the adipose tissues of Ad-Sirt1-/- mice (Supplementary Fig. 2D-F). Ad-Sirt1-/- mice treated with GW4869 had lower hepatic triglycerides compared to the vehicle-treated group (Supplementary Fig. 2G). Furthermore, GW4869 administration reversed the enhanced lipogenesis and gluconeogenesis in Ad-Sirt1-/- mice (Supplementary Fig. 2H and I). Collectively, treatment of GW4869 could improve the impaired glucose and lipid metabolism in Ad-Sirt1-/- mice, indicating a causative role of exosomes in adipose Sirt1 deficiency-induced obesity and insulin resistance.
Figure 5. GW4869 treatment reverses the impaired metabolism in Ad-Sirt1-/- mice.
(a): Expression of the exosomal protein in adipose tissue and plasma from control and Ad-Sirt1-/- mice in the absence or presence of GW4869 (abbreviated as “GW” in this figure). Bodyweight (b) and fat mass (c). n = 8–10 mice per group. Glucose tolerance tests (d) and insulin tolerance tests (e). n = 8–10 mice per group. F: Western blot analysis of adipose and hepatic insulin sensitivity in Ad-Sirt1-/- mice in the absence or presence of GW4869. n = 7–10 mice per group. The data are expressed as the mean ± SEM. *P< 0.05, **P < 0.01, ***P < 0.001.
Likewise, mice with the treatment of glutathione (another common inhibitor of exosomes secretion) exhibited a phenotype similar to that of GW4869-treated mice. Compared to vehicle-treated group, Ad-Sirt1-/- mice treated with glutathione exhibited reduced exosomes secretion (Supplementary Fig. 3A), decreased body weight and fat mass (Supplementary Fig. 3B and C). The impaired glucose tolerance and insulin sensitivity in Ad-Sirt1-/- mice were also ameliorated by the treatment of glutathione (Supplementary Fig. 3D-F). Furthermore, glutathione could reverse the decreased β-oxidation and increased lipolysis in adipose tissues (Supplementary Fig. 3G), but also reverse the enhanced lipogenesis and gluconeogenesis in the liver of Ad-Sirt1-/- mice (Supplementary Fig. 3H). However, no remarkable metabolic changes were observed between control mice treated with vehicle or GW4869/glutathione.
To further confirm that inhibition of exosomes secretion could improve impaired glucose and lipid metabolism, we treated primary control and Ad-Sirt1-/- adipocytes with Rab27a siRNA. Since some studies have shown that RAB27A is required for efficient release of exosomes [Citation31–Citation33]. The knock-down efficiency of RAB27A was validated by western blot (Supplementary Fig. 4A). Compared to the control siRNA-treated group, Rab27a siRNA treatment remarkably reduced exosomes secretion in primary Ad-Sirt1-/- adipocytes (Supplementary Fig. 4B). The presence of Rab27a siRNA seemed to have no obvious effect on insulin signaling in the primary control adipocytes, while Rab27a siRNA treatment in primary Ad-Sirt1-/- adipocytes remarkably reversed the impaired insulin sensitivity induced by defective SIRT1 activity (Supplementary Fig. 4C). Comparing with control siRNA-treated group, primary Ad-Sirt1-/- adipocytes exhibited significantly reduced lipolysis in the presence of Rab27a siRNA, as evidenced by decreased FFA concentrations and lower mRNA expression of lipolysis-related genes (Supplementary Fig. 4D and E).
The role of adipose tissue-derived exosomes in vitro
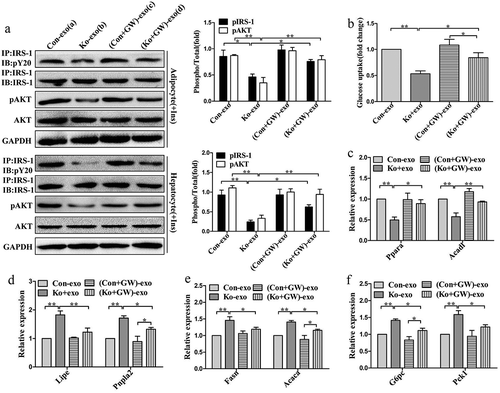
To further address the role of released exosomes, we treated mature 3T3-L1 adipocytes and BNL.CL2 hepatocytes with exosomes isolated from adipose tissue of different groups of mice (a: Control mice treated with vehicle; b: Ad-Sirt1-/- mice treated with vehicle; c: Control mice treated with GW4869; d: Ad-Sirt1-/- mice treated with GW4869). Impaired insulin sensitivity was observed in group b compared to group a, while group d exhibited improved insulin sensitivity compared to group b (). We observed impaired metabolic profile in group b compared group a, including reduced glucose uptake (), decreased β-oxidation-related genes expression () and increased lipolytic genes expression (). While improved metabolic parameters were observed in group d compared to group b, however, there was no significant difference in these metabolic parameters between group a and group c (). Considering in vivo observations in the liver, we determined to explore the role of adipose tissue-derived exosomes on BNL.CL2 hepatocytes. And the insulin action in hepatocytes showed similar changes to adipocytes (). Furthermore, we found significantly higher mRNA expression of genes related to lipogenesis and gluconeogenesis in group b compared to group a, while group d exhibited decreased lipogenesis and gluconeogenesis compared to group b ().
Figure 6. The role of Ad-Sirt1-/- adipose tissue-derived exosomes in vitro.
(a): Western blot analysis of insulin signaling in mature 3T3-L1 adipocytes and BNL.CL2 hepatocytes treated with exosomes. (b): Glucose uptake in adipocytes. Relative mRNA levels of genes associated with β-oxidation (c) and lipolysis (d) in adipocytes. Relative mRNA levels of genes associated with fatty acid and TG synthesis (e) and gluconeogenesis (f) in hepatocytes. Here mature 3T3-L1 adipocytes and BNL.CL2 hepatocytes were treated with exosomes isolated from adipose tissue of four different groups of mice (a: Control mice treated with vehicle; b: Ad-Sirt1-/- mice treated with vehicle; c: Control mice treated with GW4869; d: Ad-Sirt1-/- mice treated with GW4869. And GW4869 is abbreviated as “GW” in this figure). The data are expressed as the mean ± SEM. *P< 0.05, **P< 0.01.
Adipose Sirt1 deficiency induces exosomes in an autophagy-dependent manner
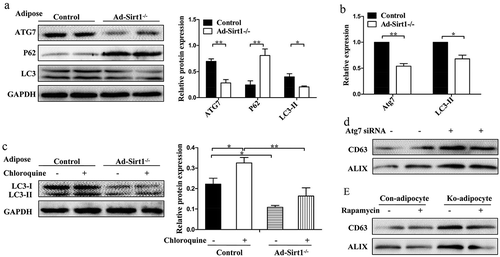
Since autophagy is known to play a key role in regulating both insulin sensitivity and exosomes release [Citation34–Citation37], we investigated whether autophagy is involved in adipose Sirt1 deficiency-induced exosomes. First of all, the expression levels of autophagy marker proteins (such as ATG7, LC3, and P62) in the adipose tissue of control and Ad-Sirt1-/- mice were assessed by western blotting. And reduced ATG7 and LC3-II proteins as well as accumulated P62 protein were observed in the adipose tissue of Ad-Sirt1-/- mice (). Considering the possibility that the decreased expression of autophagy marker LC3-II seen in the adipose tissue of Ad-Sirt1-/- mice might be resulted from a more rapid turnover rather than autophagy deficiency, we used two approaches to explore these two possibilities. As previously reported that lower mRNA expression of autophagy-related genes were closely connected with decreased autophagic flux. We observed markedly lower mRNA expression of Atg7 and LC3-II in the adipose tissue of Ad-Sirt1-/- mice (). Moreover, an increase of the LC3-II protein levels was readily observable after the administration of chloroquine (a lysosomal protease inhibitor), and adipose tissue explants of control mice had remarkably higher protein levels of LC3-II compared to Ad-Sirt1-/- mice in the presence of chloroquine (). These observations confirmed that decreased protein expression LC3-II in the adipose tissue of Ad-Sirt1-/- mice was indicative of adipose autophagy deficiency. We also found that siRNA-mediated knockdown of Atg7 in mature 3T3-L1 adipocytes resulted in increased exosomes (). Though restoration of autophagy by rapamycin had no marked effect on exosomes secretion in primary control adipocytes, rapamycin reversed the increased exosomes secretion in primary Ad-Sirt1-/- adipocytes (). These findings suggested that adipose Sirt1 deficiency could induce exosomes secretion in an autophagy-dependent manner.
Figure 7. Adipose Sirt1 deficiency induces exosomes in an autophagy-dependent manner.
(a): Western blot analysis of autophagy marker proteins in adipose tissue. (b): Relative mRNA expression of autophagy-related genes. (c): Determination of autophagic flux by chloroquine. (d): Expression of exosomal proteins in mature 3T3-L1 adipocytes after administration of Atg7 siRNA (100 nM). (e): Expression of exosomal proteins in primary adipocytes treated with rapamycin (10 nM). The data are expressed as the mean ± SEM from three independent experiments. *P < 0.05, **P < 0.01.
Restoration of SIRT1 activity ameliorates metabolic abnormalities in vitro
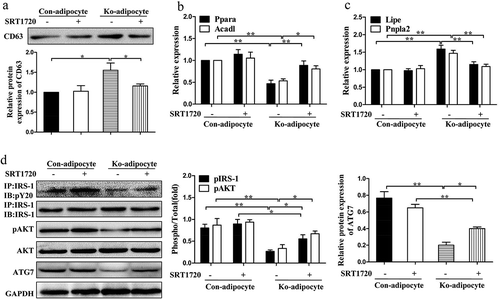
We next explored whether restoration of SIRT1 could rescue the defects in metabolic homeostasis, insulin sensitivity as well as autophagic activity. Here we treated primary control and Ad-Sirt1-/- adipocytes with SRT1720, a selective SIRT1 activator. SRT1720 treatment had no obvious effect on exosomes secretion in primary control adipocytes, while administration of SRT1720 could reduce exosomes secretion in primary Ad-Sirt1-/- adipocytes (). SRT1720 also reversed the reduced β-oxidation rates and enhanced lipolysis in primary Ad-Sirt1-/- adipocytes (. Additionally, SRT1720 ameliorated the negative effect of Sirt1 deficiency on insulin signaling and autophagic activity in primary Ad-Sirt1-/- adipocytes (). Taken together, reconstitution of SIRT1 by SRT1720 could effectively improve the impaired metabolic homeostasis resulted from adipose Sirt1 deficiency.
Figure 8. Restoration of SIRT1 activity by SRT1720 improves the impaired metabolic profiles in vitro.
(a): Western blot analysis of exosomal protein in primary control and Ad-Sirt1-/- adipocytes in the absence or presence of 5 μM SRT1720. Relative mRNA levels of genes associated with β-oxidation (b) and lipolysis (c). (d): Western blot analysis of insulin signaling and autophagy activity. The data are expressed as the mean ± SEM from three independent experiments.*P< 0.05, **P < 0.01.
Adipose Sirt1 deficiency modulates insulin sensitivity by exosomes via TLR4/NF-κB signaling pathway
Recent findings demonstrated that TLR4 played a crucial role in the development of insulin resistance which was closely related to exosomes [Citation20,Citation38,Citation39]. So we speculated adipose Sirt1 deficiency induced-exosomes may exert their effects on insulin sensitivity by interacting with TLR4. Significantly higher protein levels of TLR4 were observed in the adipose tissue of Ad-Sirt1-/- mice compared to control mice (). We then examined insulin action in the mature 3T3-L1 adipocytes interfered with Tlr4 siRNA. As expected, Tlr4 siRNA treatment alone had no effect on insulin signaling of adipocytes, whereas the decreased phosphorylation of IRS-1 and AKT by Ad-Sirt1-/- adipose tissue-derived exosomes was restored in adipocytes after transfection with Tlr4 siRNA (). Collectively, adipose Sirt1 deficiency-induced exosomes could impair insulin signaling at least partially in a TLR4-dependent manner.
Figure 9. Adipose Sirt1 deficiency modulates insulin sensitivity by exosomes via TLR4/NF-κB signaling pathway.
(a): TLR4 signaling in adipose tissues. (b): Insulin signaling in mature 3T3-L1 adipocytes after the treatment of Ad-Sirt1-/- adipose tissue-derived exosomes and Tlr4 siRNA. The activation of NF-κB in adipose tissue (c) and 3T3-L1 adipocytes (d). (e): Effect of Ikkβ siRNA (100 nM) on exosomes-dependent NF-κB activation. (f): Western blot analysis of insulin signaling in the 3T3-L1 adipocytes exposure to Ad-Sirt1-/–derived exosomes and SN50. The data are expressed as the mean ± SEM from three independent experiments. *P < 0.05, **P< 0.01.
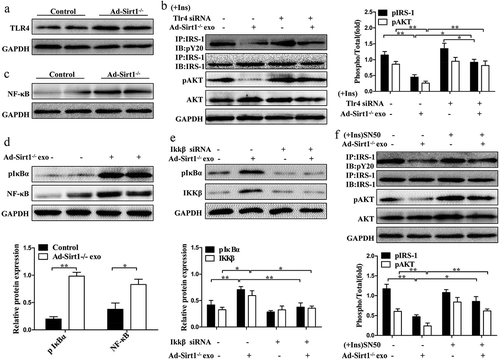
The classic NF-κB pathway, which was closely related to insulin resistance, can be activated by multiple cellular stressors and members of the Toll-like receptor family particularly recognized by TLR4 [Citation20,Citation40,Citation41].To investigate whether adipose Sirt1 deficiency-induced exosomes impair insulin signaling through the TLR4/NF-κB pathway, we treated the mature 3T3-L1 adipocytes with Ad-Sirt1-/- mice-derived exosomes. Then, we assessed the induction of inhibitory-κBα (IκBα) phosphorylation, which indicates an activation of the canonical NF-κB pathway. As the phosphorylation of inhibitory-κBα promotes its degradation, thereby freeing NF-κB to enter the nucleus and activating the transcription of target genes [Citation40]. Not surprisingly, we observed activation of NF-κB in adipose tissues of Ad-Sirt1-/- mice, but also in adipocytes treated with exosomes isolated from Ad-Sirt1-/- adipose tissue (. Since the phosphorylation of IκBα is triggered by the stimulation of the multisubunit IKK complex, we found that the addition of Ikkβ siRNA reversed the higher phosphorylation levels of IκBα induced by Ad-Sirt1-/- mice-derived exosomes (). Furthermore, the blockade of NF-κB by SN50 (a known inhibitor of NF-κB) nullified the negative effects of exosomes on insulin signaling (). Taken together, these observations suggested that adipose Sirt1 deficiency-induced exosomes could modulate insulin signaling via TLR4/NF-κB signaling pathway.
Discussion
Our study has demonstrated that inducible adipocyte-specific knockdown of Sirt1 resulted in increased fat mass, insulin resistance, and disordered glucose and lipid metabolism. Increased exosomes induced by adipose Sirt1 deficiency were proved to be responsible for these metabolic dysfunctions. Moreover, our study also demonstrated that Ad-Sirt1-/-–derived exosomes could impair insulin sensitivity at least partially via TLR4/NF-κB signaling pathway. Collectively, this study supports that adipose SIRT1 could interact with exosomes, thereby contributing to the development of obesity and insulin resistance.
Though a couple of studies has implicated adipose SIRT1 in the development of obesity and insulin resistance, the definite role and underlying mechanism of SIRT1 in these metabolic disorders have not been fully addressed. In our study, 20-week-old Ad-Sirt1-/- mice fed chow diet exhibited remarkably increased fat mass and insulin resistance. The increased body weight and fat mass in Ad-Sirt1-/- mice were evident at early at age of 8 weeks, while there was no significant change in glucose and insulin tolerance at this age, which is consistent with the previous study [Citation7]. Another study demonstrated that Ad-Sirt1-/- mice exhibited increased body weight and fat mass; in terms of insulin sensitivity, Ad-Sirt1-/- mice showed impaired glucose and insulin tolerance in the context of chow diet or short-term HFD exposure, while the mutant mice became more glucose tolerant and insulin sensitive than control mice when challenged with chronic HFD [Citation9]. The study demonstrated that PPARγ was hyperacetylated in Ad-Sirt1-/- mice, and this high acetylation of PPARγ was responsible for the enhanced adipogenesis and increased insulin sensitivity on a chronic high-fat diet [Citation9]. A recent study reported that no obvious differences in fat composition and body weight were observed between control and Ad-Sirt1-/- mice, and Ad-Sirt1-/- mice developed mild glucose intolerance until they were 30 weeks old [Citation10]. The researchers suggested that adipocyte SIRT1 controls systemic insulin sensitivity by modulating macrophages in adipose tissue [Citation10]. In the present study, adipose-specific knockdown of Sirt1 led to increased exosomes, which resulted in excessive fat accumulation, disordered glucose and lipid metabolism as well as impaired insulin sensitivity, thus contributing to the development of obesity and insulin resistance. Indeed, the mechanism underlying adipose SIRT1 in metabolic regulation is complex, and much remains to be elucidated.
A growing body of studies has focused on the role of exosomes in glucose and lipid metabolism. Obese mice released much more exosomes which impaired glucose uptake and the insulin response of myocytes by activating macrophages via induction of TNF-α and IL-6; on the other hand, high incidence of obesity and insulin resistance were attributed to elevated levels of exosomes [Citation20,Citation21]. Exosomes were believed to transfer proteins and lipids between C2C12 myotubes and thus acting as “paracrine-like” signals to modify muscle homeostasis during high-fat diet [Citation22] Consistently, our study demonstrated that markedly increased exosomes contributed to the development of obesity and insulin resistance in Ad-Sirt1-/- mice. And the adipose Sirt1 deficiency-induced exosomes were proved to be responsible for the impaired insulin signaling in adipose tissue and liver of Ad-Sirt1-/- mice, though they had no significant effect on insulin signaling in skeletal muscle. However, some studies indicated that adipose tissue-derived exosomes may stimulate peripheral insulin signaling except for its known inhibitory effects [Citation21,Citation22]. In addition, exosomes have been reported to play a pivotal role in the control of lipid storage and cell size [Citation19,Citation22]. In line with this, our results also showed that exosomes could promote lipogenesis and finally resulted in excess lipid accumulation and lager adipocyte size in Ad-Sirt1-/- mice. Collectively, these findings implicated adipose Sirt1 deficiency-induced exosomes as a key factor in metabolic regulation.
Our results have demonstrated that exosomes impaired insulin sensitivity at least partially via TLR4/NF-κB pathway in the adipose-specific Sirt1 deficient mice. While it has not yet been elucidated how exosomes implicated in the regulation of adiposity. As a key regulator of inflammation, NF-κB could induce increased expression of inflammatory cytokines (such as TNFα, IL-1, and IL-6), which may also contribute to increased adiposity and adipose dysfunction [Citation41,Citation42]. Here we supposed that TLR4/NF-κB signaling might partly explain excess lipid accumulation in Ad-Sirt1-/- mice. On the other hand, increased exosomes may contribute to obesity by modulating PPARγ (peroxisome proliferator-activated receptor γ) activity. Because several studies identified and characterized PPARγ as an exosome-associated protein [Citation43,Citation44]. And PPARγ had been shown implicated in adipogenesis, glucose homeostasis, immune response and inflammatory response [Citation43,Citation45]. Furthermore, SIRT1 was reported to inhibit adipogenesis by repressing the transcriptional activity of PPARγ, so that adipocyte-specific inactivation of SIRT1 resulted in increased whole-body adiposity in vivo [Citation46]. Therefore, we postulate that adipose Sirt1 deficiency may lead to interactions between exosomes and PPARγ, which in turn promote lipid accumulation and eventually result in obesity.
In this study, the causative role of impaired autophagy involved in the development of obesity and insulin resistance was observed in Ad-Sirt1-/- mice. Paradoxically, several studies suggested that the adipose-specific deletion of Atg7 resulted in improved insulin sensitivity and lean phenotype [Citation34,Citation35,Citation47]. In fact, the role autophagic defect plays in metabolic homeostasis and its molecular mechanism could be diverse. Autophagy itself is a complicated process, including two common forms: basic autophagy and induced autophagy. Generally, basic autophagy participates in the degradation and recycling of nutrients and organelles in order to maintain cellular homeostasis [Citation48,Citation49]. Whereas induced autophagy usually acts as a compensatory adaptation or stress response to some stress or external stimulus [Citation50]. In our study, defective autophagy secondary to adipose Sirt1 deficiency is somehow different from direct genetic knockout of Atg7 in adipose tissue, thus leading to the activation of different downstream effectors. For example, mice with adipose-deletion of Atg7 had increased mitochondria content and higher basal physical activities so that they were lean and more insulin sensitive [Citation35]. However, autophagy defect induced by adipose Sirt1 deficiency led to increased exosomes, which in turn impaired glucose and lipid metabolism as well as insulin sensitivity. Since the effects autophagy exerts on glucose and lipid metabolism might be much more complicated than expected. Future studies are warranted to address the systematic consequences of Sirt1 deficiency and autophagy defect in glucose and lipid metabolism.
In conclusion, our study demonstrated that exosomes play a pivotal role in adipose Sirt1 deficiency-mediated obesity and insulin resistance. These findings may be beneficial to further understand the underlying mechanism of obesity and insulin resistance, and provide promising therapeutic strategies for the treatment of these metabolic diseases.
Supplemental Material
Download MS Word (1.2 MB)Disclosure statement
No potential conflict of interest was reported by the authors.
Supplementary material
Supplemental data for this article can be accessed here.
Additional information
Funding
Related Research Data
References
- Reilly SM, Saltiel AR. Adapting to obesity with adipose tissue inflammation. Nat Rev Endocrinol. 2017;13(11):633–643.
- Guilherme A, Virbasius JV, Puri V, et al. Adipocyte dysfunctions linking obesity to insulin resistance and type 2 diabetes. Nat Rev Mol Cell Biol. 2008;9(5):367–377.
- Morigny P, Houssier M, Mouisel E, et al. Adipocyte lipolysis and insulin resistance. Biochimie. 2016;125:259–266.
- Ye J. Mechanisms of insulin resistance in obesity. Front Med. 2013;7(1):14–24.
- Yamaguchi S, Yoshino J. Adipose tissue NAD(+) biology in obesity and insulin resistance: from mechanism to therapy. BioEssays. 2017 May;39(5).doi:10.1002/bies.201600227.
- Xu C, Bai B, Fan P, et al. Selective overexpression of human SIRT1 in adipose tissue enhances energy homeostasis and prevents the deterioration of insulin sensitivity with ageing in mice. Am J Transl Res. 2013;5(4):412–426.
- Chalkiadaki A, Guarente L. High-fat diet triggers inflammation-induced cleavage of SIRT1 in adipose tissue to promote metabolic dysfunction. Cell Metab. 2012;16(2):180–188.
- Wang RH, Kim HS, Xiao C, et al. Hepatic Sirt1 deficiency in mice impairs mTorc2/Akt signaling and results in hyperglycemia, oxidative damage, and insulin resistance. J Clin Invest. 2011;121(11):4477–4490.
- Mayoral R, Osborn O, McNelis J, et al. Adipocyte SIRT1 knockout promotes PPARgamma activity, adipogenesis and insulin sensitivity in chronic-HFD and obesity. Mol Metab. 2015;4(5):378–391.
- Hui X, Zhang M, Gu P, et al. Adipocyte SIRT1 controls systemic insulin sensitivity by modulating macrophages in adipose tissue. Embo Rep. 2017;18(4):645–657.
- Haigis MC, Sinclair DA. Mammalian sirtuins: biological insights and disease relevance. Annu Rev Pathol. 2010;5:253–295.
- Hwang JW, Yao HW, Caito S, et al. Redox regulation of SIRT1 in inflammation and cellular senescence. Free Radical Bio Med. 2013;61:95–110.
- Yu A, Dang W. Regulation of stem cell aging by SIRT1 - Linking metabolic signaling to epigenetic modifications. Mol Cell Endocrinol. 2017;455:75–82.
- Silva JP, Wahlestedt C. Role of Sirtuin 1 in metabolic regulation. Drug Discov Today. 2010;15(17–18):781–791.
- Song YS, Lee SK, Jang YJ. et al. Association between low SIRT1 expression in visceral and subcutaneous adipose tissues and metabolic abnormalities in women with obesity and type 2 diabetes. Diabetes Res Clin Pr. 2013;101(3):341–348.
- Sadeghabadi ZA, Nourbakhsh M, Pasalar P, et al. Reduced gene expression of sirtuins and active AMPK levels in children and adolescents with obesity and insulin resistance. Obes Res Clin Pract. 2018;12(2):167–173.
- Lawson C, Vicencio JM, Yellon DM, et al. Microvesicles and exosomes: new players in metabolic and cardiovascular disease. J Endocrinol. 2016;228(2):R57–71.
- Lee MJ, Park DH, Kang JH. Exosomes as the source of biomarkers of metabolic diseases. Ann Pediatr Endocrinol Metab. 2016;21(3):119–125.
- Muller G, Schneider M, Biemer-Daub G, et al. Upregulation of lipid synthesis in small rat adipocytes by microvesicle-associated CD73 from large adipocytes. Obesity. 2011;19(8):1531–1544.
- Deng ZB, Poliakov A, Hardy RW, et al. Adipose tissue exosome-like vesicles mediate activation of macrophage-induced insulin resistance. Diabetes. 2009;58(11):2498–2505.
- Kranendonk ME, Visseren FL, van Herwaarden JA, et al. Effect of extracellular vesicles of human adipose tissue on insulin signaling in liver and muscle cells. Obesity. 2014;22(10):2216–2223.
- Aswad H, Forterre A, Wiklander OP, et al. Exosomes participate in the alteration of muscle homeostasis during lipid-induced insulin resistance in mice. Diabetologia. 2014;57(10):2155–2164.
- Xu D, Tahara H. The role of exosomes and microRNAs in senescence and aging. Adv Drug Deliv Rev. 2013;65(3):368–375.
- Sarkar S, Jun S, Rellick S, et al. Expression of microRNA-34a in Alzheimer’s disease brain targets genes linked to synaptic plasticity, energy metabolism, and resting state network activity. Brain Res. 2016;1646:139–151.
- Forterre A, Jalabert A, Chikh K, et al. Myotube-derived exosomal miRNAs downregulate Sirtuin1 in myoblasts during muscle cell differentiation. Cell Cycle. 2014;13(1):78–89.
- Li HZ, Rajendran GK, Liu NN, et al. SirT1 modulates the estrogen-insulin-like growth factor-1 signaling for postnatal development of mammary gland in mice. Breast Cancer Res. 2007;9(1).
- Povero D, Eguchi A, Li HY, et al. Circulating extracellular vesicles with specific proteome and liver MicroRNAs are potential biomarkers for liver injury in experimental fatty liver disease. PloS One. 2014;9(12).
- Shi J, Kandror KV. Study of glucose uptake in adipose cells. Methods Mol Biol. 2008;456:307–315.
- Li H, Zhou B, Xu L, et al. The reciprocal interaction between autophagic dysfunction and ER stress in adipose insulin resistance. Cell Cycle. 2014;13(4):565–579.
- Ost A, Svensson K, Ruishalme I, et al. Attenuated mTOR signaling and enhanced autophagy in adipocytes from obese patients with type 2 diabetes. Mol Med. 2010;16(7–8):235–246.
- Kowal J, Tkach M, Thery C. Biogenesis and secretion of exosomes. Curr Opin Cell Biol. 2014;29:116–125.
- Colombo M, Raposo G, Thery C. Biogenesis, secretion, and intercellular interactions of exosomes and other extracellular vesicles. Annu Rev Cell Dev Bi. 2014;30:255–289.
- Ostrowski M, Carmo NB, Krumeich S, et al. Rab27a and Rab27b control different steps of the exosome secretion pathway. Nat Cell Biol. 2010;12(1):19–U61.
- Goldman S, Zhang Y, Jin S. Autophagy and adipogenesis: implications in obesity and type II diabetes. Autophagy. 2010;6(1):179–181.
- Zhang Y, Goldman S, Baerga R, et al. Adipose-specific deletion of autophagy-related gene 7 (atg7) in mice reveals a role in adipogenesis. Proc Natl Acad Sci U S A. 2009;106(47):19860–19865.
- Baixauli F, Lopez-Otin C, Mittelbrunn M. Exosomes and autophagy: coordinated mechanisms for the maintenance of cellular fitness. Front Immunol. 2014;5:403.
- Dias MV, Teixeira BL, Rodrigues BR, et al. PRNP/prion protein regulates the secretion of exosomes modulating CAV1/caveolin-1-suppressed autophagy. Autophagy. 2016;12(11):2113–2128.
- Saberi M, Woods NB, de Luca C, et al. hematopoietic cell-specific deletion of toll-like receptor 4 ameliorates hepatic and adipose tissue insulin resistance in high-fat-fed mice. Cell Metab. 2009;10(5):419–429.
- Poggi M, Bastelica D, Gual P, et al. C3H/HeJ mice carrying a toll-like receptor 4 mutation are protected against the development of insulin resistance in white adipose tissue in response to a high-fat diet. Diabetologia. 2007;50(6):1267–1276.
- Liu J, Li H, Zhou B, et al. PGRN induces impaired insulin sensitivity and defective autophagy in hepatic insulin resistance. Mol Endocrinol. 2015;29(4):528–541.
- Baker RG, Hayden MS, Ghosh S. NF-kappaB, inflammation, and metabolic disease. Cell Metab. 2011;13(1):11–22.
- Wernstedt Asterholm I, Tao C, Morley TS, et al. Adipocyte inflammation is essential for healthy adipose tissue expansion and remodeling. Cell Metab. 2014;20(1):103–118.
- Looze C, Yui D, Leung L, et al. Proteomic profiling of human plasma exosomes identifies PPARgamma as an exosome-associated protein. Biochem Biophys Res Commun. 2009;378(3):433–438.
- Katome T, Namekata K, Mitamura Y, et al. Expression of intraocular peroxisome proliferator-activated receptor gamma in patients with proliferative diabetic retinopathy. J Diabetes Complications. 2015;29(2):275–281.
- Rosen ED, Spiegelman BM. PPARgamma: a nuclear regulator of metabolism, differentiation, and cell growth. J Biol Chem. 2001;276(41):37731–37734.
- Picard F, Kurtev M, Chung N, et al. Machado De Oliveira R et al. Sirt1 promotes fat mobilization in white adipocytes by repressing PPAR-gamma. Nature. 2004;429(6993):771–776.
- Singh R, Xiang YQ, Wang YJ, et al. Autophagy regulates adipose mass and differentiation in mice. J Clin Investig. 2009;119(11):3329–3339.
- Codogno P, Meijer AJ. Autophagy: a potential link between obesity and insulin resistance. Cell Metab. 2010;11(6):449–451.
- Quan W, Lee MS. Role of autophagy in the control of body metabolism. Endocrinol Metab. 2013;28(1):6–11.
- Chen Z-F, Li Y-B, Han J-Y, et al. The double-edged effect of autophagy in pancreatic beta cells and diabetes. Autophagy. 2014;7(1):12–16.