
ABSTRACT
By proteomic, metabolomic and transcriptomic approaches we shed light on the molecular mechanism by which human keratinocytes undergo to terminal differentiation upon in vitro calcium treatment. Proteomic analysis revealed a selective induction of the ribosomal proteins RSSA, an inhibitor of cell proliferation and inducer of differentiation, HSP 60, a protein folding chaperone and GRP78, an unfolding protein response signal. Additionally, we observed an induction of EF1D, a transcription factor for genes that contain heat-shock responsive elements. Conversely, RAD23, a protein involved in regulating ER-associated protein degradation was down-regulated. All these modifications indicated an ER stress response, which in turn activated the unfolded protein response signaling pathway through ATF4, as confirmed both by the modulation of amino acids metabolism genes, such as XBP1, PDI and GPR78, and by the metabolomic analysis. Finally, we detected a reduction of PDI protein, as confirmed by the increase of oxidized glutathione. Metabolome analysis indicated that glycolysis failed to fuel the Krebs cycle, which continued to decrease during differentiation, at glance with the PPP pathway, allowing NADH production and glutathione reduction. Since unfolded protein response is linked to keratinization, these results may be useful for studying pathological mechanisms as well as potential treatments for different pathological conditions.
Abbreviation: UPR, unfolded protein response; HEK, human epidermal keratinocytes; HKGS, human keratinocytes growth factor.
Introduction
The epidermis is a continuous renewing tissue in which keratinocyte undergo terminal differentiation by migrating from the innermost layer (basal layer) to the outermost one (cornified layer) [Citation1–Citation3]. The epidermis is composed of four functionally different layers of keratinocytes at different differentiation stages. The basal layer is in contact with the basal lamina separating the dermis and epidermis; moreover, the basal layer is the proliferating compartment of the epithelia, containing somatic epithelial stem cells [Citation4,Citation5]. In vivo, these cells proliferate, providing the cells for the upper differentiating layers, forming intercellular link with adjacent cells through desmosomes and adherent junctions [Citation6]. Several nutrients have been reported to modulate keratinocyte differentiation, including calcium, vitamin C and retinoic acid [Citation7–Citation10]. Calcium is the major regulator in keratinocyte differentiation [Citation11]. It regulates both the switch of the keratinocyte from the basal to the spinous layer and terminal differentiation in granular layer [Citation6]. The differentiation program ends in the outermost layer, the cornified layer, with the assembly of the cornified cell envelope, a specialized structure with lipid and protein components. The cornified layer is indeed physically responsible for the epidermis barrier function [Citation3,Citation12,Citation13]. In vitro, murine keratinocytes growing in low calcium conditions (0.03 − 0.1 mM) do not differentiate and are phenotypically similar to basal epidermal cells, while differentiation-specific marker expression is enhanced at calcium concentrations above 0.1 mM [Citation14,Citation15]. Similarly, also primary human keratinocytes are an excellent in vitro model for studying epidermal differentiation, as they mimic the steps of cell differentiation occurring in the epidermis [Citation8]. Indeed, when they are cultured at a low calcium concentration (<0.07 mM), epidermal keratinocytes rapidly proliferate and express the phenotype of basal cells. Raising calcium concentration above 0.1 mM, cells undergo differentiation as indicated by the formation of adherent junctions (AJ) and desmosomes, and keratin 1 and keratin 10, along with stratification and cornification of cell layers [Citation6,Citation16]. Keratinocytes differentiation is correlated with unfolding protein response (UPR) [Citation17,Citation18], a cellular stress response related to the endoplasmic reticulum (ER) [Citation19–Citation21]. In human keratinocytes, calcium treatment induces the overexpression of heat shock proteins [Citation22], which support protein folding as well as other functions. All these proteins are synthesized and modified in the ER, and for this reason disturbances in the normal functions of this organelle such as protein folding, protein quality control, calcium homeostasis, and redox balance, promote accumulation of unfolded or misfolded proteins, a condition known as ER stress. Mild ER stress in normally observed during normal keratinocytes differentiation but this could also play a role in abnormal keratinization disorders [Citation17]. To avoid an overload of misfolded proteins accumulating in the ER, the unfolded protein response (UPR) has evolved as a repair mechanism that modifies the cellular transcriptional and translational programmers to cope with stressful conditions such as UV irradiation or heat shock [Citation23–Citation25]. Several effectors and regulatory proteins participate in this repair mechanism, including, for example p53 [Citation26–Citation37] and bcl-2 [Citation38–Citation47]. The early role of the UPR signaling is to increase the expression of proteins that are involved in ER folding machinery to enhance protein-folding and also attenuate general protein translation to reduce the load in the ER. The UPR consists of three integrated stress-responsive signaling pathways activated downstream the ER stress-sensing proteins IRE1, ATF6, and PERK [Citation25,Citation48]. These stress sensors are activated by the accumulation of misfolded proteins within the ER lumen (a consequence of ER stress) [Citation49–Citation51]. The activation of UPR signaling pathways results in the attenuation of new protein synthesis [Citation52] and transcriptional remodeling of ER protein folding, trafficking, and degradation pathways [Citation53–Citation55], thereby enhancing ER proteostasis capacity and quality control. Through these mechanisms, UPR activation reduces accumulation of misfolded proteins in the ER and attenuates the aberrant secretion of aggregation-prone proteins into the extracellular space [Citation55,Citation56]. Furthermore, the misfolded proteins are transferred from the ER to the cytoplasm and then degraded by proteasome, which is known to be associated with ER degradation (ERAD) [Citation57]. Increasing number of studies have shown that UPR signaling and ER stress are associated with pathophysiological and metabolic changes.
In this study, using integrated omics analysis (proteomics, metabolomics, and transcriptomic approaches) we reconstructed part of the sequential events leading to keratinocyte differentiation by calcium treatments to investigate which UPR mechanisms is activated by calcium. In this regard, data were collected in function of the time (1, 3 and 6 d calcium treatments) that allowed us to depict the more relevant cascade of events occurring during the differentiation process. These results could be possibly relevant for skin diseases.
Material and methods
Cell culture
Human epidermal keratinocytes neonatal (Hekn) (Invitrogen) were cultured in Epilife medium with human keratinocytes growth factor (HKGS) added (Invitrogen). Cells were induced to differentiate by adding 1.2 mM CaCl2 to the culture medium.
Protein extraction and solubilization
Differentiated keratinocytes were collected, centrifuged at 1500 rpm for 5 min. Cells were resuspended in lysis buffer (7 M urea, 2M thiourea, 4% w/v CHAPS, 40 mM Tris-HCl, 0.1 mM EDTA, 1mM DTT, 50 mM NaF, and 0.25 mMNa3VO4). The mixture was centrifuged at 12 000 × g at room temperature for 15 min and a small aliquot was used to determine the protein content by 2D-Quant Kit (GE Healthcare).
2D gel electrophoresis and image analysis
To remove lipids, 600 µg of protein were precipitated from a desired volume of each sample with a cold mix of tri-n-butyl phosphate/acetone/methanol (1:12:1). After incubation at 4°C for 90 min, the precipitate was pelleted by centrifugation at 2,800 g, for 20 min at 4°C. The pellet was air-dried and then solubilized in the buffer containing 7 M urea, 2 M thiourea, 4% (w/v) CHAPS, 40 mM Tris-HCl. The sample was subsequently reduced (5mM tributylphosphine,1 h) and alkylated (7.7mM IAA, 1 h). To prevent over-alkylation, iodoacetamide (IAA) excess was neutralized by adding 10mM DTE. Sample is included in the rehydration solution (7 M Urea, 2 M Thiourea, 4% CHAPS and 0.5% w/v pH 4–7 carrier ampholyte (Bio-Rad, Hercules CA, USA)) and the sample is taken up into the seventeen centimeter IPG strips pH 3–10 (Bio-Rad, CA, USA) passively during rehydration overnight.IEF was performed using Bio-Rad Multiphore II and Dry Strip Kit (Bio-Rad-Protean-IEF-Cell-System). Seventeen centimeters IPG strips (Bio-Rad, Hercules, CA, USA) pH 4–7 were passively rehydrated overnight with 600 μg of protein in 300 μl of solubilisation solution (7 M Urea, 2 M Thiourea, 4% CHAPS and 0.5% w/v pH 4–7 carrier ampholyte (Bio-Rad, Hercules CA, USA)). The total product time × voltage applied was 80 000 V h for each strip at 20°C. Strips were equilibrated (30 min in 50 mM Tris-HCl pH 8.8, 6 M urea, 30% glycerol v/v, 1% SDS, bromophenol blue) and then placed on SDS-polyacrylamide gels, 18.5 cm × 20 cm, 13% acrylamide, and sealed with 0.5% agarose. SDS-PAGE was performed using the Bio-Rad Protean II XL Cell, large gel format, at constant current (40 mA per gel) at 7°C until the bromophenol blue tracking dye was approximately 2–3 mm from the bottom of the gel. Protein spots were stained with colloidal Coomassie Brilliant Blue G-250. To ensure protein pattern reproducibility, two technical replicates for each biological replicate were done. The scanned gel images were transferred to the Progenesis SameSpots software package (Nonlinear Dynamics, Newcastle, UK), which allows spot detection, background subtraction, and protein spot OD intensity quantification (spot quantity definition). The gel image showing the highest number of spots and the best protein pattern was chosen as a reference template and the images were aligned onto it. All spots were prefiltered and manually checked before applying the statistical criteria (ANOVA p < 0.05 and fold ≥1.5).
In-gel digestion and LC-MS/MS analysis
Gel bands were carefully excised from the gel and subjected to in-gel trypsin digestion according to Shevchenko et al. [Citation58] Peptide extracts were analyzed by using a split-free nano-flow liquid chromatography system (EASY-nLC II, Proxeon, Odense, Denmark) coupled with a 3D-ion trap (model AmaZon ETD, Bruker Daltonik, Germany) equipped with an online ESI nanosprayer (the spray capillary was a fused silica capillary, 0.090 mm OD, 0.020 mm ID) in the positive-ion mode. For all experiments, a sample volume of 15 μl was loaded by the autosampler onto a homemade 2-cm fused silica precolumn (100 μm I.D.; 375 μm O.D.; Reprosil C18-AQ, 5 μm, Dr. Maisch GmbH, Ammerbuch-Entringen, Germany). Sequential elution of peptides was accomplished by using a flow rate of 300 nl/min and a linear gradient from Solution A (100% water; 0.1% formic acid) to 50% of Solution B (100% acetonitrile; 0.1% formic acid) in 40 min over the precolumn on-line with a homemade 15-cm resolving column (75 μm ID; 375 μm OD; Reprosil C18-AQ, 3 μm, Dr. Maisch GmbH, Ammerbuch-Entringen, Germany). The acquisition parameters for the mass spectrometer were as previously reported. Acquired MS/MS spectra were processed in DataAnalysis 4.0 and submitted to the Mascot search program (Matrix Science, London, UK). The following parameters were adopted for database searches: SwissProt database (release date 7 April 2017; 5011440 sequences); taxonomy = Homo Sapiens; peptide and fragment mass tolerance = ±0.3 Da; missed cleavages = 1; fixed modifications = carbamidomethyl (C); variable modifications: oxidation (M) and significance threshold level (P < 0.05) for Mascot scores (−10 Log (P)). In the case of hits with only one statistically significant unique peptide, even though high Mascot scores were obtained with significant values, a combination of automated database searches and manual interpretation of peptide fragmentation spectra was used to validate protein assignments.
To obtain a comprehensive description of the over-represented biological processes and functionally related groups of proteins within our dataset, a Bioinformatic Gene Ontology analysis was performed using the on-line FunRich (Functional Enrichment analysis tool) software 3.0 (www.funrich.org). The default Homo sapiens genome was used as background.
Western blotting
Total cell extracts were resolved on an SDS polyacrylamide gel, blotted on a Hybond P PVDF membrane (G&E Healthcare, UK). Membranes were blocked with 5% nonfat dry milk, incubated with primary antibodies for 2 h at room temperature, washed and hybridized for 1 h at room temperature using the appropriate horseradish peroxidase-conjugated secondary antibody (rabbit and mouse, BioRad, Hercules, California, USA). Detection was performed with the ECL chemiluminescence kit (Perkin Elmer, Waltham, Massachusetts, USA). The following antibodies were used: anti-keratin 10 (Covance, Princeton, New Jersey, USA; dilution 1:1000), anti-PDI (Cell Signaling, USA; dilution 1:300), anti-RAD23 (Sigma, St Louis, Minnesota, USA; dilution 1:500), anti-β actin (Sigma, St Louis, Minnesota, USA; dilution 1:5000), anti-GAPDH (Sigma, St Louis, Minnesota, USA; dilution 1:5000), and anti-GRP78 (Santa-Cruz Biotechnology, California, USA; dilution 1:500).
Immunofluorescence and confocal analysis
Immunofluorescence on cells and human skin slides were performed by fixing in 4% paraformaldehyde (10 min). After 0.5% TritonX-100 permeabilization (10 min) and 5% goat serum PBS blocking (1 h), cells were incubated 1 h with primary antibodies: anti-PDI (dilution 1:100; Cell signaling), anti-RAD23 (dilution 1:100; Sigma), anti–β-Tubulin (dilution 1:1000; Sigma), anti-Keratin 14 (dilution 1:1000, Abcam) and anti- GRP78 (dilution 1:100, Abcam). Then, cells were washed three times with PBS and incubated for 1 h with Alexa Fluor 488 or 568 secondary antibodies (dilution 1:1,000). Cells were washed three times with PBS and were counterstained with DAPI to highlight nuclei. Slides were then mounted by using ProLong antifade (Invitrogen). Fluorescence was evaluated by confocal microscopy (C1 on Eclipse Ti; AR 4.00.04 64 bit software; Nikon) fitted with an argon laser (488-nm excitation), He/Ne laser (542-nm excitation), and UV excitation at 405 nm using oil immersion Plan Fluor 40×/1.30 NA or Plan Apochromat 60×/1.4 objective lenses at RT. AR-C1 images were exported as full resolution TIF files and processed in Photoshop CS5 (Adobe) to adjust brightness and contrast.
Metabolite extraction and LC-MS analysis
For each treatment, 1*106 cells (4 biological replicates × 3 technical replicates; n = 12) were first subjected to three freeze-melt cycles (freezing in ice at 4°C for 5 min, melting at 37°C for 5 min; for 5 times). Next, 400 μl of freezing methanol and 600 μl of freezing chloroform were added to the cells. Samples were vortexed for 30 min at max speed at 4°C. The next day, samples were centrifuged at 16000 g for 15 min at 4°C. Supernatants were then evaporated to dryness using an SPD2010–230 SpeedVac Concentrator (Thermo Savant, Holbrook, USA). When samples were completely dried, 60 μl of 5% formic acid was added to the dried residue and vigorously vortex-mixed. Twenty microliters of each sample were injected into an Ultra-High-Performance Liquid Chromatography (UHPLC) system (Ultimate 3000, Thermo) and run on a Positive mode. Samples were loaded onto a Reprosil C18 column (2.0 mm × 150 mm, 2.5 μm; Dr Maisch, Germany) for metabolite separation. Chromatographic separations were achieved at a column temperature of 30°C and flow rate of 0.2 mL/min. A 0–100% linear gradient of solvent A (ddH2O, 0.1% formic acid) to B (acetonitrile, 0.1% formic acid) was employed over 20 min, returning to 100% A in 2 min and a 6-min post-time solvent A hold. The UHPLC system was coupled online with a mass spectrometer Q Exactive (Thermo) scanning in full MS mode (2 μscans) at 70,000 resolution in the 67 to 1000 m/z range, target of 1 × 10⁶ ions and a maximum ion injection time (IT) of 35 ms. Source ionization parameters were: spray voltage, 3.8 kV; capillary temperature, 300°C; sheath gas, 40; auxiliary gas, 25; S-Lens level, 45. Calibration was performed before each analysis against positive ion mode calibration mixes (Piercenet, Thermo Fisher, Rockford, IL) to ensure sub ppm error of the intact mass. Replicates were exported as mzXML files and processed using MAVEN 5.2. Mass spectrometry chromatograms were elaborated for peak alignment, matching, and comparison of parent and fragment ions, and tentative metabolite identification (within a 2ppm mass-deviation range between observed and expected results against the imported KEGG database). The difference between the two groups was compared using the unpaired t-test with GraphPad Prism version 5.0 GraphPad software (La Jolla Ca); *p < 0.05 was considered significant.
RNA seq analysis
Raw RNA seq values of the gene expression were obtained from the RNA sequencing experiments carried out in our laboratory using normal human keratinocytes undergoing calcium-induced differentiation (6 d1.2 mM calcium) and published previously [Citation59] or from the databases of ENCODE project [Citation60]. Raw CPM or TPM values were presented as a heatmaps.
Data elaboration and statistical analysis
Metabolites detected across both groups that met acceptability criteria and were further analyzed using MetaboAnalyst 3.0 software. Metabolite set enrichment analysis (MSEA) was used to determine the biological processes involved in the conditions of interest. Both have been developed to identify and to interpret patterns in concentration changes of human keratinocytes metabolites under calcium treatment. To find the concentration Ca2+ differences in metabolism, we performed a time-course analysis, using Metaboanalyst. First of all, it was generated iPCA, that visualizes the results of principle component analysis using multiple coordinated views and a rich set of user interactions. It is generated a heatmap to clustering the result. It provides direct visualization of all the data point in the form of colored squares. The difference between the 0–1, 0–3and 0–6 d of treatment was compared using the unpaired t-test with GraphPad Prism version 5.0 GraphPad software (La Jolla Ca); *p < 0.05 was considered significant.
Results
Proteomics and transcriptomics analysis indicate endoplasmic reticulum stress and unfolded protein response during keratinocyte differentiation
Two-dimensional gel electrophoresis was used to separate and identify the differential proteins expressed after calcium treatments (1.2 mM). Six technical and four biological replicates were performed at different time after exposure (0, 1, 3, 6 d) ()). From comparative analysis, a total of 9 spots (significant changes in abundance (p < 0.05; fold change ≥1.5)) were differentially identified just after 1-d calcium treatment compared to control (0 d), 11 protein spots after 3 d, whereas 12 differentially spots after 6 d. Then, variable spots were excised from the gels, digested by trypsin and peptidase mixtures and then analyzed by LC-ESI-MS/MS for protein identification. The data obtained from proteomics were annotated for molecular weight, pI, SwissProt category, number of peptides, Mascot score, and trend.
Figure 1. Proteomic profiling during keratinocyte differentiation. (a) 2-DE proteomic profiling of keratinocytes at 1 d, 3 dand 6 d after calcium treatment. Numbers indicate the statistically variable protein spots as detected by using Progenesis SameSpots software. (b) Venn diagrams depicting the number of proteins identified in each sample, during the calcium treatment. Graphic was obtained by FunRich program submitting the lists of proteins exclusively detected in each sample. (c) Gene Ontology-based functional enrichment analysis of biological functions, using FunRich software.
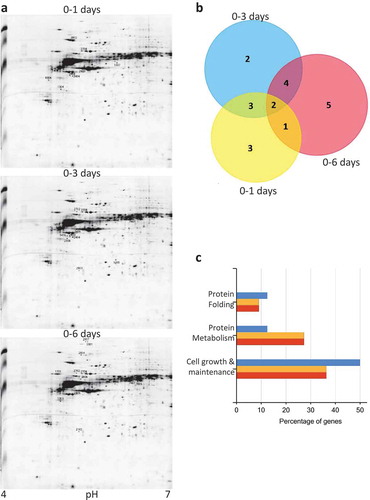
shows the proteins differentially found. Proteome changes associated with different Ca2+ concentration were analyzed using FunRich (Platform 3.0). The Venn diagrams displayed in ) highlight proteins differentially expressed between 0 to 1, 3 and 6 d of treatment with calcium. Of the 9 identified protein spots in 1-d treatment, 5 are in common at 3 dtreatment and 3 are in common with 6 d treatment; of these 2 are common with all treatments; whereas, of the 12 identified protein spots in 6 dtreatment, 6 are in common with 3 d treatment. In particular, the most changed interesting protein () are RSSA and CH60 that upon calcium addition were the first proteins overexpressed just after 1 and 3 d, whereas NMP protein started to be down-regulated after 3 d and RAD23 protein after 6 d. Interestingly, RSSA decreases during differentiation at mRNA level (Figure S1A) indicating that RSSA is stabilized post-translationally. RAD23B, instead, decreases at mRNA level coherently with the protein level (Figure S1B, ). As positive control, we showed up-regulation of keratin 10 (Figure S1C). In order to identify the relevant Ca2+-altered pathways, we performed an enrichment analysis for biological processes by using GO classification in FunRich tool. FunRich software highlighted how identified protein play role in “protein folding” (11.11%, 9.09% and 8.33%, respectively, p-value <0.01), and “cell growth and/or maintenance” (44.44%, 36.36% and 33.33%, respectively, p-value ≤0.01) ()). In the first group of protein, we found HSP60, a heat shock protein that increased during the calcium treatment. In the “cell grow and/or maintenance” group, we find RAD23, contained in the ERAD complex, activated by unfolded or incorrectly folded proteins in the secretion pathway. Additionally, identified proteins related to UPR mechanism are shown in . Taking advantage of RNA seq experiments previously performed in our laboratory comparing proliferating and differentiated keratinocytes (6 d calcium) [Citation59] and publicly available ENCODE data (3 and 6 d of calcium) [Citation60], we showed that the transcripts of the proteins identified are also modulated (), indicating that both transcriptional and post-transcriptional events are engaged during keratinocyte differentiation. Among these, RAD23, part of the ERAD complex important for unfolded or incorrectly folded proteins in the secretion pathway, decreases during differentiation both at mRNA (; )) and at protein level as shown by western blot and confocal staining (). Keratin 10 (K10) was included as positive control (), and PDI to further confirm proteome results (). This was further confirmed by investigating the expression at mRNA level of ER sensors, such us PERK, ATF6 and HR1 and components of the signaling down-stream cascade (ie. ATF4, XBP1, PDI, GRP78) ()). Activation of the UPR during keratinocyte calcium-induced differentiation has been validated by performing RT-qPCR detection of UPR-induced markers, including ATF4 and CHOP ()). GRP78 western blot-based detection further demonstrated activation of the UPR during keratinocyte calcium-induced differentiation ()). Immunofluorescence analysis of human skin tissues stained for the UPR-induced protein marker GRP78 nicely confirm the expression of GRP78 also in the upper differentiation layers of human skin. Altogether, these data confirmed that the expression of the different components of the UPR are modulated and that they play an important role during induced keratinocyte differentiation.
Table 1. List of differentially abundant proteins identified by LC-MS/MS in keratinocytes cells treated by calcium.
Table 2. UPR proteins modulated during keratinocyte differentiation. The table show protein trend and transcriptomic trend.
Figure 2. RAD23 and PDI expression is downregulated during HEKn cells differentiation (a) Western blot of HEKn cells protein extracts collected at calcium-induced keratinocytes differentiation days (DD). Differentiation was evaluated by expression levels of Keratin 10. RAD23 and PDI proteins downregulation during differentiation is also shown. β-Actin was used as loading control. (b) Confocal analysis performed on calcium-induced HEKn differentiation, also reveals a decrease of RAD23 and PDI protein levels (green). Cytoskeleton labeled with β-Tubulin (red) and nuclei stained blue (DAPI).
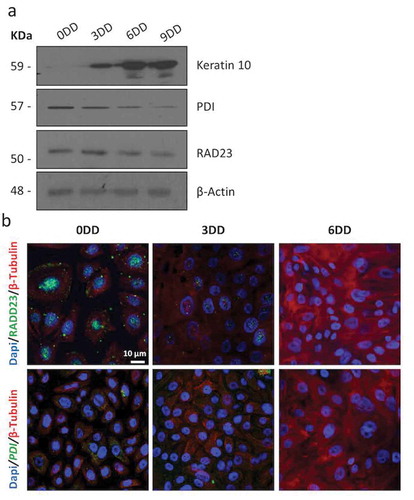
Figure 3. Activation of the UPR during keratinocyte differentiation. (a) Heat map comparing the expression of selected genes using the RNA seq data published in [Citation59] and the ENCODE data. (b) Real-time quantitative PCR showing UPR marker’s, ATF4 AND CHOP, expressed at mRNA level during calcium-induced keratinocytes differentiation. DD: days of differentiation. *p = 0.02; **p = 0.01; ***p = 7x10⁻⁷; *p = 0,045; *p = 0,048. (c) Western blot of GRP78 during calcium-induced keratinocytes. DD: days of differentiation. (d) Normal human skin showing, by confocal analysis, GRP78 (red). Basal layer is labeled using K14 (green) and nuclei stained blue (DAPI).
![Figure 3. Activation of the UPR during keratinocyte differentiation. (a) Heat map comparing the expression of selected genes using the RNA seq data published in [Citation59] and the ENCODE data. (b) Real-time quantitative PCR showing UPR marker’s, ATF4 AND CHOP, expressed at mRNA level during calcium-induced keratinocytes differentiation. DD: days of differentiation. *p = 0.02; **p = 0.01; ***p = 7x10⁻⁷; *p = 0,045; *p = 0,048. (c) Western blot of GRP78 during calcium-induced keratinocytes. DD: days of differentiation. (d) Normal human skin showing, by confocal analysis, GRP78 (red). Basal layer is labeled using K14 (green) and nuclei stained blue (DAPI).](/cms/asset/c6537eb3-3006-42cf-b703-7049344545fd/kccy_a_1642066_f0003_oc.jpg)
Metabolomics analysis
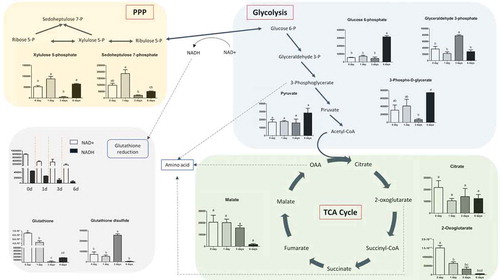
To chart metabolic adaptations in human keratinocytes during the calcium treatment, we performed non-targeted metabolomics analysis. Metabolites were extracted from cells in three replicates for each of the experimental groups (0–1, 0–3, 0–6 d) and were analyzed by LC-MS. More than 500 peaks per sample were obtained by KEGG database. After a pre-screening, 124 metabolites were analyzed more precisely and identified for each experimental group. In order, to identify changes in metabolites in the different Ca2+-treatments, we performed a time-course analysis, using Metaboanalyst. First of all, we generated a Principal Component Analysis (PCA), that visualizes the results using multiple coordinated views and a rich set of user interactions, shown in Figure S2. According to the PCA models, five principal components (PCs) were gained from the comparison between control and treatments. More of 50% of variance was captured by the first two PCAs, indicating that metabolomes in control samples and calcium treatments are largely distinguishable in keratinocytes cells. The heatmap (Figure S3) presented the metabolic alterations of these identified metabolites after Ca2+ exposition in the different time points. We observed that most of glucose metabolism intermediates were down-regulated during the first 3 d but increased again later on, while Krebs cycle intermediates decreased continuously in function of time. Interestingly, when glycolysis starts, the pentose-phosphate pathway (PPP) increased parallelly, suggesting that glycolytic intermediates fueled the PPP pathway. Simultaneously increased NADH production as well as oxidized glutathione. All amino acids resulted decreased, in particular tyrosine (). Then, a more detailed analysis of the relevant pathways and networks affected by Ca2+ was performed by the web-based tool MSEA (Metabolite Set Enrichment Analysis). The dataset was first normalized by sum and pareto scaling and then introduced into the MetaboAnalyst web portal. As shown in Figure S4, 37 metabolic pathways resulted significantly altered at 0–1 d, 4 pathways at 0–3 d, and all the pathways shown, resulted altered at 0–6 days of Ca2+ treatment. Furthermore, also thyroid hormone synthesis pathway showed alteration in Ca2+ treatment samples (Figure S4) All amino acids were reduced, in particular, tyrosine (). Glycolysis was reduced during the first days of treatment but was reactivated after 6 d. Krebs cycle was completely stopped at the level of citrate along the time points. When glycolysis was reactivated the PPP pathway was also fueled, suggesting that glycolysis intermediates was not used for Krebs but for PPP metabolism. Activation of PPP metabolism produced an increased NADH level after 3 d calcium treatment, which is probably used to reduce oxidized glutathione ().
Figure 4. Glycolysis and TCA cycle intermediates during keratinocytes differentiation. Variation in the levels of metabolic intermediates in Glycolysis and Kreb’s cycle. The values shown are mean ± SD (n = 6) of keratinocytes metabolites. Statistical significance was indicated by *p < 0.05; **p < 0.01; ***p < 0.001.
Figure 5. Amino acids during keratinocytes differentiation. Variation in the keratinocytes of amino acids content in keratinocytes. Values are mean ± SD (n = 6) of metabolites. Statistical significance was indicated by *p < 0.05; **p < 0.01; ***p < 0.001.
Discussion
Calcium is the major regulator of keratinocyte differentiation in vivo and in vitro [Citation6], allowing the regulation of several genes [Citation39,Citation61–Citation63]. It was well known that the differentiation process is regulated by a number of biological signals derived from cell–cell or cell–matrix interactions that act downstream several signaling pathways [Citation64,Citation65] but, up to now, no detailed information about genes, proteins and metabolisms sequentially involved in the differentiation process, was reported in deep. Here, by proteomic, transcriptomic and metabolomics approaches, we reconstructed part of the changes occurring inside the cell, upon addition of calcium. All these data suggested that calcium-induced the activation of cellular differentiation involving UPR process, through the ATF4 pathway. During early time points of calcium treatments, proteomics data revealed an active involvement of misfolded protein degradation paralleled by activation of the signaling pathways that lead to the increase of molecular chaperones that are involved in protein folding, in agreement to Kindas-Mugge [Citation22,Citation66]. Consequently, the UPR is activated during keratinocyte differentiation as a rescue mechanism to restore proteostasis. In particular, our proteomics analysis () revealed an up-regulation of ribosomal proteins RSSA after 3 d of calcium treatment, a trend which was also confirmed by RT-qPCR investigation. These ribosomal proteins are involved in protein synthesis and in the negative regulation of cell proliferation and death and are known to stimulate the differentiation process. These results are in line with Higgins [Citation67] and Seo [Citation9,Citation68], who showed, throught cDNA microarray approach, that these ribosomal proteins were up-regulated upon 3 d of calcium treatment. It is noteworthy that these ribosomal proteins have the potential to arrest the cell cycle at G2/M and/or G1 phase [Citation68]. In this regard, the transient increase in levels of ribosomal proteins may be linked to the withdrawal of cell cycle progression [Citation9,Citation69] also occurring in keratinocytes undergoing to calcium-induced differentiation. Decreases of keratinocyte proliferation, occurring after calcium treatment, is possibly linked with an overall decrease of both glycolysis and Krebs cycle during the first days of calcium treatment, necessary for the cell growth but not for the differentiation process. In agreement with the activation of protein folding, proteomic analysis showed also an up regulation of the heat shock protein HSP60 (60 kDa heat shock proteins), suggesting its prominent role during the early time points. HSP60 is an ATP-dependent chaperonin that assembles with its co-chaperonin HSP10 to mediate mitochondrial proteostasis by promoting the folding of newly imported mitochondrial proteins into the matrix and preventing protein aggregation [Citation70]. Our data also showed up-regulation of HYOU1 after 6 d of calcium treatment (). Alike HYOU1 is induced in response to ER stress by UPR-mediated mechanism [Citation71,Citation72].
HSPs interact also with NPM, a nucleolar phosphoprotein [Citation73,Citation74] with a potential role as a positive regulator in cell proliferation [Citation75,Citation76]. As matter of fact, NMP decreased upon 3 d of calcium treatment (), confirming NPM slight decline observed during differentiation [Citation74]. Furthermore, HSPs interact also with the elongation factor 1 delta (EF1D), a human eukaryotic EF1D protein involved in making aa-tRNAs available to the elongating ribosome [Citation77]. Our proteomics data showed EF1D up regulation after 6 d of calcium treatment (). Interestingly, in line with our results, EFD1 protein acts also as a transcription factor for genes that contain heat-shock elements (HSEs) and UPR activation signaling [Citation78]. Other proteins significantly modulated in our proteomic studies and involved in UPR signaling was the molecular chaperone GRP78 (). This protein shows activity in various subcellular compartments: ER, nucleus, cytoplasm, mitochondria, cell-surface, and extracellular space [Citation79–Citation83]. GRP78 maintains specific transmembrane receptor proteins involved in initiating of the downstream signaling of the UPR, in an inactive state, by binding to their luminal domains. Under normal conditions without ER stress, GRP78 binds the monomer IRE1α, however, upon ER stress IRE1 forms homodimer and oligomers, followed by release of GRP78 [Citation49] and/or direct interaction of unfolded proteins with its ER lumenal domain [Citation84]. Thus, the increase of GRP78 found by proteomic analysis could be related to GRP78 dissociation from the receptor [Citation85,Citation86] and its accumulation in the cytoplasm, indeed, RTqPCR analysis did not reveal an increase at transcriptional level. UPR stress-responsive signaling pathways down-stream GRP78 include three different downstream cascades: IRE1, ATF6, and PERK [Citation25,Citation48], our data indicated that during in vitro keratinocyte differentiation the transcription factor 4 (ATF4) is responsible of UPR activation. ATF4 also regulates the expression of genes involved in amino acid metabolism and response of redox homeostasis [Citation87]. Interestingly, our transcriptomics analysis showed an overexpression of genes involved in amino acid metabolism, such as XBP1, PDI e GPR78, and by metabolomic analysis we found a significant decrease of all amino acids during differentiation. Furthermore, the increased levels of GRP78 lead to an elevated c-Myc expression and concomitantly to enhanced glutamine metabolism [Citation88]. Our metabolomics data show a significant glutamine decrease during keratinocyte differentiation. Since it is well known [Citation88,Citation89] that glucose deficiency induces GRP78 expression with the consequent increase of glutamine metabolism, it is not surprising that we detected a decrease of glycolysis during calcium treatment. The ER stress has also been correlated with a decreases of Krebs cycle [Citation69]. Indeed, the carbon skeletons of certain amino acids derived from proteins can feed into the citric acid cycle, as for instance tyrosine. This amino acid, was found down regulated after calcium treatment, possibly causing a malate/fumarate deficiency and down-regulating the Krebs cycle. It is of note that tyrosine is also present, up to 22% of the amino acids residues, in keratin 1 and keratin 10 [Citation90], components of the cytoskeleton of differentiated keratinocytes.
Protein homeostasis in the ER is strongly connected to the formation of native disulfide bonds during protein folding, which also requires reduction of non-native bonds [Citation91]. The members of the protein disulfide isomerase (PDI) family are important catalysts of these thiol–disulfide exchange reactions [Citation92,Citation93]. In line with this findings, transcriptomic analysis showed an upregulation of PDI. This oxidative mechanism is antagonized by the low molecular weight thiol compound glutathione (GSH), which maintains a reduced fraction of PDIs [Citation94–Citation96]. GSH-mediated reduction results in the formation of its dimeric oxidized form glutathione disulfide (GSSG). The presence of oxidizing and reducing components in the ER allows a dynamic control of the redox state [Citation97]. Interestingly, metabolomic analysis showed that during ER stress oxidized glutathione increased significantly. In this regard, the re-increased glycolytic intermediated recorded after third-six days of calcium-induced differentiation did not fueled Krebs cycle, which resulted reduced and keep going down in function of time, but the PPP pathway. This metabolism allowed the cells to produce more NADH that is necessary to reduce oxidized glutathione. This switch is in part regulated by the transcription factor p63 [Citation98–Citation102]. p63 affects glycolysis by directly regulating the expression of hexokinase II, This latter is the glycolytic enzyme that controls the first step of glucose utilization and it is strongly dependent by p63 activity [Citation98,Citation102]. However, during the late stages of differentiation, the glycolysis slows down and metabolites could then shift towards pyruvate and then enter in Krebs, or in PPP cycle. PPP metabolism plays a role in defending cells against oxidant metabolites as well as in ER stress [Citation103].
Both proteomic, transcriptomics and western blotting analysis revealed that levels of RAD23 protein were decreased during calcium treatment. RAD23, being involved in regulating ER-associated protein degradation, designates a cellular pathway which targets misfolded proteins of the endoplasmic reticulum for ubiquitination and subsequent degradation by the proteasome, protein-degrading complex. Interestingly, RAD23 was originally identified as an important factor involved in the recognition of DNA damage, suggesting a possible link between ubiquitin/proteasome system (UPS) and DNA repair during keratinocyte differentiation [Citation104]. The decrease of RAD23 might be in line with the variation of DNA damage recognition proteins, such as DDB2 and XPC, detected during keratinocyte differentiation [Citation105].
These studies, combining proteome, transcriptome and metabolome data could be an useful tool to better understand the mechanism of normal epidermal keratinocyte differentiation in physiological and pathological conditions [Citation106–Citation109]. Differential approaches revealed UPR activation and ER stress during in vitro induced differentiation of primary human keratinocytes. Abnormal UPR has been implicated in hereditary keratosis, including Darier’s disease, ichthyosis congenita, erythro-keratoderma variabilis, and ichthyosis follicularis [Citation17]. Taken together all of these data may be relevant to clarify pathological mechanisms and possible therapeutically treatments for skin diseases.
Supplemental Material
Download PDF (645.9 KB)Disclosure statement
No potential conflict of interest was reported by the authors.
Supplemental material
Supplemental data for this article can be accessed here.
Additional information
Funding
Related Research Data
References
- Fuchs E. Epidermal differentiation: the bare essentials. J Cell Biol. 1990;111:2807–2814.
- Polakowska RR, Haake AR. Apoptosis: the skin from a new perspective. Cell Death Differ. 1994;1:19–31.
- Candi E, Schmidt R, Melino G. The cornified envelope: a model of cell death in the skin. Nat Rev Mol Cell Biol. 2005;6:328–340.
- Amoh Y, Hoffman R. Hair follicle-associated-pluripotent (HAP) stem cells. Cell Cycle. 2017;16:2169–2175.
- Tohgi N, Obara K, Yashiro M, et al. Human hair-follicle associated pluripotent (hHAP) stem cells differentiate to cardiac-muscle cells. Cell Cycle. 2017;16:95–99.
- Bikle DD, Xie Z, Tu CL. Calcium regulation of keratinocyte differentiation. Expert Rev Endocrinol Metab. 2012;7:461–472.
- Savini I, Catani MV, Rossi A, et al. Characterization of keratinocyte differentiation induced by ascorbic acid: protein kinase C involvement and vitamin C homeostasis. J Invest Dermatol. 2002;118:372–379.
- Borowiec AS, Delcourt P, Dewailly E, et al. Optimal differentiation of in vitro keratinocytes requires multifactorial external control. PLoS One. 2013;8:e77507.
- Seo EY, Namkung JH, Lee KM, et al. Analysis of calcium-inducible genes in keratinocytes using suppression subtractive hybridization and cDNA microarray. Genomics. 2005;86:528–538.
- Palombo R, Savini I, Avigliano L, et al. Luteolin-7-glucoside inhibits IL-22/STAT3 pathway, reducing proliferation, acanthosis, and inflammation in keratinocytes and in mouse psoriatic model. Cell Death Dis. 2016;7:e2344-e2344.
- Elsholz F, Harteneck C, Muller W, et al. Calcium - A central regulator of keratinocyte differentiation in health and disease. Eur J Dermatol. 2014;24(6):650–661
- Candi E, Cipollone R, Rivetti di Val Cervo P, et al. p63 in epithelial development. Cell Mol Life Sci. 2008;65:3126–3133.
- Eckhart L, Lippens S, Tschachler E, et al. Cell death by cornification. Biochim Biophys Acta Mol Cell Res. 2013;1833:3471–3480.
- Yuspa SH, Ben T, Hennings H. The induction of epidermal transglutaminase and terminal differentiation by tumor promoters in cultured epidermal cells. Carcinogenesis. 1983;4:1413–1418.
- Yuspa SH, Kilkenny AE, Steinert PM, et al. Expression of murine epidermal differentiation markers is tightly regulated by restricted extracellular calcium concentrations in vitro. J Cell Biol. 1989;109:1207–1217.
- Wikramanayake TC, Stojadinovic O, Tomic-Canic M. Epidermal differentiation in barrier maintenance and wound healing. Adv Wound Care. 2014;3:272–280.
- Sugiura K. Unfolded protein response in keratinocytes: impact on normal and abnormal keratinization. J Dermatol Sci. 2013;69:181–186.
- Sugiura K, Muro Y, Nishizawa Y, et al. LEDGF/DFS70, a major autoantigen of atopic dermatitis, is a component of keratohyalin granules. J Invest Dermatol. 2007;127:75–80.
- Hetz C. The unfolded protein response: controlling cell fate decisions under ER stress and beyond. Nat Rev Mol Cell Biol. 2012;13:89–102.
- Sabnis AJ, Bivona TG. HSP70 dependence in rhabdomyosarcoma: seed or soil? Cell Cycle. 2017;16:147–148.
- Xia D, Ji W, Xu C, et al. Knockout of MARCH2 inhibits the growth of HCT116 colon cancer cells by inducing endoplasmic reticulum stress. Cell Death Dis. 2017;8:e2957.
- Kindås-Mügge I, Trautinger F. Increased expression of the M(r) 27,000 heat shock protein (hsp27) in in vitro differentiated normal human keratinocytes. Cell Growth Differ. 1994;5(7):777–781
- Zhang K, Kaufman RJ. From endoplasmic-reticulum stress to the inflammatory response. Nature. 2008;454:455–462.
- Gardner BM, Pincus D, Gotthardt K, et al. Endoplasmic reticulum stress sensing in the unfolded protein response. Cold Spring Harb Perspect Biol. 2013;5(3):a013169
- Walter P, Ron D. The unfolded protein response: from stress pathway to homeostatic regulation. Science. 2011;334(6059):1081–1086
- Aubrey BJ, Kelly GL, Janic A, et al. How does p53 induce apoptosis and how does this relate to p53-mediated tumour suppression? Cell Death Differ. 2018;25:104–113.
- Baugh EH, Ke H, Levine AJ, et al. Why are there hotspot mutations in the TP53 gene in human cancers? Cell Death Differ. 2018;25:154–160.
- Sullivan KD, Galbraith MD, Andrysik Z, et al. Mechanisms of transcriptional regulation by p53. Cell Death Differ. 2018;25:133–143.
- Wu D, Prives C. Relevance of the p53-MDM2 axis to aging. Cell Death Differ. 2018;25:169–179.
- Charni M, Aloni-Grinstein R, Molchadsky A, et al. P53 on the crossroad between regeneration and cancer. Cell Death Differ. 2017;8–14.
- Engeland K. Cell cycle arrest through indirect transcriptional repression by p53: I have a DREAM. Cell Death Differ. 2018;25:114–132.
- Furth N, Aylon Y, Oren M. P53 shades of Hippo. Cell Death Differ. 2018;25:81–92.
- Furth N, Aylon Y. The LATS1 and LATS2 tumor suppressors: beyond the hippo pathway. Cell Death Differ. 2017;24:1488–1501.
- Kaiser AM, Attardi LD. Deconstructing networks of p53-mediated tumor suppression in vivo. Cell Death Differ. 2018;25:93–103.
- Kim MP, Lozano G. Mutant p53 partners in crime. Cell Death Differ. 2018;25:161–168.
- Nemajerova A, Amelio I, Gebel J, et al. Non-oncogenic roles of TAp73: from multiciliogenesis to metabolism. Cell Death Differ. 2018;25:144–153.
- Parrales A, Thoenen E, Iwakuma T. The interplay between mutant p53 and the mevalonate pathway. Cell Death Differ. 2018;25:460–470.
- Adams JM, Cory S. The BCL-2 arbiters of apoptosis and their growing role as cancer targets. Cell Death Differ. 2018;25:27–36.
- Galluzzi L, Vitale I, Aaronson SA, et al. Molecular mechanisms of cell death: recommendations of the nomenclature committee on cell death 2018. Cell Death Differ. 2018;25:486–541.
- Kale J, Osterlund EJ, Andrews DW. BCL-2 family proteins: changing partners in the dance towards death. Cell Death Differ. 2018;25:65–80.
- Kalkavan H, Green DR. MOMP, cell suicide as a BCL-2 family business. Cell Death Differ. 2018;25:46–55.
- Montero J, Letai A. Why do BCL-2 inhibitorswork and where should we use them in the clinic? Cell Death Differ. 2018;25:56–64.
- Mukherjee A, Williams DW. More alive than dead: non-apoptotic roles for caspases in neuronal development, plasticity and disease. Cell Death Differ. 2017;24:1411–1421.
- Opferman JT, Kothari A. Anti-apoptotic BCL-2 family members in development. Cell Death Differ. 2018;25:37–45.
- Pihán P, Carreras-Sureda A, Hetz C. BCL-2 family: integrating stress responses at the ER to control cell demise. Cell Death Differ. 2017;24:1478–1487.
- Strasser A, Vaux DL. Viewing BCL2 and cell death control from an evolutionary perspective. Cell Death Differ. 2018;25:13–20.
- Pekarsky Y, Balatti V, Croce CM. BCL2 and miR-15/16: from gene discovery to treatment. Cell Death Differ. 2018;25:21–26.
- Schröder M, Kaufman RJ. ER stress and the unfolded protein response. Mutat Res. 2005;569:29–63.
- Bertolotti A, Zhang Y, Hendershot LM, et al. Dynamic interaction of BiP and ER stress transducers in the unfolded-protein response. Nat Cell Biol. 2000;2:326–332.
- Okamura K, Kimata Y, Higashio H, et al. Dissociation of Kar2p/BiP from an ER sensory molecule, Ire1p, triggers the unfolded protein response in yeast. Biochem Biophys Res Commun. 2000;279:445–450.
- Shen J, Chen X, Hendershot L, et al. ER stress regulation of ATF6 localization by dissociation of BiP/GRP78 binding and unmasking of golgi localization signals. Dev Cell. 2002;3:99–111.
- Ron D, Harding HP, Zhang Y. Protein translation and folding are coupled by an endoplasmic-reticulum-resident kinase. Nature. 1999;397:271–274.
- Lee A-H, Iwakoshi NN, Glimcher LH. XBP-1 regulates a subset of endoplasmic reticulum resident chaperone genes in the unfolded protein response. Mol Cell Biol. 2003;23:7448–7459.
- Yamamoto K, Sato T, Matsui T, et al. Transcriptional Induction of mammalian ER quality control proteins is mediated by single or combined action of ATF6α and XBP1. Dev Cell. 2007;13:365–376.
- Shoulders MD, Ryno LM, Genereux JC, et al. Stress-independent activation of XBP1s and/or ATF6 reveals three functionally diverse ER proteostasis environments. Cell Rep. 2013;3:1279–1292.
- Adachi Y, Yamamoto K, Okada T, et al. ATF6 is a transcription factor specializing in the regulation of quality control proteins in the endoplasmic reticulum. Cell Struct Funct. 2008;33:75–89.
- Hegde RS, Ploegh HL. Quality and quantity control at the endoplasmic reticulum. Curr Opin Cell Biol. 2010;22:437–446.
- Shevchenko A, Wilm M, Vorm O, et al. Mass spectrometric sequencing of proteins from silver-stained polyacrylamide gels. Anal Chem. 1996;68:850–858.
- Smirnov A, Lena AM, Cappello A, et al. ZNF185 is a p63 target gene critical for epidermal differentiation and squamous cell carcinoma development. Oncogene. 2018;38(10):1625–1638
- Dunham I, Kundaje A, Aldred SF, et al.; ENCODE. An integrated encyclopedia of DNA elements in the human genome. Nature. 2012;489:57–74.
- Corley SM, Mendoza-reinoso V, Giles N, et al. Plau and Tgfbr3 are YAP-regulated genes that promote keratinocyte proliferation. Cell Death Dis. 2018;9:1106.
- Goldie SJ, Cottle DL, Tan FH, et al. Loss of GRHL3 leads to TARC/CCL17-mediated keratinocyte proliferation in the epidermis. Cell Death Dis. 2018;9(11):1072.
- Peng L, Li Q, Wang H, et al. Fn14 deficiency ameliorates psoriasis-like skin disease in a murine model. Cell Death Dis. 2018;9(8):801.
- Bigas J, Sevilla LM, Carceller E, et al. Epidermal glucocorticoid and mineralocorticoid receptors act cooperatively to regulate epidermal development and counteract skin inflammation article. Cell Death Dis. 2018;9(6):588.
- Gutowska-Owsiak D, De La Serna JB, Fritzsche M, et al. Orchestrated control of filaggrin-actin scaffolds underpins cornification. Cell Death Dis. 2018;9(4):412.
- Carreras-Sureda A, Pihán P, Hetz C. Calcium signaling at the endoplasmic reticulum: fine-tuning stress responses. Cell Calcium. 2018;70:24–31.
- Higgins R, JM G, Rising L, et al. The unfolded protein response triggers site-specific regulatory ubiquitylation of 40s ribosomal proteins. Mol Cell. 2015;59:35–49.
- Chen FW, Ioannou YA. Ribosomal proteins in cell proliferation and apoptosis. Int Rev Immunol. 1999;18:429–448.
- Wang X, Eno CO, Altman BJ, et al. ER stress modulates cellular metabolism. Biochem J. 2011;435:285–296.
- Venkatesh S, Suzuki CK. HSP60 takes a hit: inhibition of mitochondrial protein folding. Cell Chem Biol. 2017;24:543–545.
- Zhao L, Ackerman S. Endoplasmic reticulum stress in health and disease. Curr Opin Cell Biol. 2006;18:444–452.
- Zhao L, Rosales C, Seburn K, et al. Alteration of the unfolded protein response modifies neurodegeneration in a mouse model of Marinesco-Sjögren syndrome. Hum Mol Genet. 2010;19:25–35.
- Spector DL, Ochs RL, Busch H. Silver staining, immunofluorescence, and immunoelectron microscopic localization of nucleolar phosphoproteins B23 and C23. Chromosoma. 1984;90:139–148.
- Szegedi K, Göblös A, Bacsa S, et al. Expression and functional studies on the noncoding RNA, PRINS. Int J Mol Sci. 2013;14:205–225.
- Feuerstein N, Spiegel S, Mond JJ. The nuclear matrix protein, numatrin (B23), is associated with growth factor-induced mitogenesis in Swiss 3T3 fibroblasts and with T lymphocyte proliferation stimulated by lectins and anti-T cell antigen receptor antibody. J Cell Biol. 1988;107:1629–1642.
- Feuerstein N, Chan PK, Mond JJ. Identification of numatrin, the nuclear matrix protein associated with induction of mitogenesis, as the nucleolar protein B23. Implication for the role of the nucleolus in early transduction of mitogenic signals. J Biol Chem. 1988;263:10608–10612.
- Sasikumar AN, Perez WB, Kinzy TG. The many roles of the eukaryotic elongation factor 1 complex. Wiley Interdiscip Rev RNA. 2012;3:543–555.
- Kaitsuka T, Matsushita M. Regulation of translation factor EEF1D gene function by alternative splicing. Int J Mol Sci. 2015;16:3970–3979.
- Ni M, Zhang Y, Lee AS. Beyond the endoplasmic reticulum: atypical GRP78 in cell viability, signalling and therapeutic targeting. Biochem J. 2011;434:181–188.
- Misra UK, Deedwania R, Pizzo SV. Activation and cross-talk between Akt, NF-κB, and unfolded protein response signaling in 1-LN prostate cancer cells consequent to ligation of cell surface-associated GRP78. J Biol Chem. 2006;281:13694–13707.
- Kelber JA, Panopoulos AD, Shani G, et al. Blockade of Cripto binding to cell surface GRP78 inhibits oncogenic Cripto signaling via MAPK/PI3K and Smad2/3 pathways. Oncogene. 2009;28:2324–2336.
- Davidson DJ, Haskell C, Majest S, et al. Kringle 5 of human plasminogen induces apoptosis of endothelial and tumor cells through surface-expressed glucose-regulated protein 78. Cancer Res. 2005;65:4663–4672.
- Higashi K, Hasegawa M, Yokoyama C, et al. Dermokine-β impairs ERK signaling through direct binding to GRP78. FEBS Lett. 2012;586:2300–2305.
- Gardner BM, Walter P. Unfolded proteins are Ire1-activating ligands that directly induce the unfolded protein response. Science. 2011;333:1891–1894.
- Luo B, Lee AS. The critical roles of endoplasmic reticulum chaperones and unfolded protein response in tumorigenesis and anticancer therapies. Oncogene. 2013;32:805–818.
- Tsai YL, Zhang Y, Tseng CC, et al. Characterization and mechanism of stress-induced translocation of 78-kilodalton glucose-regulated protein (GRP78) to the cell surface. J Biol Chem. 2015;290:8049–8064.
- Ehren JL, Maher P. Concurrent regulation of the transcription factors Nrf2 and ATF4 mediates the enhancement of glutathione levels by the flavonoid fisetin. Biochem Pharmacol. 2013;85:1816–1826.
- Li Z, Wang Y, Wu H, et al. GRP78 enhances the glutamine metabolism to support cell survival from glucose deficiency by modulating the b-catenin signaling. Oncotarget. 2014;5.
- Zhang L, Li Z, Shi T, et al. Design, purification and assessment of GRP78 binding peptide-linked Subunit A of Subtilase cytotoxic for targeting cancer cells. BMC Biotechnol. 2016;16.
- Matsunaga R, Abe R, Ishii D, et al. Bidirectional binding property of high glycine-tyrosine keratin-associated protein contributes to the mechanical strength and shape of hair. J Struct Biol. 2013;183:484–494.
- Braakman I, Bulleid NJ. Protein folding and modification in the mammalian endoplasmic reticulum. Annu Rev Biochem. 2011;80:71–99.
- Ellgaard L, Ruddock LW. The human protein disulphide isomerase family: substrate interactions and functional properties. EMBO Rep. 2005;6:28–32.
- Onda Y, Kobori Y. Differential activity of rice protein disulfide isomerase family members for disulfide bond formation and reduction. FEBS Open Bio. 2014;4:730–734.
- Chakravarthi S, Jessop CE, Bulleid NJ. The role of glutathione in disulphide bond formation and endoplasmic-reticulum-generated oxidative stress. EMBO Rep. 2006;7:271–275.
- Chen L, Zhao M, Li J, et al. Critical role of X-box binding protein 1 in NADPH oxidase 4-triggered cardiac hypertrophy is mediated by receptor interacting protein kinase 1. Cell Cycle. 2017;16:348–359.
- Kranz P, Neumann F, Wolf A, et al. PDI is an essential redox-sensitive activator of PERK during the unfolded protein response (UPR). Cell Death Dis. 2017;8:e2986.
- Appenzeller-Herzog C, Riemer J, Zito E, et al. Disulphide production by Ero1α-PDI relay is rapid and effectively regulated. Embo J. 2010;29:3318–3329.
- Viticchiè G, Agostini M, Lena AM, et al. p63 supports aerobic respiration through hexokinase II. Proc Natl Acad Sci. 2015;112:11577–11582.
- D’Alessandro A, Amelio I, Berkers CR, et al. Metabolic effect of TAp63 enhanced glycolysis and pentose phosphate pathway, resulting in increased antioxidant defense. Oncotarget. 2014;5(17):7722–7733.
- Giacobbe A, Bongiorno-Borbone L, Bernassola F, et al. P63 regulates glutaminase 2 expression. Cell Cycle. 2013;12:1395–1405.
- Rivetti di Val Cervo P, AM L, Nicoloso M, et al. p63-microRNA feedback in keratinocyte senescence. Proc Natl Acad Sci. 2012;109:1133–1138.
- Candi E, Smirnov A, Panatta E, et al. Metabolic pathways regulated by p63. Biochem Biophys Res Commun. 2017;482(3):440–444.
- Dodson M, Darley-Usmar V, Zhang J. Cellular metabolic and autophagic pathways: traffic control by redox signaling. Free Radic Biol Med. 2013;63:207–221.
- Dantuma NP, Heinen C, Hoogstraten D. The ubiquitin receptor Rad23: at the crossroads of nucleotide excision repair and proteasomal degradation. DNA Repair (Amst). 2009;8:449–460.
- Oh DH, Yeh K. Differentiating human keratinocytes are deficient in p53 but retain global nucleotide excision repair following ultraviolet radiation. DNA Repair (Amst). 2005;4:1149–1159.
- de Pedro I, Alonso-Lecue P, Sanz-Gómez N, et al. Sublethal UV irradiation induces squamous differentiation via a p53-independent, DNA damage-mitosis checkpoint. Cell Death Dis. 2018;9(11):1094.
- Messenger Z, Hall J, Jima D, et al. C/EBPβ deletion in oncogenic Ras skin tumors is a synthetic lethal event. Cell Death Dis. 2018;9:1054.
- Singh TP, Vieyra-Garcia PA, Wagner K, et al. Cbl-b deficiency provides protection against UVB-induced skin damage by modulating inflammatory gene signature. Cell Death Dis. 2018;9(8):835.
- Singh B, Schoeb TR, Bajpai P, et al. Reversing wrinkled skin and hair loss in mice by restoring mitochondrial function. Cell Death Dis. 2018;9(7):735.