
ABSTRACT
To investigate the significance of expression of HIF-1α, HIF-2α, and SNAIL1 proteins; and TGF-β signaling pathway proteins in ccRCC, their relation with clinicopathological parameters and patient’s survival were examined. We also investigated potential crosstalk between HIF-α and TGF-β signaling pathway, including the TGF-β type 1 receptor (ALK5-FL) and the intracellular domain of ALK5 (ALK5-ICD). Tissue samples from 154 ccRCC patients and comparable adjacent kidney cortex samples from 38 patients were analyzed for HIF-1α/2α, TGF-β signaling components, and SNAIL1 proteins by immunoblot. Protein expression of HIF-1α and HIF-2α were significantly higher, while SNAIL1 had similar expression levels in ccRCC compared with the kidney cortex. HIF-2α associated with poor cancer-specific survival, while HIF-1α and SNAIL1 did not associate with survival. Moreover, HIF-2α positively correlated with ALK5-ICD, pSMAD2/3, and PAI-1; HIF-1α positively correlated with pSMAD2/3; SNAIL1 positively correlated with ALK5-FL, ALK5-ICD, pSMAD2/3, PAI-1, and HIF-2α. Intriguingly, in vitro experiments performed under normoxic conditions revealed that ALK5 interacts with HIF-1α and HIF-2α, and promotes their expression and the expression of their target genes GLUT1 and CA9, in a VHL dependent manner. We found that ALK5 induces expression of HIF-1α and HIF-2α, through its kinase activity. Under hypoxic conditions, HIF-α proteins correlated with the activated TGF-β signaling pathway. In conclusion, we reveal that ALK5 plays a pivotal role in synergistic crosstalk between TGF-β signaling and hypoxia pathway, and that the interaction between ALK5 and HIF-α contributes to tumor progression.
Introduction
Renal cell carcinoma (RCC) accounts for 3% of all adult malignancies and is the 13th most common malignancy diagnosed worldwide annually [Citation1]. RCC is composed of different subtypes with specific genetic changes [Citation2]. Clear cell RCC (ccRCC) is the most common histological subtype of RCC. Though ccRCC occurs as a part of a rare inherited cancer syndrome called von Hippel–Lindau (VHL) disease, a vast majority of the cases are sporadic [Citation3]. Sporadic ccRCC is frequently associated with alterations of the tumor suppressor VHL gene. These alterations include mutations, promoter hypermethylation, and loss of heterozygosity at the VHL locus. Different mutations in VHL leads to quantitative or qualitative alterations of functions of the VHL gene product: VHL protein or pVHL (referred to as VHL in this study) [Citation4]. pVHL is a component of the E3 ubiquitin-protein ligase complex, and its involvement in the ubiquitin conjugation system leads to targeted degradation of substrate proteins [Citation5]. The prime established function of pVHL is its ability to bind to Hypoxia-inducible factors (HIFs) in an oxygen-dependent manner [Citation6]. Hypoxia-inducible factors (HIFs) are transcription factors that are modulated by hypoxia, they are heterodimers consisting of an oxygen sensing alpha subunit (HIF-1α, HIF-2α, and HIF-3α) and stably expressed β subunit [Citation7]. Under conditions of normoxia, pVHL binds to the hydroxylated HIF-α and subjects it to ubiquitination and proteasomal degradation. However, under hypoxic conditions or dysfunctional pVHL (due to mutation, like in ccRCC); HIF-α units are stabilized and dimerize with HIF-β in the nucleus, this leads to HIF-α binding to DNA and subsequent stimulation of target gene expression [Citation6,Citation7]. Carbonic Anhydrase 9 (CA9) and glucose transporter-1 (GLUT1) are intrinsic markers of hypoxia and are HIF-α target genes [Citation8]; these proteins are also elevated in ccRCC [Citation9,Citation10]. Apart from regulating HIFs, pVHL also negatively modulates transforming growth factor-β (TGF-β) pathways in ccRCC [Citation11–Citation13].
TGF-β plays a vital role in the regulation of immune responses, tissue homeostasis [Citation14,Citation15] and transduces signals involved in various context-dependent cellular processes like proliferation, differentiation, epithelial-mesenchymal transition (EMT), growth arrest and apoptosis [Citation16–Citation18].
In the canonical TGF-β pathway, the signal initiated by the TGF-β ligand is transmitted by its binding to, and subsequent oligomerization of the transmembrane heterotetrameric serine-threonine kinase receptor complex consisting of TGF-β Type II receptor and Type I receptor (TβRII/TβRI). In this complex the TβRI is activated and will in turn by phosphorylation of the intracellular SMAD2/SMAD3 in their C-terminal part, transform them to become active as transcriptional co-factors in a complex together with SMAD4 to contextually trigger the downstream specific target genes involved in tumor progression such as Plasminogen Activator Inhibitor-1(PAI-1) [Citation14,Citation17,Citation19,Citation20].
The non-canonical TGF-β pathway is in part transmitted through an intracellular domain of TβRI (TβRI-intracellular domain or TβRI-ICD or ALK5-ICD) which is liberated from the cell membrane after cleavage of ALK5-full length (ALK5-FL) by proteolytic enzymes [Citation21,Citation22]. Then ALK5-ICD is translocated to the nucleus of tumor cells and promotes tumor progression, although the exact mechanism needs to be further elucidated [Citation18,Citation21–Citation23].
In our recent study, we found that pVHL targets the TβRI (ALK5-FL) for degradation through K48-linked poly-ubiquitination, thus negatively controlling canonical TGF-β induced cancer cell invasiveness which is a novel function for pVHL in ccRCC [Citation13]. Previously we have also demonstrated that canonical and non-canonical TGF-β signaling contributes to the aggressiveness of ccRCC [Citation24].
EMT results in cells acquiring an invasive phenotype and TGF-β pathway plays a pivotal role in EMT through its downstream target SNAIL1, which is a transcription factor [Citation25,Citation26]. Both canonical and non-canonical pathways induce SNAIL1 expression [Citation26,Citation27]. Activation of SNAIL1, in turn, regulates the expression of crucial mesenchymal markers. We have recently reported that TGF-β stimulation of prostate cancer cells in vitro enhances SNAIL1 sumoylation and that sumoylation is important for the transcriptional function of SNAIL1 [Citation28]. Hypoxia also induces SNAIL1 expression [Citation29–Citation31].
Tumor suppressor E-cadherin maintains cell-cell adhesion and contributes to maintaining a non-invasive epithelial phenotype [Citation25]. A hallmark of EMT is the downregulation of E-cadherin, which is balanced by enhanced N-cadherin expression; and, this “cadherin switch” leads to alteration in cell adhesions and confers them with an invasive mesenchymal phenotype. SNAIL1 induces EMT by repressing E-cadherin gene expression and enhancing N-cadherin expression [Citation25,Citation32–Citation34].
Long-term exposure to hypoxia enhances TGF-β signaling via SMAD proteins [Citation35,Citation36]; reciprocally, TGF-β is also known to induce HIF-1α stabilization and expression [Citation37]. Several studies have demonstrated that the HIF pathway and TGF-β pathway incite each other to promote diverse activities, including EMT and tumor progression in different cancers [Citation38–Citation40].
In this study, our aim was to get a better understanding of the interaction between HIF-α and TGF-β pathway in ccRCC. We therefore quantified protein levels of HIF-1α, HIF-2α, and SNAIL1 in ccRCC patient samples and investigated its effect on clinicopathological parameters and patient survival. We also investigated how these proteins correlated with signaling components of the TGF-β pathway and VHL status. Further, we show that ALK5 effectively promoted components of the hypoxia pathway, even under normoxic conditions, and was found to be physically associated with HIF-α proteins.
Materials and methods
Patients
Tumor and kidney cortex samples from the tumor-bearing kidney were obtained after nephrectomy as described previously [Citation41]. The study involved 154 (64 female and 90 male) patients with ccRCC, surgically treated between 2000 and 2009. Their median age was 66 years (range 32–87 years), and the mean tumor size was 70 mm (range 12–190 mm). The number of samples for each protein depended on the availability of samples. The RCC types were classified according to the Heidelberg consensus conference [Citation42]. Tumor stage was determined following the TNM classification system 2009 [Citation43]. In ccRCC, there were 59 patients in TNM stage I (38.40%), 25 patients in stage II (16.1%), 30 patients in stage III (19.5%), and 40 patients in stage IV (26.0%). The nuclear grade was determined according to Fuhrman et al. [Citation44]. In ccRCC, there were 18 tumors (11.7%) grade 1, 58 (37.7%) tumors grade 2, 51 (33.1%) tumors grade 3, and 27 (17.5%) tumors grade 4. For statistical use, grades I and II were considered as lower grade tumors, and grades III and grade IV were considered as the higher grade tumors. Similarly, TNM stage I and stage II were considered as early stage, and stage III and stage IV as an advanced stage. Patient follow-up performed in a scheduled program was used for survival analysis. At the last follow-up, 61 (39.6%) patients with ccRCC had no evidence of disease, 6 (3.9%) were alive with disease, 60 (39.0%) died of the disease, and 27 (17.5%) died due to other reasons. All clinical samples utilized in our studies were collected after obtaining informed and signed consent from the patients. Our study is approved by the Institutional review board, and the Ethical committee of Northern Sweden.
Additionally, cancer-specific and overall survival curves were obtained from mRNA (RNA-seq) dataset using KM-plotter (http://www.kmplot.com/analysis/) [Citation45] and OncoLnc (http://www.oncolnc.org/) [Citation46].
Renal cell carcinoma cell lines
In this study, we used the ACHN and A498 human renal cell carcinoma cell lines, to investigate the biological function of TGFβ-signaling in correlation to VHL. All cell lines were authenticated by STR profiling (IdentiCell, Denmark). ACHN and A498 cell lines were purchased from ATCC (Wesel, Germany). ACHN cells were cultured in EMEM media (ATCC) supplemented with 10% FBS. A498 cells were cultured in RPMI media (Sigma-Aldrich, St. Louis, MO, USA) supplemented with 10% FBS.
These cell lines were selected based on their responsiveness to TGF-β [Citation13,Citation24], their expression of VHL: ACHN (VHL+/+) [Citation47] and A498 (VHL −/-) [Citation47,Citation48], and that they should express HIF-1α and HIF-2α [Citation49]. It has previously been reported that ACHN is of papillary type [Citation50–Citation52]. However, early studies have classified it as poorly differentiated clear cell type [Citation53], and gene expression analysis have revealed similarities to clear cell tumors, especially when concerning the MYC pathway [Citation54]. The A498 cell line is known to harbor a VHL mutation, which is causing the loss of expression of VHL [Citation47,Citation48]. Thus, A498 cell has frequently been used as a model for ccRCC [Citation48,Citation55,Citation56] even if one study has described it as papillary type [Citation57].
In vitro studies
One day before transfection, ACHN, and A498 cells were seeded into 10 cm plates (1x10⁶ cells/plate). ACHN cells were transfected with pcDNA 3.1(+) or C-terminally hemagglutinin (HA)-tagged ALK5 (ALK5-HA) [Citation21] or ALK5-HA and siVHL (Cat#4390824, Ambicon, Thermo Fisher Scientific, Waltham, MA, USA). The transfection was performed using Fugene 6 (Promega, Fitchburg, WI, USA). siVHL was transfected by using RNAimax (Thermo Fisher Scientific). A498 cells were transfected with pcDNA 3.1(+) or ALK5-HA, or ALK5-HA and VHL (NM_000551.2, Origene Technologies, Inc., Rockville, MD, USA) using Fugene 6 (Promega).
The next day, cells were starved for 12h in media containing 2% FBS (starvation media), followed by treatment with 10 ng/ml TGF-β1 (R&D system, Minneapolis, MN, USA) for 6 hours. A selective kinase inhibitor of TβRI; 100 µM RepSox (Tocris, Cat. No. 3742/10) was added to cells 6h before TGF-β1 stimulation to inhibit the kinase activity of TβRI. For the induction of hypoxia, AHCN and A498 cells were treated with 300 µM COCl2 (Tocris, Bristol, UK) for 3h and 6h. Cells without treatment served as control. After the indicated time points, cells were collected for protein extraction.
Protein extraction and analysis
Total protein lysates from the ccRCC tissues samples were extracted as described previously [Citation24]. For in vitro cell culture work, total cell lysates were prepared using RIPA buffer (Thermo Fisher Scientific) as suggested in the manufacturer’s manual. Total proteins per µL of lysate were measured using the bicinchoninic acid assay (BCA assay) (Thermo Fisher Scientific) following the manufacturer’s guidelines.
Immunoblotting
Total proteins (30 μg) were separated by NuPAGE Novex 4–12% gels or NuPAGE Novex 7% gels or NuPAGE Novex 12% gels or NuPAGE Novex 3–8% gels (Life Technologies, Carlsbad, CA, USA) in XCell SureLock™ Mini-Cell (Life Technologies), and transferred onto nitrocellulose membrane using Transblot Turbo transfer system (Bio-Rad Laboratories, Hercules, CA, USA). Based on the antibodies, the membranes were blocked in 5% BSA or Odyssey blocking buffer (Licor Biosciences, Lincoln, NE, USA) diluted in Tris-Buffered Saline, for 1h at room temperature. The membranes were incubated overnight at 4°C with gentle agitation with the indicated primary antibodies; HIF-1α (NB100-134, Novus Biologicals, Littleton, CO, USA), HIF-2α (NB100-122, NB100-132, Novus Biologicals), SNAIL1 (#3879, Cell Signaling Technology, Denver, MA, USA), HA (CST #2367, Cell Signaling Technology), TβRI or ALK5 (V-22), (sc-398, Santa Cruz Biotechnology, Santa Cruz, CA, USA), which identifies ALK5-FL and ALK5-ICD, as previously reported [Citation21], phospho-SMAD2 (CST #3108, Cell Signaling Technology), SMAD2 (CST #3103, Cell Signaling Technology), PAI-1/Serpine1 (NBP1-19773, Novus Biologicals), VHL (VHL40 or VHL-G7, Santa Cruz Biotechnology), VHL (NB100-485, Novus Biologicals), CA9 (ab15086 Abcam, Cambridge, MA, USA), GLUT-1 (PA1-46152, Thermo Fischer Scientific), E-Cadherin (ab76055, Abcam), N-Cadherin (ab18203, Abcam), and β-actin (A5316, Sigma-Aldrich, St. Louis, MO, USA). The primary antibodies were detected using secondary antibody IRDye® 800CW Goat Anti-Rabbit (Licor #926-32211, Licor Biosciences) or IRDye® 680CW Goat anti-mouse (Licor #925-68070, Licor Biosciences). Odyssey CLx (Licor Biosciences) Infrared Imaging system was used to visualize the membranes, and Image Studio SystemTM software version 3.1 (Licor Biosciences) was utilized for densitometry. The relative numerical density values for all the proteins were calculated by dividing the density value of housekeeping protein β-actin.
Immunoprecipitation
For immunoprecipitation (IP), ACHN cells were transfected with ALK5-HA or co-transfected with ALK5-HA and siVHL, followed by starvation for 12h and stimulation with TGF-β for 6h. A498 cells were transfected with ALK5-HA or co-transfected with ALK5-HA and VHL, followed by starvation for 12h and stimulation with TGF-β for 6h.
For IP, total cell lysate was prepared from the collected cells and immunoprecipitated using the indicated antibody. Immunoblotting was performed and then probed with either HA (CST #2367) or HIF-1α (NB100-134, Novus Biologicals) or HIF-2α (NB100-132, Novus Biologicals) or ALK5 (V22) antibody. The primary antibodies were detected by Quick Western Kit–IRDye® 680RD (#926–68100, Licor Biosciences) following manufacturer’s instructions.
Proximity ligation assay (PLA)
On the day preceding transfection, ACHN (5x10⁵) and A498 (5x10⁵) cells were seeded onto two well chamber slide. ACHN cells were transfected with ALK5-HA or co-transfected with siVHL and ALK5-HA. A498 cells were transfected with ALK5-HA or co-transfected with ALK5-HA and VHL vectors. Cells transfected with ALK5-HA were treated with TGF-β (10 ng/ml) for 6h. In both cell lines, cells were transfected with ALK5-HA, but not incubated with one of the primary antibodies during PLA and thus served as a negative control for PLA. PLA was performed using Duolink® proximity ligation assay (PLA®, Sigma-Aldrich) following the manufacturer’s instructions. In brief, cells were washed with PBS and then fixed with 4% formaldehyde. Triton-X was used to permeabilize the cells, and 5% BSA was used for blocking. The following primary antibodies were used: HIF-1α (NB100-134, Novus Biologicals), HIF-2α (NB100-132, Novus Biologicals), HA (CST #3724, Cell Signaling Technology) and HA (CST #2367, Cell Signaling Technology). Rabbit plus and mouse minus probes were used against the primary antibodies. PLA signal was obtained after scanning the slides using Zeiss 710 Meta microscope and ZEN-2010 software (Jena, Germany). Quantification of the graphic representation was performed using the Duolink image tool (Sigma-Aldrich).
Invasion assay
Collagen coated invasion assay kit was purchased from Cell Biolabs (CBA-110-COL, San Diego, CA, USA). The invasion assay was performed following the manufacturer’s instructions. Forty-eight hours after transfection, ACHN and A498 cells were starved for 12 hours. Cells were then trypsinized and seeded on to the upper invasion chamber in media containing 2% FBS. The invasion chamber was then placed in a 24-well plate containing media with 10% FBS. Cells were stimulated with TGF-β1 (10 ng/ml) and, untreated cells served as control. The cells were stained after 48 hours and after that photographed.
Statistical analysis
IBM SPSS Statistics 24.0 software was utilized to perform statistical analysis. The Mann-Whitney U-test was applied to show the difference in expression of two independent variables, bivariate correlations between two proteins were analyzed using Spearman’s correlation, and Kaplan-Meier curves showed cancer-specific survival of the patient, and the log-rank test was used to compare the survival times. For PLA, student’s T-test was used. For all the tests, a P value less than 0.05 was determined as significant.
Results
Protein expression of HIF-1α, HIF-2α, and SNAIL1 in ccRCC, and adjacent kidney cortex
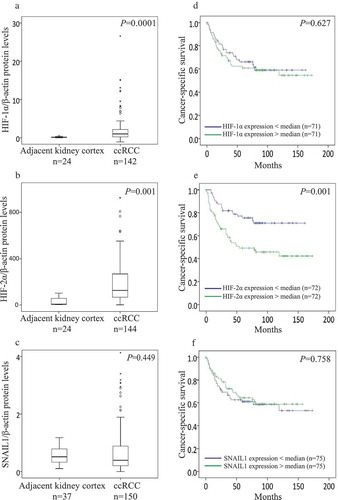
Protein expression of HIF-1α, HIF-2α, and SNAIL1 was determined by immunoblot (Supplementary Figure 1). Expression levels of HIF-1α (n = 142) and HIF-2α (n = 144) were significantly higher in ccRCC than kidney cortex (n = 24) (). The expression levels of SNAIL1 was not different between ccRCC (n = 150) and kidney cortex (n = 37) ()).
Figure 1. Box plot represents the expression of (a) HIF-1α, (b) HIF-2α, and (c) SNAIL1 protein in the kidney cortex compared with ccRCC tumors (Mann-Whitney U-test, significant at P< 0.05). Kaplan-Meier plots represents the cancer-specific survival curves of (d) HIF-1α, (E) HIF-2α, and (F) SNAIL1 protein levels in ccRCC (Kaplan-Meier survival analysis, significant at P < 0.05).
Protein expression of HIF-1α, HIF-2α, and SNAIL1 with respect to VHL status in ccRCC patients, and correlations among HIF-1α, HIF-2α and VHL protein levels in ccRCC
Based on the median value of the VHL expression, ccRCC samples (n = 143) were divided into two subgroups: ccRCC VHL-Low (n = 71) and ccRCC VHL-High (n = 72), as described previously [Citation13]. The expression of HIF-1α was significantly higher in ccRCC VHL-Low tumors (n = 68) when compared with ccRCC VHL-High tumors (n = 60) (P = 0.003). In contrast, HIF-2α expression was not different between ccRCC VHL-Low tumors (n = 68) and ccRCC VHL-High tumors (n = 62) (P = 0.203). SNAIL1 expression also showed no difference between ccRCC VHL-Low tumors (n = 67) and ccRCC VHL-High tumors (n = 67) (P = 0.079).
Expression of HIF-1α negatively correlated with VHL, but HIF-2α revealed no association with VHL (Supplementary Table 1).
Association of HIF-1α, HIF-2α, and SNAIL1 protein expression with clinicopathological parameters in ccRCC
The expression of HIF-1α did not associate with tumor grade and stage, but the expression was significantly higher in smaller tumors. HIF-2α expression was significantly higher in advanced stage, but no association was seen with grade or tumor size. The expression of SNAIL1 showed no association with any of the clinical parameters (). When ccRCC samples were divided based on the median values of HIF-1α, HIF-2α, and SNAIL1; higher expression of HIF-1α in the HIF-1α-above median group (n = 29) was associated with smaller tumors (P = 0.04); no other associations were seen.
Table 1. Relation of HIF-1α, HIF-2α, and SNAIL1 protein levels with categorized clinicopathological parameters in ccRCC.
We also noticed that HIF-1α expression was elevated in the early stages and decreased in advanced stages. On the contrary, HIF-2α expression was decreased in the early stages and elevated in advanced stages ().
Figure 2. (a) Immunoblots show protein expression of ALK5-full length (ALK5-FL), pSMAD2/3, SMAD2/3, PAI-1, SNAIL1, HIF-1α, HIF-2α, GLUT-1, CA9, and VHL after transfection of indicated vectors in ACHN cells followed by TGF-β stimulation for 6h (n = 3 independent experiments). All protein bands in each lane originated from the same cell lysate. β-actin served as internal loading control; (b) Immunoblots showing protein expression of ALK5-full length (ALK5-FL), pSMAD2/3, SMAD2/3, PAI-1, SNAIL1, HIF-1α, HIF-2α, GLUT-1, CA9, and VHL after transfection of indicated vectors in A498 cells followed by TGF-β treatment for 6h (n = 3 independent experiments). All protein bands in each lane originated from the same cell lysate. β-actin served as an internal loading control. (c) Immunoblots show protein expression of ALK5-full length (ALK5-FL), pSMAD2/3, SMAD2/3, PAI-1, SNAIL1, HIF-1α, HIF-2α, GLUT-1, CA9 and VHL after transfection of indicated vectors in ACHN cells followed by ALK5 specific Kinase Inhibitor (RepSox) treatment, 100 µM for 6h prior to TGF-β stimulation for 6h (n = 3 independent experiments). All protein bands in each lane originated from the same cell lysate. β-actin served as an internal loading control. (d) Immunoblots show protein expression of ALK5-full length (ALK5-FL), pSMAD2/3, SMAD2/3, PAI-1, SNAIL1, HIF-1α, HIF-2α, GLUT-1, CA9 and VHL after transfection of indicated vectors in A498 cells followed by ALK5 specific Kinase Inhibitor (RepSox) treatment, 100 µM for 6h prior to TGF-β stimulation for 6h (n = 3 independent experiments). All protein bands in each lane originated from the same cell lysate. β-actin served as an internal loading control.
Additionally, HIF-2α expression was significantly higher in metastasized ccRCC (n = 38) than in non-metastasized ccRCC (n = 106) (P = 0.018). Expression of HIF-1α (metastasized (n = 36), non-metastasized (n = 106), P = 0.702) and SNAIL1 (metastasized (n = 39), non-metastasized (n = 111), P = 0.832) showed no difference between metastasized and non-metastasized ccRCC.
Correlations between protein levels of HIF-1α, HIF-2α, and SNAIL1; and TGF-β signaling components ALK5-FL, ALK5-ICD, psmad2 and PAI-1 protein levels in ccRCC
HIF-1α expression was significantly associated with pSMAD2/3 but not with the expression of ALK5-FL, ALK5-ICD, PAI-1, or SNAIL1. HIF-2α expression significantly correlated with TGF-β signaling components; ALK5-ICD¸ pSMAD2/3, PAI-1, and SNAIL1; except for ALK5-FL having a non-significant positive association trend (P = 0.055). Expression of SNAIL1 significantly associated with TGF-β signaling components and PAI-1, SNAIL1 significantly correlated with HIF-2α but not with HIF-1α ().
Table 2. Correlations of HIF-1α and HIF-2α proteins, with ALK5-FL, ALK5-ICD, pSmad2/3, PAI-1 and SNAIL1.
Association of HIF-1α, HIF-2α, and SNAIL1 protein levels with cancer-specific survival (CSS) in ccRCC
For survival analysis, ccRCC patients were divided into two groups based on the median value of protein expression of HIF-1α, HIF-2α, and SNAIL1. Higher expression of HIF-2α associated with poor cancer-specific survival (CSS) for ccRCC patients. HIF-1α and SNAIL1 did not associate with CSS (). Further, we also divided ccRCC patients into four groups (quartiles) based on the expression of HIF-1α, HIF-2α, and SNAIL1 protein levels. Patients in the upper three quartiles of HIF-1α (P = 0.073) expression had a non-significant trend towards poor survival when compared with patients in the lowest quartile. Patients in the upper three quartiles of HIF-2α expression had significantly shorter CSS than the patients in the lowest quartile. SNAIL1 showed no association with survival (Supplementary Figure 3A, 3B, and 3C). Kidney renal clear cell carcinoma (KIRC) mRNA seq dataset (TCGA) divided at the median showed no association with CSS for HIF-1α, HIF-2α, and SNAIL1 (Supplementary Figure 4A, 4B, and 4C) [Citation45]. ALK5 was associated with poor overall survival in several different cancers (Supplementary Figure 5A-5K) [Citation46].
Under normoxic condition, ALK5 induces protein expression of HIF-1α, HIF-2α, HIF-α-targets GLUT-1 and CA9, and SNAIL1 in a VHL dependent manner
In ACHN (VHL+/+) cells, knockdown of VHL by siRNA, together with overexpression of ALK5-HA, followed by TGF-β treatment; showed a significant increase in the protein expression of HIF-1α, HIF-2α, GLUT-1, CA9 and SNAIL1 when compared with cells transfected with ALK5-HA and treated with TGF-β, or cells transfected with pcDNA control and siRNA control (). In A498 (VHL−/−) cells, overexpression of ALK5-HA followed by treatment with TGF-β induced higher expression of HIF-1α, HIF-2α, GLUT-1, CA9, and SNAIL1 proteins compared with cells transfected with pcDNA control. However, co-transfection of VHL and ALK5-HA vectors followed by treatment with TGF-β showed a reduction in the expression of these proteins compared with cells transfected with ALK5-HA followed by treatment with TGF-β (). Additionally, overexpression of ALK5-HA in ACHN and A498 cells induced differential expression of EMT markers E-cadherin and N-cadherin. The invasiveness of the cells also depended on the status of VHL (Supplementary Figure 6A and 6B). Collectively, these results showed that under normoxic conditions, both wild-type and introduced VHL reduced the ability of ALK5 to upregulate the expression of HIF-1α, HIF-2α, GLUT-1, CA9, and SNAIL1. Additionally, ALK5 promoted EMT and invasiveness of cells in a VHL dependent manner.
The kinase activity of ALK5 is essential for induction of HIF-1α, HIF-2α, GLUT-1, CA9, and SNAIL1
RepSox, a specific ALK5 kinase inhibitor, was utilized to investigate whether the ALK5 kinase activity mediated the increase in HIF-1α, HIF-2α, GLUT-1, CA9, and SNAIL1 protein expression. ACHN (VHL+/+) cells co-transfected with ALK5-HA and siVHL followed by TGF-β treatment, showed a significant increase in the protein expression of HIF-1α, HIF-2α, GLUT-1, CA9, and SNAIL1 when compared with control cells transfected with pcDNA and siRNA control. When ALK5-HA was co-transfected with siVHL and treated with kinase inhibitor RepSox for 6h before TGF-β stimulation, ACHN (VHL+/+) cells showed no activation of TGF-β-SMAD pathway, as expected, and the expressions of HIF-1α, HIF-2α, GLUT-1, CA9, and SNAIL1 protein was significantly reduced (). A498 (VHL−/-) cells transfected with ALK5-HA and treated with RepSox for 6h before TGF-β stimulation, showed no activation of TGF-β-SMAD pathway and the expression of HIF-1α, HIF-2α, GLUT-1, CA9, and SNAIL1 was significantly reduced when compared to cells transfected with ALK5-HA and treated with TGF-β. Taken together, these results indicated that ALK5-FL induced HIF-1α, HIF-2α, GLUT-1, CA9, and SNAIL1 proteins through its kinase activity ()).
Hypoxia induces the expression of HIF-1α, HIF-2α, GLUT1, CA9, and activates TGF-β pathway irrespective of VHL status
We mimicked hypoxic conditions in ACHN (VHL+/+) and A498 (VHL−/-) cells by treating them with CoCl2 at indicated time points. The protein expression of HIF-1α, HIF-2α, GLUT-1, and CA9 was increased in both cell lines. The expression of ALK5-FL and pSMAD2/3 was also increased in both cell lines. Collectively, these results show that hypoxia drives the expression of HIF-α, HIF-α-targets, and TGF-β pathways via ALK5-FL and pSMAD2/3 irrespective of presence or absence of VHL ().
Figure 3. (a) Immunoblots show protein expression of HIF-1α, HIF-2α, GLUT-1, CA9, ALK5-full length (ALK5-FL), pSMAD2/3, SMAD2/3, and VHL after treatment with CoCl2 (300 µM) at indicated time points in ACHN cells (n = 3 independent experiments). All protein bands in each lane originated from the same cell lysate. β-actin served as an internal loading control. (b) Immunoblots show protein expression of HIF-1α, HIF-2α, GLUT-1, CA9, ALK5-full length (ALK5-FL), pSMAD2/3, and SMAD2/3, and VHL after treatment with CoCl2 (300 µM) at indicated time points in A498 cells (n = 3 independent experiments). All protein bands in each lane originated from the same cell lysate. β-actin served as an internal loading control.
ALK5 protein associates with HIF-1α and HIF-2α proteins in normoxia
Since we observed that overexpression of ALK5 induces HIF-1α and HIF-2α protein expression in normoxia, we next explored the possibility of a physical functional interaction between ALK5 and HIF-1α, and ALK5 with HIF-2α proteins.
ACHN (VHL+/+) cells were transfected with ALK5-HA followed by TGF-β treatment or cells were co-transfected with ALK5-HA and siVHL followed by TGF-β treatment. Immunoprecipitation with HA or HIF-1α or HIF-2α or ALK5 antibodies was performed, and the results showed that ALK5 co-immunoprecipitated with HIF-1α and HIF-2α in ACHN cells (), total cell lysates are shown in Supplementary Figure 7A.
Figure 4. Immunoprecipitation and Proximity Ligation Assay shows interaction of ALK5 with HIF-1α and HIF-2α. (a) Immunoblots show IP with HA or HIF-1α or HIF-2α or ALK5 antibody: ACHN cells were transfected with ALK5-HA or co-transfected with ALK5-HA and siVHL vectors, followed by TGF-β treatment for 6h, and probed with HA or HIF-1α, or HIF-2α or ALK5 antibody, respectively. (b) Proximity Ligation Assay (PLA): ACHN cells were transiently co-transfected with indicated vectors, followed by TGF-β treatment for 6h. After fixation and blocking, PLA was performed using HA and HIF-1α or HIF-2α antibodies. HIF-1α-ALK5-HA complexes or HIF-2α-ALK5-HA complexes were visualized as red signals. Scale bar 50 μm (PLA performed without adding one of the primary antibodies served as the control, student’s T-test, significant at *P < 0.05, **P < 0.005, mean ± SD of three experiments, 500 cells were analyzed in each group). (c) Immunoblots show IP with HA or HIF-1α or HIF-2α or ALK5 antibody. A498 cells were transfected with ALK5-HA, or co-transfected with ALK5-HA and VHL vectors, followed by TGF-β treatment for 6h, and probed with HA or HIF-1α, or HIF-2α or ALK5 antibody, respectively. (d) Proximity Ligation Assay (PLA): A498 cells were transiently co-transfected with indicated vectors, followed by TGF-β treatment for 6h. After fixation and blocking, PLA was performed using HA and HIF-1α or HIF-2α antibodies. HIF-1α-ALK5-HA complexes or HIF-2α-ALK5-HA complexes were visualized as red signals. Scale bar 50 μm (PLA performed without adding one of the primary antibodies served as the control, student’s T-test, significant at *P < 0.05, **P < 0.005, mean ± SD of three experiments, 500 cells were analyzed in each group).
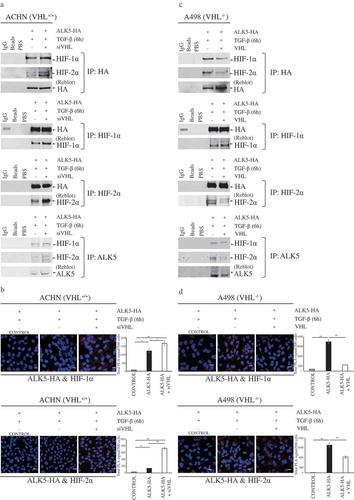
To complement the data achieved from co-immunoprecipitation, in situ PLA was performed in ACHN cells (VHL+/+) after transfecting cells with ALK5-HA or ALK5-HA after siVHL, followed by TGF-β treatment. PLA signals indicated interactions between HIF-1α and HA, and HIF-2α and HA. Cells co-transfected with ALK5-HA and siVHL showed significantly higher PLA signals compared with cells transfected with ALK5-HA and treated with TGF-β (). Using Duolink image tool software, we analyzed the PLA signals indicating interactions of HA (ALK5) with HIF-1α/2α in nucleus and cytoplasm. Significantly higher PLA signals were seen in cytoplasm and nucleus of cells co-transfected with ALK5-HA and siVHL (Supplementary Figure 7B and 7C).
A498 (VHL−/-) cells were transfected with ALK5-HA or co-transfected with ALK5-HA and VHL, followed by TGF-β treatment. Immunoprecipitation with HA or HIF-1α or HIF-2α or ALK5 antibodies was performed, and the results showed that ALK5 interacts with HIF-1α and HIF-2α in A498 cells () total cell lysates are shown in Supplementary Figure 7D. PLA performed on A498 (VHL−/-) cells transfected with ALK5-HA and treated with TGF-β showed significantly higher signals indicating an interaction between HIF-1α and HA, and HIF-2α and HA, when compared with cells co-transfected with ALK5-HA and VHL, followed by treatment with TGF-β. The duolink analysis revealed PLA signals in the cytoplasm and also in the nucleus (, Supplementary Figure 7E, and 7F).
In summary, these results show that under normoxic conditions; ALK5 has the capability to promote the expression of HIF-1α and HIF-2α. Additionally, HIF-1α and HIF-2α also interact with ALK5 in the nucleus. Interestingly, interactions are more pronounced in the absence of VHL in RCC cell lines ().
Figure 5. Schematic illustration of synergistic crosstalk between hypoxia and TGF-β signaling pathway. VHL inhibits expression of ALK5 protein by targeting it for proteasomal degradation [Citation13], and expression of HIF-1α/2α under normoxic conditions. Hypoxic conditions increase the expression of HIF-1α/HIF-2α and ALK5. ALK5, through its kinase activity, increases the expression of HIF-1α/HIF-2α under normoxic conditions. Physical interaction between ALK5 and HIF-1α/HIF-2α produces a synergistic effect to promote tumor progression and leads to poor prognosis for patients with ccRCC.
![Figure 5. Schematic illustration of synergistic crosstalk between hypoxia and TGF-β signaling pathway. VHL inhibits expression of ALK5 protein by targeting it for proteasomal degradation [Citation13], and expression of HIF-1α/2α under normoxic conditions. Hypoxic conditions increase the expression of HIF-1α/HIF-2α and ALK5. ALK5, through its kinase activity, increases the expression of HIF-1α/HIF-2α under normoxic conditions. Physical interaction between ALK5 and HIF-1α/HIF-2α produces a synergistic effect to promote tumor progression and leads to poor prognosis for patients with ccRCC.](/cms/asset/aea75a2b-7b36-4ea0-a488-1a35c7c6577c/kccy_a_1642069_f0005_oc.jpg)
Discussion
Signaling pathways play crucial roles in various cellular activities, including cancer progression. Cancer cells receive multiple extracellular stimuli. Crosstalk between signaling pathways enables the cell to process and interpret multiple signals differently depending on various contexts. Two different stimuli such as hypoxia and TGF-β in the same cell can result in an improved or a synergistic effect where each pathway supports the other. Determining the principle behind such interactions between signaling pathways are crucial to understand signaling activities in cancer cells and thereby discover druggable targets [Citation58]. In this study, we have aimed to get a better understanding of synergistic crosstalk between hypoxia-inducible factors and transforming growth factor-β signaling pathway. We have emphasized on interactions of ALK5 with HIF-1α and HIF-2α.
We previously demonstrated that ALK5-FL, ALK5-ICD, pSMAD2/3, and PAI-1 contributes to the aggressiveness of ccRCC, and concluded that both canonical and non-canonical components of the TGF-β signaling pathway are involved in tumor progression [Citation24]. In another study, we recently showed that VHL ubiquitinates ALK5 and subjects it to proteasomal degradation in a K48 dependent manner [Citation13]. In this study, we analyzed the protein expression of HIF-1α, HIF-2α, and SNAIL1 in ccRCC. We also investigate the correlations of these proteins with clinicopathological parameters and cancer-specific survival. Moreover, we have further evaluated the association of these proteins with components of the TGF-β signaling pathway.
Numerous studies and meta-analysis have investigated the effects of HIF-1α and HIF-2α on tumor progression and patient survival in various cancers; these studies have yielded varying results.
We found in this study that the expression of HIF-1α and HIF-2α was higher in ccRCC than in corresponding kidney cortex. This finding is in line with previous reports [Citation59–Citation61]. We then performed survival analysis and found that HIF-1α did not associate with survival, however when we divided patients based on HIF-1α expression into 4 groups; patients in the upper three quartiles had a non-significant trend towards poor survival. In contrast, higher expression of HIF-2α was associated with poor cancer-specific survival ().
A study revealed that HIF-1α was associated with poor cancer-specific survival [Citation59], while another study concluded that HIF-1α was favorable for patient survival [Citation60]. Similarly, a study concluded that HIF-2α expression corresponded with better patient survival [Citation62], while a meta-analysis and a recent independent study revealed that HIF-2α is an indicator of poor prognosis, these latter reports are in line with our study [Citation63,Citation64]; yet another study demonstrated that increased cytoplasmic expression of HIF-2α and increased nuclear expression of HIF-1α indicate unfavorable prognosis for RCC patients [Citation65]. Nonetheless, there are strategies to target both HIF-1α and HIF-2α for cancer therapy [Citation66,Citation67].
In our study, HIF-1α expression was enhanced in ccRCCs expressing low levels of VHL, and also there was a significant negative correlation between HIF-1α and VHL. However, HIF-2α revealed no such interactions. These findings could be explained in accordance with a previous study where they demonstrated that hypoxia-associated factor (HAF) binds and ubiquitinates HIF-1α through an oxygen and VHL dependant mechanism and targets it to proteasomal degradation. Although HAF binds to HIF-2α, it binds at a different site and increases HIF-2α transactivation without causing its degradation. This switch from HIF-1α to HIF-2α dependant gene expression mediated by HAF leads to a more aggressive tumor under prolonged hypoxia [Citation68].
We also found that HIF-1α associated with early stage and smaller tumors; whereas HIF-2α associated with advanced tumor stage. Supporting this observation, a previous study has shown that HIF-1α protein disappeared under prolonged hypoxia due to the reduction of its mRNA stability, whereas HIF-2α protein remained high and stable [Citation69].
SNAIL1 protein was not differentially expressed in ccRCC and adjacent kidney cortex, and no correlations were seen between SNAIL1 expression and clinicopathological parameters or patient survival. A previous study showed that SNAIL1 was highly expressed in ccRCC [Citation70], a possible reason for this discrepancy could be SNAIL1 heterogeneity in ccRCC [Citation71]. That study also showed that SNAIL1 associated with higher grade, and advanced stage [Citation70]. Another study with a larger cohort showed that cytoplasmic and nuclear SNAIL1 was not associated with tumor stage and tumor size [Citation72], results are in line with our findings. Additionally, that study also revealed that high cytoplasmic expression of SNAIL1 associated with higher grade, and high nuclear expression of SNAIL1 was associated with poor patient survival [Citation72]. Possible reasons for these differences could be the variation in methodology and the number of samples used.
To investigate the association between proteins of hypoxia and TGF-β signaling pathways in ccRCC, we performed a bivariate correlation analysis. HIF-1α correlated with pSMAD2/3 (), and it has been reported that HIF-1α contributes to hypoxia-induced upregulation of TGF-β and activation of TGF-β/SMAD3 pathway [Citation36,Citation73]. HIF-1α did not correlate with any other components of TGF-β signaling or SNAIL1 (). HIF-1α could be upregulated in the early stages of hypoxia and activated TGF-β-SMAD pathway but gets attenuated in the course of tumor progression and under prolonged hypoxia [Citation69]. As previously discussed, we observed in our study that HIF-1α was activated in the early stages of the tumor. HIF-2α significantly correlated with pSMAD2/3 and PAI-1 (); PAI-1 is a common target of TGF-β signaling [Citation20] and HIF-2α [Citation74]. We also observed a close to the significant trend between HIF-2α and ALK5-FL. This study also revealed a positive association between HIF-2α and ALK5-ICD (), a component of non-canonical TGF-β signaling, which to the best of our knowledge has not been reported before. SNAIL1 was associated with all components of TGF-β and HIF-2α (); SNAIL1 is known to be induced by both TGF-β and hypoxia [Citation28,Citation29].
Though studies have reported interactions between TGF-β and hypoxia pathway, the exact mechanism has still not been understood. In our study, we aimed to identify a link between these two pathways. A previous study reported that hypoxia increased the expression of ALK5 mRNA in Lewis lung carcinoma cells [Citation35]. We recently showed that ALK5 overexpression in RCC cell lines leads to enhanced activation of TGF-β signaling, and ALK5-ICD is correlated with poor prognosis and localized in the nucleus, independent of VHL status and plays a major role in tumor progression. Additionally, similar to HIF-1α and HIF-2α, VHL ubiquitinates ALK5, and subjects it to proteasomal degradation [Citation13,Citation21,Citation24].
Based on these observations, we speculated that ALK5 plays a major role in functional crosstalk between TGF-β signaling pathway and hypoxia, and hence we overexpressed ALK5 in both ACHN (VHL+/+) and A498 (VHL−/-) cell lines to investigate its effect on downstream targets and components of hypoxia pathway. We observed that ALK5 activated the TGF-β pathway and increased the expression of PAI-1 and SNAIL1; ALK5 also increased the expression of HIF-1α and HIF-2α in a VHL dependent manner ().
From the data achieved in this study, we found that ALK5 induced enhancement of HIF-1α and HIF-2α, leading to significantly increased expression of HIF-α targets GLUT-1 and CA9 (). Out of various targets of the HIF-α pathway, we chose to investigate the levels of GLUT-1 and CA9 as they are considered to be intrinsic markers of hypoxia [Citation8]. CA9 is expressed exclusively in ccRCC but not in normal kidney, and it is a diagnostic and prognostic marker in ccRCC [Citation9]. GLUT-1 is overexpressed in various cancers and plays a pivotal role in glucose transport in malignant cells [Citation75]. We also observed that the kinase activity of ALK5 was necessary for ALK5 induced expression of HIF-α and its target genes in both cell lines (). Apart from activating hypoxia and its’s targets, ALK5 overexpression also imparted an enhanced invasive ability to both cell lines and reduced the expression of E-cadherin (Supplementary Figure 6). We observed that expression of ALK5 increased under hypoxic conditions along with HIF-1α and HIF-2α (). Co-immunoprecipitation studies confirmed ALK5 interacts with both HIF-1α and HIF-2α (). Moreover, data achieved from PLA not only complemented findings from co-immunoprecipitation but also showed co-localisation of associated protein complexes in both cytoplasm and nucleus ( and Supplementary Figure 7).
Hypoxia and TGF-β independently of each other contribute to tumor progression, and a potential crosstalk between these two pathways needs a common protein to transfer and modulate this crosstalk. This study shows that ALK5 acts as an upstream driver of HIF-1α and HIF-2α even under normoxic conditions; to promote the expression of target genes involved in tumor progression and EMT in ccRCC. Interaction of ALK5 with HIF-1α and HIF-2α seems to play an important role in synergistic crosstalk between TGF-β and hypoxia pathways (). Notably, the tumor-promoting effects exerted by ALK5-ICD are independent of VHL status in ccRCC. Finally, our study presents ALK5 as a potential target for treatment in patients with ccRCC.
Supplemental Material
Download MS Word (16.3 KB)Supplemental Material
Download MS Power Point (32.6 KB)Supplemental Material
Download PDF (3 MB)Acknowledgments
We thank Ms. Britt-Inger Dahlin, Ms. Kerstin Almroth, the staff in Urology and Andrology at Umeå University Hospital for skillful technical assistance, and the participating patients for their cooperation.
Disclosure statement
No potential conflict of interest was reported by the authors.
Supplementary material
Supplemental data for this article can be accessed here.
Additional information
Funding
Related Research Data
References
- Ferlay J, Colombet M, Soerjomataram I, et al. Cancer incidence and mortality patterns in Europe: estimates for 40 countries and 25 major cancers in 2018. Eur J Cancer. 2018;103:356–387.
- Kovacs G. Molecular genetics of human renal cell tumours. Nephrol Dial Transplant. 1996;11(Suppl 6):62–65.
- Nelson EC, Evans CP, Lara PN Jr. Renal cell carcinoma: current status and emerging therapies. Cancer Treat Rev. 2007;33(3):299–313.
- Kim WY, Kaelin WG. Role of VHL gene mutation in human cancer. J Clin Oncol. 2004;22(24):4991–5004.
- Iwai K, Yamanaka K, Kamura T, et al. Identification of the von Hippel-lindau tumor-suppressor protein as part of an active E3 ubiquitin ligase complex. Proc Natl Acad Sci U S A. 1999;96(22):12436–12441.
- Maxwell PH, Wiesener MS, Chang G-W, et al. The tumour suppressor protein VHL targets hypoxia-inducible factors for oxygen-dependent proteolysis. Nature. 1999;399(6733):271–275.
- Dengler VL, Galbraith M, Espinosa JM. Transcriptional regulation by hypoxia inducible factors. Crit Rev Biochem Mol Biol. 2014;49(1):1–15.
- Hoskin PJ, Sibtain A, Daley FM, et al. GLUT1 and CAIX as intrinsic markers of hypoxia in bladder cancer: relationship with vascularity and proliferation as predictors of outcome of ARCON. Br J Cancer. 2003;89(7):1290–1297.
- Tostain J, Li G, Gentil-Perret A, et al. Carbonic anhydrase 9 in clear cell renal cell carcinoma: a marker for diagnosis, prognosis and treatment. Eur J Cancer. 2010;46(18):3141–3148.
- Ambrosetti D, Dufies M, Dadone B, et al. The two glycolytic markers GLUT1 and MCT1 correlate with tumor grade and survival in clear-cell renal cell carcinoma. PLoS One. 2018;13(2):e0193477.
- Ananth S, Knebelmann B, Grüning W, et al. Transforming growth factor beta1 is a target for the von Hippel-Lindau tumor suppressor and a critical growth factor for clear cell renal carcinoma. Cancer Res. 1999;59(9):2210–2216.
- Bostrom AK, Lindgren D, Johansson ME, et al. Effects of TGF-beta signaling in clear cell renal cell carcinoma cells. Biochem Biophys Res Commun. 2013;435(1):126–133.
- Mallikarjuna P, Sitaram RT, Landström M, et al. VHL status regulates transforming growth factor-β signaling pathways in renal cell carcinoma. Oncotarget. 2018;9(23):16297–16310.
- Massague J. TGF-beta signal transduction. Annu Rev Biochem. 1998;67:753–791.
- David CJ, Massague J. Contextual determinants of TGFbeta action in development, immunity and cancer. Nat Rev Mol Cell Biol. 2018;19(7):419–435.
- Massague J. TGFbeta in Cancer. Cell. 2008;134(2):215–230.
- Massague J. TGFbeta signalling in context. Nat Rev Mol Cell Biol. 2012;13(10):616–630.
- Mu Y, Gudey SK, Landstrom M. Non-Smad signaling pathways. Cell Tissue Res. 2012;347(1):11–20.
- Derynck R, Budi EH. Specificity, versatility, and control of TGF-beta family signaling. Sci Signal. 2019 Feb 26;12(570). pii: eaav5183. doi:10.1126/scisignal.aav5183.
- Dong C, Zhu S, Wang T, et al. Upregulation of PAI-1 is mediated through TGF-beta/Smad pathway in transplant arteriopathy. J Heart Lung Transplant. 2002;21(9):999–1008.
- Mu Y, Sundar R, Thakur N, et al. TRAF6 ubiquitinates TGFβ type I receptor to promote its cleavage and nuclear translocation in cancer. Nat Commun. 2011;2:330.
- Gudey SK, Sundar R, Mu Y, et al. TRAF6 stimulates the tumor-promoting effects of TGFbeta type I receptor through polyubiquitination and activation of presenilin 1. Sci Signal. 2014;7(307):ra2.
- Song J, Mu Y, Li C, et al. APPL proteins promote TGFbeta-induced nuclear transport of the TGFbeta type I receptor intracellular domain. Oncotarget. 2016;7(1):279–292.
- Sitaram RT, Mallikarjuna P, Landström M, et al. Transforming growth factor-beta promotes aggressiveness and invasion of clear cell renal cell carcinoma. Oncotarget. 2016;7(24):35917–35931.
- Peinado H, Quintanilla M, Cano A. Transforming growth factor beta-1 induces snail transcription factor in epithelial cell lines: mechanisms for epithelial mesenchymal transitions. J Biol Chem. 2003;278(23):21113–21123.
- Vincent T, Neve EPA, Johnson JR, et al. A SNAIL1-SMAD3/4 transcriptional repressor complex promotes TGF-beta mediated epithelial-mesenchymal transition. Nat Cell Biol. 2009;11(8):943–950.
- Thakur N, Gudey SK, Marcusson A, et al. TGFbeta-induced invasion of prostate cancer cells is promoted by c-Jun-dependent transcriptional activation of Snail1. Cell Cycle. 2014;13(15):2400–2414.
- Gudey SK, Sundar R, Heldin C-H, et al. Pro-invasive properties of Snail1 are regulated by sumoylation in response to TGFbeta stimulation in cancer. Oncotarget. 2017;8(58):97703–97726.
- Lundgren K, Nordenskjold B, Landberg G. Hypoxia, Snail and incomplete epithelial-mesenchymal transition in breast cancer. Br J Cancer. 2009;101(10):1769–1781.
- Choi BJ, Park S-A, Lee S-Y, et al. Hypoxia induces epithelial-mesenchymal transition in colorectal cancer cells through ubiquitin-specific protease 47-mediated stabilization of Snail: A potential role of Sox9. Sci Rep. 2017;7(1):15918.
- Xu X, Tan X, Tampe B, et al. Snail is a direct target of hypoxia-inducible factor 1alpha (HIF1alpha) in Hypoxia-induced endothelial to mesenchymal transition of human coronary endothelial cells. J Biol Chem. 2015;290(27):16653–16664.
- Yoshino J, Monkawa T, Tsuji M, et al. Snail1 is involved in the renal epithelial-mesenchymal transition. Biochem Biophys Res Commun. 2007;362(1):63–68.
- Lamouille S, Xu J, Derynck R. Molecular mechanisms of epithelial-mesenchymal transition. Nat Rev Mol Cell Biol. 2014;15(3):178–196.
- Guaita S, Puig I, Francı́ C, et al. Snail induction of epithelial to mesenchymal transition in tumor cells is accompanied by MUC1 repression and ZEB1 expression. J Biol Chem. 2002;277(42):39209–39216.
- Furuta C, Miyamoto T, Takagi T, et al. Transforming growth factor-beta signaling enhancement by long-term exposure to hypoxia in a tumor microenvironment composed of Lewis lung carcinoma cells. Cancer Sci. 2015;106(11):1524–1533.
- Zhang H, Akman HO, Smith ELP, et al. Cellular response to hypoxia involves signaling via Smad proteins. Blood. 2003;101(6):2253–2260.
- McMahon S, Charbonneau M, Grandmont S, et al. Transforming growth factor beta1 induces hypoxia-inducible factor-1 stabilization through selective inhibition of PHD2 expression. J Biol Chem. 2006;281(34):24171–24181.
- Matsuoka J, Yashiro M, Doi Y, et al. Hypoxia stimulates the EMT of gastric cancer cells through autocrine TGFbeta signaling. PLoS One. 2013;8(5):e62310.
- Dunn LK, Mohammad KS, Fournier PGJ, et al. Hypoxia and TGF-beta drive breast cancer bone metastases through parallel signaling pathways in tumor cells and the bone microenvironment. PLoS One. 2009;4(9):e6896.
- Copple BL. Hypoxia stimulates hepatocyte epithelial to mesenchymal transition by hypoxia-inducible factor and transforming growth factor-beta-dependent mechanisms. Liver Int. 2010;30(5):669–682.
- Svenson U, Ljungberg B, Roos G. Telomere length in peripheral blood predicts survival in clear cell renal cell carcinoma. Cancer Res. 2009;69(7):2896–2901.
- Kovacs G, Akhtar M, Beckwith BJ, et al. The Heidelberg classification of renal cell tumours. J Pathol. 1997;183(2):131–133.
- Motzer RJ, Agarwal N, Beard C, et al. NCCN clinical practice guidelines in oncology: kidney cancer. J Natl Compr Canc Netw. 2009;7(6):618–630.
- Fuhrman SA, Lasky LC, Limas C. Prognostic significance of morphologic parameters in renal cell carcinoma. Am J Surg Pathol. 1982;6(7):655–663.
- Nagy A, Lánczky A, Menyhárt O, et al. Validation of miRNA prognostic power in hepatocellular carcinoma using expression data of independent datasets. Sci Rep. 2018;8(1):9227.
- Anaya J. OncoLnc: linking TCGA survival data to mRNAs, miRNAs, and lncRNAs. Peer J Comput Sci. 2016;2(e67).
- Shinojima T, Oya M, Takayanagi A, et al. Renal cancer cells lacking hypoxia inducible factor (HIF)-1alpha expression maintain vascular endothelial growth factor expression through HIF-2alpha. Carcinogenesis. 2007;28(3):529–536.
- Kucejova B, Peña-Llopis S, Yamasaki T, et al. Interplay between pVHL and mTORC1 pathways in clear-cell renal cell carcinoma. Mol Cancer Res. 2011;9(9):1255–1265.
- Lai XM, Liu S-Y, Tsai Y-T, et al. HAF mediates the evasive resistance of anti-angiogenesis TKI through disrupting HIF-1α and HIF-2α balance in renal cell carcinoma. Oncotarget. 2017;8(30):49713–49724.
- Hakimi AA, Chevinsky M, Hsieh JJ, et al. MP23-11 GENOMIC COMPARISON OF RENAL CELL CARCINOMA CELL LINES TO HUMAN TUMORS. J Urol. 2014;191(4S):e247.
- Schmidt L, Junker K, Nakaigawa N, et al. Novel mutations of the MET proto-oncogene in papillary renal carcinomas. Oncogene. 1999;18(14):2343–2350.
- Kovacs G, Fuzesi L, Emanual A, et al. Cytogenetics of papillary renal cell tumors. Genes Chromosomes Cancer. 1991;3(4):249–255.
- Korhonen M, Sariola H, Gould VE, et al. Integrins and laminins in human renal carcinoma cells and tumors grown in nude mice. Cancer Res. 1994;54(16):4532–4538.
- Furge KA, Dykema K, Petillo D, et al. Combining differential expression, chromosomal and pathway analyses for the molecular characterization of renal cell carcinoma. Can Urol Assoc J. 2007;1(2 Suppl):S21–7.
- Robb VA, Karbowniczek M, Klein-Szanto AJ, et al. Activation of the mTOR signaling pathway in renal clear cell carcinoma. J Urol. 2007;177(1):346–352.
- Campbell L, Al-Jayyoussi G, Gutteridge R, et al. Caveolin-1 in renal cell carcinoma promotes tumour cell invasion, and in co-operation with pERK predicts metastases in patients with clinically confined disease. J Transl Med. 2013;11:255.
- Lovell M, Lott ST, Wong P, et al. The genetic locus NRC-1 within chromosome 3p12 mediates tumor suppression in renal cell carcinoma independently of histological type, tumor microenvironment, and VHL mutation. Cancer Res. 1999;59(9):2182–2189.
- Siso-Nadal F, Fox JJ, Laporte SA, et al. Cross-talk between signaling pathways can generate robust oscillations in calcium and cAMP. PLoS One. 2009;4(10):e7189.
- Klatte T, Seligson DB, Riggs SB, et al. Hypoxia-inducible factor 1 alpha in clear cell renal cell carcinoma. Clin Cancer Res. 2007;13(24):7388–7393.
- Lidgren A, Hedberg Y, Grankvist K, et al. The expression of hypoxia-inducible factor 1alpha is a favorable independent prognostic factor in renal cell carcinoma. Clin Cancer Res. 2005;11(3):1129–1135.
- Timar J, Szasz AM, Kardos M, et al. Expression of HIF1a and HIF2a in bone metastatic clear cell renal cell cancer and use as prognostic markers. J Clin Oncol. 2013;31(15_suppl):e15523–e15523.
- Szendroi A, Szász AM, Kardos M, et al. Opposite prognostic roles of HIF1alpha and HIF2alpha expressions in bone metastatic clear cell renal cell cancer. Oncotarget. 2016;7(27):42086–42098.
- Luo D, Liu H, Lin D, et al. The clinicopathologic and prognostic value of hypoxia-inducible factor-2alpha in cancer patients: a systematic review and meta-analysis. Cancer Epidemiol Biomarkers Prev. 2019;28(5):857–866.
- Xiong Y, Liu L, Xia Y, et al. Tumor infiltrating mast cells determine oncogenic HIF-2alpha-conferred immune evasion in clear cell renal cell carcinoma. Cancer Immunol Immunother. 2019;68(5):731–741.
- Fan Y, Sashittal SG, Chatzizacharias NA, et al. Prognostic significance of hypoxia-inducible factor expression in renal cell carcinoma: a PRISMA-compliant systematic review and meta-analysis. Medicine (Baltimore). 2015;94(38):e1646.
- Hu Y, Liu J, Huang H. Recent agents targeting HIF-1alpha for cancer therapy. J Cell Biochem. 2013;114(3):498–509.
- Martinez-Saez O, Borau PG, Alonso-Gordoa T, et al. Targeting HIF-2 alpha in clear cell renal cell carcinoma: A promising therapeutic strategy. Crit Rev Oncol Hematol. 2017;111:117–123.
- Koh MY, Lemos R, Liu X, et al. The hypoxia-associated factor switches cells from HIF-1alpha- to HIF-2alpha-dependent signaling promoting stem cell characteristics, aggressive tumor growth and invasion. Cancer Res. 2011;71(11):4015–4027.
- Uchida T, Rossignol F, Matthay MA, et al. Prolonged hypoxia differentially regulates hypoxia-inducible factor (HIF)-1alpha and HIF-2alpha expression in lung epithelial cells: implication of natural antisense HIF-1alpha. J Biol Chem. 2004;279(15):14871–14878.
- Cai J. Roles of transcriptional factor Snail and adhesion factor E-cadherin in clear cell renal cell carcinoma. Exp Ther Med. 2013;6(6):1489–1493.
- Zaldumbide L, Erramuzpe A, Guarch R, et al. Snail heterogeneity in clear cell renal cell carcinoma. BMC Cancer. 2016;16:194.
- Liu W, Liu Y, Liu H, et al. Snail predicts recurrence and survival of patients with localized clear cell renal cell carcinoma after surgical resection. Urol Oncol. 2015;33(2):69 e1–10.
- Kushida N, Nomura S, Mimura I, et al. Hypoxia-inducible factor-1alpha activates the transforming growth factor-beta/SMAD3 pathway in kidney tubular epithelial cells. Am J Nephrol. 2016;44(4):276–285.
- Wallace EM, Rizzi JP, Han G, et al. A small-molecule antagonist of HIF2alpha is efficacious in preclinical models of renal cell carcinoma. Cancer Res. 2016;76(18):5491–5500.
- Feng W, Cui G, Tang C-W, et al. Role of glucose metabolism related gene GLUT1 in the occurrence and prognosis of colorectal cancer. Oncotarget. 2017;8(34):56850–56857.