
ABSTRACT
The BCR-ABL1 fusion gene is the driver oncogene in chronic myeloid leukemia (CML) and Philadelphia-chromosome positive (Ph+) acute lymphoblastic leukemia (ALL). The introduction of tyrosine kinase inhibitors (TKIs) targeting the ABL kinase (such as imatinib) has dramatically improved survival of CML and Ph+ ALL patients. However, primary and acquired resistance to TKIs remains a clinical challenge. Ph+ leukemia patients who achieve a complete cytogenetic (CCR) or deep molecular response (MR) (≥4.5log reduction in BCR-ABL1 transcripts) represent long-term survivors. Thus, the fast and early eradication of leukemic cells predicts MR and is the prime clinical goal for these patients. We show here that the first-in-class inhibitor of the Nedd8-activating enzyme (NAE1) MLN4924 effectively induced caspase-dependent apoptosis in Ph+ leukemia cells, and sensitized leukemic cells for ABL tyrosine kinase inhibitors (TKI) and hydroxyurea (HU). We demonstrate that MLN4924 induced DNA damage in Ph+ leukemia cells by provoking the activation of an intra S-phase checkpoint, which was enhanced by imatinib co-treatment. The combination of MLN4924 and imatinib furthermore triggered a dramatic shift in the expression of MCL1 and NOXA. Our data offers a clear rationale to explore the clinical activity of MLN4924 (alone and in combination with ABL TKI) in Ph+ leukemia patients
KEYWORDS:
Introduction
The Philadelphia (Ph) chromosome t(9;22)(q34;q11) translocation is the hallmark genetic aberration in chronic myeloid leukemia (CML) and is the most common cytogenetic aberration in adult lymphoblastic leukemia (ALL) (20–30%) [Citation1]. However, in childhood leukemias, it is an uncommon event (2–5%) [Citation2]. The t(9;22) translocation fuses the ABL1 gene with the BCR gene leading to a constitutively active tyrosine kinase with the capacity to transform hematopoietic cells [Citation3,Citation4]. There is compelling evidence that this tyrosine kinase activity contributes to leukemogenesis by activation of cytokine signaling and cytokine-independent growth [Citation5]. Historically, the Ph+ acute leukemias represent a group of patients with poor prognosis [Citation6,Citation7]. However, the development of imatinib mesylate (STI571/Gleevec™) [Citation8], which is a specific inhibitor of ABL, c-kit and platelet-derived growth factor receptor (PDGFR) tyrosine kinases, improved treatment outcome in Ph+ acute leukemias. Imatinib monotherapy had modest activity [Citation9,Citation10], but incorporation of imatinib into combination chemotherapy regimens dramatically improved relapse-free and overall survival [Citation11,Citation12]. Despite these advances, a sizeable fraction of patients exhibit primary or acquired imatinib resistance due to BCR-ABL1 upregulation or point mutations that impair drug binding, such as the “gatekeeper” ABL T315I mutation [Citation13–Citation15]. In addition, patients may develop tyrosine kinase inhibitor (TKI) resistance despite effective inhibition of BCR-ABL1 kinase activity, and several intrinsic and extrinsic mechanisms for this BCR-ABL1 kinase-independent resistance have been described [Citation16–Citation19]. It has been reported that human leukemia-initiating cells (LIC) are independent of BCR-ABL1 kinase activity for their survival and therefore, do not respond to imatinib which is considered to contribute to TKI resistance [Citation20].
To overcome imatinib resistance, second-generation TKIs (dasatinib, nilotinib and bosutinib), have been developed, but despite their clinical efficacy, were not able to overcome ABL-T315I-induced resistance [Citation21]. Currently, only the third-generation TKI ponatinib is effective against T315I-mutated Ph+ leukemias [Citation22,Citation23]. CML patients who achieve an early and deep molecular response (MR) upon treatment (>4.5 log reduction in BCR-ABL1-transcripts) have an excellent prognosis and may stay in remission even after discontinuation of treatment [Citation24]. Given the clinical efficacy of imatinib for Ph+ leukemias, it is evident that novel drugs that synergize with imatinib hold great promise by contributing to early MR, and importantly, by diminishing the risk of imatinib resistance. In addition, it is crucial to develop drugs that can eradicate LICs for complete eradication of leukemic cells.
The ubiquitin-proteasome system (UPS) is responsible for the degradation of intracellular proteins and plays a pivotal role in many cellular processes. Targeting the UPS has proven to be a powerful anti-cancer strategy, e.g. the proteasome inhibitor bortezomib (Velcade™) is approved for the treatment of patients with multiple myeloma (MM) and mantle-cell lymphoma (MCL), and has shown its effectiveness in clinical trials [Citation25,Citation26]. Next to ubiquitination, other post-translational conjugation pathways that regulate protein degradation have been identified, such as Nedd8-conjugation [Citation27]. The ubiquitin-like protein Nedd8 is activated by the Nedd8-activating E1 enzyme (NAE1), transferred to the E2 enzymes UBE2M and UBE2F, and subsequently conjugated to its substrates. Cullin proteins represent the best characterized Nedd8-targets [Citation28]. Cullins are scaffold proteins for cullin-RING E3 ubiquitin ligases (CRL), placing neddylation upstream of cullin-dependent ubiquitination [Citation29]. CRLs target a multitude of different proteins for degradation, among which there are many that regulate the cell-cycle and the DNA damage checkpoints [Citation30]. A small molecule inhibitor of NAE1, MLN4924 (pevonedistat™) was demonstrated to have potent cytotoxic effects against cell lines derived from various tumors [Citation31]. There are several mechanisms that may mediate the cytotoxicity of MLN4924. In cancer cell lines of epithelial origin and in B-cell chronic lymphocytic leukemia (B-CLL), cell death was reported to be related to the accumulation of the replication licensing factor CDT1, resulting in DNA re-replication and the activation of the cell-cycle checkpoints [Citation31,Citation32]. In activated B-cell like (ABC) diffuse large B-cell lymphoma (DLBCL) MLN4924 was shown to be cytotoxic by inhibiting the NF-κB pathway [Citation33], whereas in MM, its antitumor effect was associated with suppression of AKT and mTOR signaling [Citation34]. In acute myeloid leukemia (AML), MLN4924 induced apoptosis by stabilizing C-MYC, which in turn transactivated NOXA expression [Citation35]. It has been demonstrated that MLN4924 induces apoptosis in ALL cells by inducing endoplasmic reticulum (ER) stress through activation of both mTOR and UPR/eIF2α pathways [Citation36]. Moreover, it has been shown that MLN4924 treatment promotes Ca2+ influx via the Ca2+-release-activated Ca2+ (CRAC) channel leading to activation of MEK/ERK pathway as a compensatory mechanism for the survival of ALL cells. Using a NOD/scid common gamma chain knockout mice (NSG) xenograft ALL mouse model, it has been shown that co-treatment of these mice with MLN4924 and MEK/ERK inhibitor selumetinib increased the survival and lowered disease burden [Citation37].
Phase I/II studies in selected hematological malignancies showed that MLN4924 was well tolerated and confirmed target specificity, and preliminary data from ongoing clinical trials for AML, MM and myelodysplastic syndrome (MDS) showed modest clinical activity [Citation38,Citation39]. Cytotoxicity towards several B-cell ALL (B-ALL) and T-cell ALL (T-ALL) cell lines has been described [Citation40]. Here, we show that MLN4924 potently induced apoptosis of Ph+ leukemias by provoking DNA damage and checkpoint activation, and sensitizes Ph+ leukemia cells for ABL TKIs.
Materials and methods
Cell lines, primary patient samples
The Ph+ cell lines BV173, K562, NALM-1, MOLM-6, and KCL22 are derived from CML patients in blast crisis (CML-BC), the SUPB15 and SD1 cell lines are derived from Ph+ B-ALL patients, the P30-OHKUBO cell line is from a Ph- B-ALL (obtained from the Deutsche Sammlung von Mikroorganismen und Zellkulturen; DSMZ, Braunschweig, Germany). The CML-BC cell line KBM5 and the imatinib-resistant KBM5-T315I subclone were kind gifts from Dr. Carter and Dr. Andreeff (MD Anderson Cancer Center, Houston, TX). The multiple myeloma (MM) cell lines NCI-H929, ANBL-6, XG-1 and UM-3 used in this study were described earlier [Citation41]. All cell lines were maintained in Iscove’s Modified Dulbecco’s Medium (IMDM) (Gibco Life Technologies, Bleiswijk, The Netherlands) supplemented with 2 mM L-glutamine, 100 U/mL penicillin, 100 μg/mL streptomycin and 10% fetal calf serum (FCS). For the MM cell lines ANBL-6, XG-1 and UM-3, medium was supplemented with 0.5 ng/mL recombinant human interleukin-6 (rh IL6) (Prospec, Ness-Ziona, Israel). The KBM5-T315I cell line was kept under continuous 1.0 μM imatinib pressure. The CD34+ fraction (purity >90%, MACS positive selection, Miltenyi Biotec, Bergisch Gladbach, Germany) of peripheral blood mononuclear cells from a previously untreated adult Ph+ B-ALL patient were cultured overnight in supplemented IMDM with 20% FCS, and 10 ng/mL rh IL7, 10 ng/mL rh Stem Cell Factor (SCF), 100 ng/mL rh IL3 and 1 ng/mL rh IL6 (ProSpec, Ness-Ziona, Israel) before inhibitor treatment assay. Informed consent was obtained and studies were approved by the Medical Ethical Committee of our institute, in agreement with Helsinki declaration of 1975, as revised in 1983.
Cell death/apoptosis assays
For each condition, 100,000 cells were cultured in 200 μL medium in triplicate wells in flat-bottom 96-wells plates, and at least 3 independent replicate experiments were performed. Imatinib (STI571, imatinib methanesulfonate, LC Laboratories, Woburn, MA), ponatinib (Selleckchem, Houston, TX) MLN4924 (pevonedistat, MedChem Express, Monmouth Junction, NJ) and hydroxyurea (HU, Sigma Aldrich, St. Louis, MO) were added at the indicated concentrations and time periods. Cell death was assessed by 7-aminoactinomycin D (7-AAD, Affymetrix eBioscience, San Diego, CA) staining and flow-cytometry (FACSCantoII™, BD Biosciences, San Jose, CA), acquiring 100 μL cell suspension/condition. Percent specific cell death was calculated as follows: 100x (% 7-AAD+ cells – % baseline 7-AAD+ cells)/(100% – % baseline 7-AAD+ cells). In some experiments 10 μM Q-VD-OPh (APExBIO, Houston, TX) was added.
Immunoblot analysis
Immunoblot analysis of whole cell extracts and nuclear versus cytoplasmic extracts was performed as described previously [Citation42]. The primary antibodies used in this study are listed in Supplementary Table I (Table SI).
DNA damage assays
To assess γH2AX foci formation by immunofluorescence microscopy, cells were cytocentrifuged, air-dried and fixed in 4% formaldehyde, followed by autofluorescence quenching in 50 mM NH4Cl, permeabilization with 0.2% Triton-X and incubation for 1 hr at room temperature with a mouse-anti-γH2AX antibody (JBW301) (EMD Millipore), followed by AlexaFluor-488 conjugated goat-anti-mouse F(ab’)2 fragments (Invitrogen, Thermo Fisher Scientific), and mounted using Vectashield™ antifade medium (Vectorlabs, Burlingame, CA). Multiple (>6) non-overlapping images were captured with a 40x objective lens on a Leica MD5500 B fluorescence microscope (Leica Microsystems, Wetzlar, Germany). A cutoff of >10 γH2AX foci per nucleus was applied as a marker of (induced) DNA damage. Cells with >10 γH2AX foci were counted manually from at least 6 non-overlapping images. For intranuclear γH2AX staining and DNA content analysis by flow-cytometry, cells were fixed and permeabilized using the Foxp3-staining buffer set (Affymetrix eBioscience) as per manufacturer’s instructions. Cells were stained with AlexaFluor-647 conjugated anti-γH2AX antibody (2F3: Biolegend, San Diego, CA) and propidium iodide (PI) (Invitrogen, Thermo Fisher Scientific).
Brdu-incorporation and cell-cycle analysis
Bromodeoxyuridine (BrdU) incorporation analysis was performed as described previously [Citation42]. In brief, cells were incubated for 1 hr with 20 μM BrdU (Sigma Aldrich), followed by ethanol fixation, pepsin digestion and DNA depurination/denaturation by HCl treatment. BrdU incorporation was detected using anti-BrdU (BD Biosciences), and DNA content was assessed by TO-PRO®-3 staining (Thermo Fisher Scientific) and analyzed by flow-cytometry.
Quantitative RT-PCR
Levels of NOXA (PMAIP1) mRNA expression were determined by quantitative RT-PCR essentially as described previously [Citation43]. For each cDNA preparation PCR reactions were performed at least in duplicate for each cDNA preparation, and for each condition at least three independent experiments were performed. Expression of target gene mRNA was normalized to the large ribosomal protein PO (RPLPO) housekeeping gene. The following primers were used: human NOXA-forward 5ʹ-GCTGGAAGTCGAGTGTGCTA-3ʹ, human NOXA-reverse 5ʹ-GGAGTCCCCTCATGCAAGTT-3ʹ, human RPLPO-forward 5ʹ-GCTTCCTGGAGGGTGTCCGC-3ʹ, human RPLPO-reverse 5ʹ- TCCGTCTCCACAGACAAGGCCA-3ʹ.
Retroviral transduction
Retroviral virus stocks for overexpression of human MCL1 were generated by transfection of the LZRS-hMCL1-IRES-GFP vector in Phoenix-Galv cells. After 48 hours, viral supernatants were collected, filtered through a 0.45 μm filter and loaded onto retronectin (Takara Bio, Kusatsu, Japan) coated culture plates. BV173 and KCL22 cells were spinfected by 90ʹ centrifugation (2,000 rpm, 34ºC). After overnight incubation, virus was removed by washing and 3–5 days after transduction, GFP+ cells were sorted by flow-cytometry activated cell sorting (FACS).
Statistical analyses
The Graphpad Prism 6 software package (La Jolla, CA) was used for statistical analysis. To determine additive, synergistic and antagonistic effects, Chou and Talalay’s method implemented in the Compusyn software package was used [Citation44].
Results
MLN4924 effectively induces cell death in Ph+ leukemias
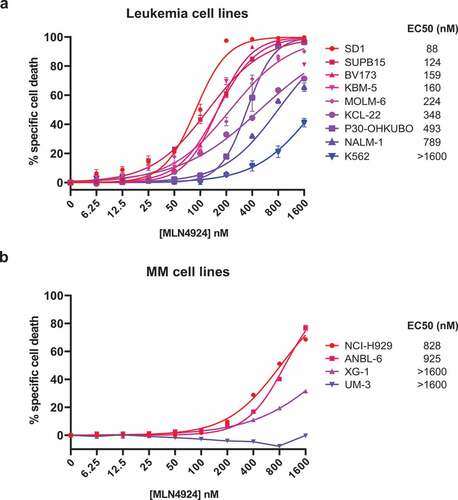
The cytotoxic effect of MLN4924 was determined by exposing a panel of 8 human Ph+ leukemia cell lines (BV173, SUPB15, KBM5, K562, NALM-1, MOLM-6, KCL22 and SD1) and one Ph- pre-B ALL cell line (P30-OHKUBO) to increasing concentrations of MLN4924 (ranging from 6.25 nM to 1.6 μM). The specific cell death was determined by 7-AAD staining and flow-cytometry. MLN4924 treatment effectively induced cell death in a dose-dependent fashion, which was variable between the cell lines, with a median EC50 (half maximal effective concentration) of 298 nM, which is well below the reported maximally achievable plasma concentration of MLN4924 [Citation38]. The K562 cell line was the least sensitive (EC50 > 1.6 μM), whereas SD1 and SUPB15 were the most sensitive cell lines (EC50 88 nM and 124 nM, respectively) ()). For comparison, the cell death-inducing effect of MLN4924 was also determined in 4 human MM cell lines (NCI-H929, ANBL-6, UM-3 and XG1), which with a median EC50 of >1.6 μM were far less sensitive than the Ph+ leukemia cell lines ()). These results show that MLN4924 had cytotoxic effects in Ph+ leukemia cells at clinically relevant concentrations.
Figure 1. MLN4924 effectively induces cell death in Ph+ leukemia cells. In vitro MLN4924-sensitivity of B-ALL cell lines (a) and MM cell lines (b). Cells were treated for 3 days with the indicated concentrations of MLN4924, cell death was determined by 7-AAD staining and flow-cytometry, and specific cell death was calculated as indicated in the materials and methods section. Three independent experiments were performed and cultures were done in quadruplicate, means ± SEM are shown. EC50 values were calculated by non-linear regression.
MLN4924 sensitizes Ph+ leukemia cells for ABL1 kinase inhibitors and hydroxyurea
The Ph+ leukemia cell lines SUPB15, SD1 and KCL22 were described to display marked resistance to imatinib, whereas the BV173 cell line was reported to be modestly sensitive to imatinib [Citation45]. To assess whether MLN4924 treatment sensitized these cell lines to imatinib or to hydroxyurea (HU), which is used to lower leukemic blood count in CML and AML patients in the initial phase of therapy, in vitro combination drug sensitivity experiments were performed. Cells were exposed to increasing doses of imatinib (ranging from 2.5 μM to 20 μM) in combination with increasing doses of MLN4924 (25 nM to 200 nM), at a fixed ratio of 1:100 (MLN4924:imatinib), and the combination index (CI) was calculated according to Chou’s method, allowing quantification of additive (CI = 1), synergistic (C < 1), and antagonistic (CI>1) effects [Citation44]. Despite some variation between the cell lines, synergy (CI ranging from 0.2 to 0.7) was consistently observed for concentrations that induced ≥50% specific cell death, indicating that MLN4924 sensitized Ph+ leukemia to imatinib ()). The cell death-inducing effects of MLN4924 and imatinib were abrogated by the pan-caspase inhibitor Q-VD-OPh, showing that caspase-dependent cell death was induced by these drugs (Fig S1). In addition, MLN4924 and imatinib also synergistically induced cell death of primary leukemia cells from an adult Ph+ B-ALL patient (Fig S2). Similarly, MLN4924 treatment sensitized SUPB15 and BV173 cells to the third generation ABL TKI ponatinib, which was effective in inducing cell death at much lower concentrations (~100- to 1000-fold lower) ()).
Figure 2. MLN4924 synergizes with imatinib and HU for the induction of cell death in Ph+ leukemia cells. (a) Ph+ leukemia cell lines were treated for 3 days with various concentrations of MLN4924 and imatinib at a fixed ratio of 1:100. Three independent experiments were performed, cultures were done in quadruplicate, means ± SEM are shown. (b) SUP15 and BV173 cells were treated for 3 days with indicated concentrations of MLN4924 and ponatinib at a fixed ratio of 5:1. Three independent experiments were performed, cultures were done in triplicate, means ± SEM of a representative experiment are shown. (c) Ph+ leukemia cell lines were treated overnight with various concentrations of MLN4924 and HU at a fixed ratio of 1:1000, as indicated. Three independent experiments were performed, cultures were performed in quadruplicate, means ± SEM are shown. Combination index (CI) values are given for each relevant data point.
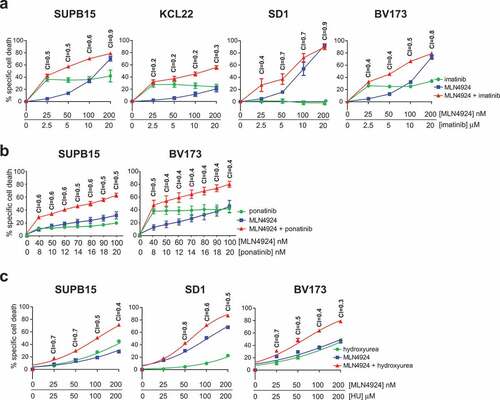
Next, the combination of MLN4924 and HU was tested. BV173, SUPB15 and SD1 cells were treated with increasing doses of HU (25 μM to 200 μM) in combination with MLN4924 at a fixed ratio of 1:1000 (MLN4924:HU). As indicated by the CI values (ranging from 0.3 to 0.7), MLN4924 also sensitized Ph+ leukemia cells for HU ()).
ABL T315I-mutant imatinib-resistant Ph+ leukemia cells are sensitive for MLN4924
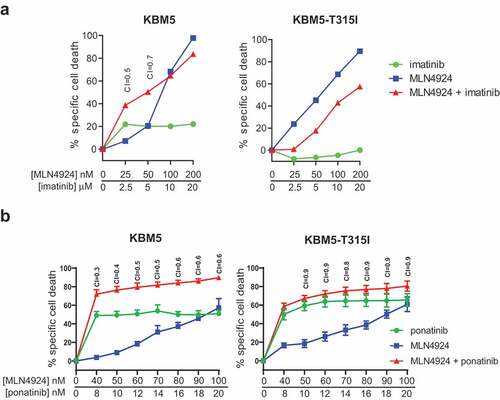
KBM5 is an imatinib-sensitive Ph+ cell line from a CML-BC patient. The KBM5-T315I is an imatinib-resistant subclone of this cell line, harboring the ABL T315I mutation [Citation46]. Both cell lines were exposed to increasing concentration of MLN4924 and imatinib (at a fixed ratio of 1:100). MLN4924 sensitized the parental KBM5 cells for imatinib, but not the imatinib-resistant KBM5-T315I cells, as expected ()). Importantly, we show that the KBM5-T315I was equally sensitive to MLN4924 as the parental KBM5 cells, indicating MLN4924 may also be useful for the treatment of imatinib-resistant Ph+ leukemias. MLN4924 sensitized both the parental KBM5 cells as well as the imatinib-resistant KBM5-T315I subline for ponatinib, as expected ()).
Figure 3. ABL T315I-mutant imatinib resistant Ph+ leukemia cells are sensitive for MLN4924. (a) MLN4924 and imatinib synergize to induce cell death in the Ph+ leukemia cell line KBM5, but not in the imatinib-resistant KBM5 ABL T315I-mutant subline. (b) MLN4924 and ponatinib synergize to induce cell death in both the KBM5 and the KBM5 ABL T315I-mutant subline. Cells were treated for for 3 days with various concentrations of MLN4924 and ponatinib at a fixed ratio of 5:1. Percent specific cell death is shown. Means ± SEM of representative of three independent experiments of triplicate cultures are shown. Combination index (CI) values are given for each relevant data point.
MLN4924 induces DNA damage in Ph+ leukemia cell lines
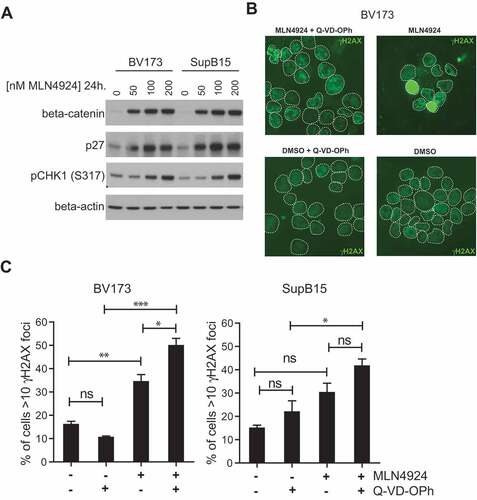
To assess the potential mechanism(s) responsible for cytotoxic effect of MLN4924 in Ph+ leukemia cells, and to understand the basis of sensitization for imatinib treatment, the expression and activation of signaling molecules previously shown to be affected by MLN4924 treatment were determined. We show that MLN4924 had no appreciable effect on NF-κB signaling in BV173 and SUPB15 cells. The nuclear levels of the NF-κB p65 subunit were slightly decreased by MLN4924 treatment, as well as the levels of ser32-phosphorylated IκBα (Fig S3A), which in contrast to our results, were previously shown to accumulate in MLN4924-treated DLBCL cells and also in CML cells harboring wild type BCR-ABL or T315I-BCR-ABL [Citation33,Citation47]. STAT5 tyr694-phosphorylation was not affected by MLN4924, whereas it was abrogated by imatinib treatment, as expected (Fig S3B), indicating that MLN4924 did not impede BCR-ABL signaling. In addition, MLN4924 treatment did not interfere with AKT/mTOR signaling in Ph+ leukemia cells, as judged by AKT ser473-phoshorylation, mTOR ser2448-phosphorylation, and by the lack of nuclear accumulation of the AKT/mTOR targets FOXO1 and FOXO3A (Fig S3C). However, β-catenin and p27, which both are actively degraded by Nedd8-activated Skp1/Cullin1/F-box (SCF) ubiquitin ligase complexes [Citation48,Citation49], accumulated in a dose dependent fashion in MLN4924-treated BV173 and SUPB15 cells ()). Also, MLN4924 treatment resulted in stabilization of the replication licensing factor CDT1, which is an established target of SCF complexes [Citation50] (Fig S4). These results confirm efficient inhibition of neddylation in Ph+ leukemia cells upon MLN4924 treatment. In addition, a dose-dependent increase in CHK1 ser317 phosphorylation was observed suggesting that MLN4924-treated cells experienced genotoxic stress and activated ataxia-telangiectasia and rad3 related (ATR) -dependent checkpoint signaling. In agreement with these data, MLN4924-treatment of BV173 and SUPB15 cells resulted in increased nuclear γH2AX foci formation, which is an established marker of DNA damage ()). In addition, a pan-nuclear γH2AX staining pattern was frequently observed in MLN4924-treated cells, which most likely represents apoptotic cells [Citation51]. Consistently, a greater fraction of cells with >10 γH2AX foci in the nucleus were found in the presence of the pan-caspase inhibitor QVD-OPh ()). Activation of p53 is associated with the induction of cell death in response to DNA damage [Citation52]. However, the response to MLN4924 did not appear to be related to the p53 status of the cell lines used in this study (Table SII).
Figure 4. MLN4924 stabilizes β-catenin and p27, activates the cell-cycle checkpoint protein CHK1 and induces DNA damage in Ph+ leukemia cells. (a) Immunoblot analysis for β-catenin, p27 and phospho-CHK1 (ser317) levels in BV173 and SUPB15 Ph+ leukemia cells treated for 24 hours with MLN4924 at indicated concentrations. The β-catenin blot was used to control for loading. (b) Immunofluorescent γH2AX staining in BV173 cells treated overnight with DMSO (vehicle) or 400 nM MLN4924, with our without Q-VD-OPh. (c) Bar graphs showing percent of cells with >10 γH2AX foci in BV173 and SUPB15 treated as indicated. For each condition, at least 6 non-overlapping images were captured with a 40x magnification objective and scored manually (on average approximately 120 cells per condition). Means ± SEM are shown. Asterisks indicate statistically significant differences (*p < 0.05; ** p < 0.01, *** p < 0.001, One-way ANOVA).
Activation of the intra S-phase cell-cycle checkpoint in MLN4924-treated Ph+ leukemia cells
It was reported that MLN4924 induced cell death in cancer cells by disturbing the cell-cycle and activation of the S-phase checkpoint [Citation31]. In agreement, by BrdU-incorporation and DNA content analysis we found that MLN42924 treatment in BV173 and SUPB15 cells inhibited DNA synthesis and resulted in the accumulation of cells in early S-phase, which was exacerbated by co-treatment with imatinib (), Fig S5). Interestingly, Q-VD-OPh treatment prevented the loss of replicating cells and alleviated the early S-phase blockade but did not completely restore the normal cell-cycle distribution, as replicating cells accumulated in mid S-phase ()). These data suggest that MLN4924-dependent activation of the intra S-phase checkpoint instigated caspase-dependent apoptosis, but did not prevent DNA damage (as shown in that perturbed the cell-cycle in a caspase-independent fashion. Activation of CHK1 kinase is required for checkpoint-mediated cell cycle arrest. Accordingly, we show that the CHK1 inhibitor AZD7762 had an additive effect in combination with MLN4924 (Fig S6), suggesting that CHK1 and Nedd8-conjugation both function in the replication stress response in Ph+ leukemia cells.
Figure 5. Activation of the intra S-phase cell-cycle checkpoint is responsible for the induction of cell death in MLN4924-treated Ph+ leukemia cells. (a) BrdU-incorporation and cell-cycle analysis of BV173 cells treated overnight with 400 nM MLN4924, 0.5 μM imatinib, or the combination of both (upper panels), and in combination with Q-VD-OPh treatment (lower panels). Percent of cells within the gates are indicated. (b) Bargraph depicting the percent of BV173 cells in the different cell-cycle stages, treated as indicated (left panel), and the percent of cells in early-, mid-, and late-S-phase (determined within S-phase gate), treated as indicated (right panel). Means ± SEM of three independent experiments are shown (c) MLN4924 induces DNA damage in late G1-/early S-phase cells. BV173 cells were overnight exposed to various concentrations of MLN4924 and imatinib as indicated. Intranuclear γH2AX was assessed and plotted against DNA content. Percent γH2AX+ cells are indicated. Bargraph depicts the means ± SEM of percentages of γH2AX+ cells of three independent experiments. Asterisks indicate statistically significant differences (** p < 0.01, *** p < 0.001, One-way ANOVA).
In contrast to what was found in cell lines of epithelial origin and for B-CLL cells [Citation31,Citation32,Citation50,Citation53], we did not observe a dramatic increase in the proportion of cells having greater that tetraploid DNA content (>4N), despite accumulation of CDT1 (Fig S4). We show by intranuclear staining for γH2AX and DNA content that cells in the late G1/early S-phase of the cell-cycle sustained DNA damage, and consistent with the synergistic effect of MLN4924 and imatinib on cell death, we found a similar synergistic effect of this combination on the induction of DNA damage (), Fig S4).
Imatinib and MLN4924 induce cell death by altering the MCL1/NOXA balance in Ph+ leukemia cells
DNA damage initiates apoptosis, in part through the induction of the pro-apoptotic BH3-only BCL2-family members PUMA and NOXA, which both antagonize the anti-apoptotic mitochondrial protein MCL1 [Citation54,Citation55]. On the other hand, BCR-ABL signaling was shown to up-regulate MCL1, thereby contributing to enhanced survival of Ph+ leukemia cells by inhibition of apoptosis [Citation56]. To understand the underlying mechanism of imatinib- and MLN4924-induced cell death we analyzed MCL1, PUMA and NOXA protein levels in BV173 and SUPB15 cells. MLN4924 treatment markedly increased NOXA levels in a dose-dependent fashion, whereas the MCL1 and PUMA levels remained largely unchanged or even modestly decreased ()). Also, NOXA mRNA expression was dose-dependently increased in MLN4924-treated BV173 cells, showing that mRNA transcriptional regulation was involved in the increased NOXA expression ()). In agreement with a previous report [Citation56], imatinib treatment led to the down-regulation of MCL1. Interestingly, combined treatment with MLN4924 and imatinib resulted in the up-regulation of NOXA and concomitant down-regulation of MCL1 ()), thus severely shifting the MCL1/NOXA balance, which may underlie the apoptotic effect of this drug combination. The expression of PUMA was down-regulated in these conditions, which appeared largely attributable to the imatinib treatment. Of note, BCL2 expression was not affected by MLN4924, imatinib, or the combination of both (data not shown).
Figure 6. MLN4924 and imatinib treatment alters the MLC1/NOXA balance in Ph+ leukemia cells. (a) Immunoblotting analysis of MCL1, NOXA, and PUMA protein expression in BV173 and SUPB15 cells overnight exposed to various concentrations of MLN4924. Beta-actin blotting was used to control for loading. (b) Quantitative RT-PCR analysis of NOXA expression in BV173 cells overnight exposed to various concentrations of MLN4924. The ratio of NOXA/RPLPO (housekeeping gene) expression is depicted. Means ± SEM of three independent experiments are shown, PCRs were performed in triplicate (*** p < 0.001, One-way ANOVA, Dunn’s post-test). (c) Immunoblot analysis of MCL1, NOXA and PUMA protein levels in BV173 and SUPB15 cells treated overnight with MLN4924 and imatinib, at the indicated concentrations. β-catenin- blotting was used to control for loading. (d) Immunoblot analysis of MCL1 protein expression in BV173 cells transduced with empty vector (BV173-GFP) or with retroviral MCL1 overexpression construct (BV173-MCL1). Cells were treated overnight with various concentrations of MLN4924 as indicated. Beta-actin blotting was used to control for loading. (e) MCL1 overexpression diminishes the sensitivity for MLN4924 and imatinib but does not abrogate synergy. BV173-MCL1 and BV173-GFP cells (upper panels) and KCL22-MCL1 and KCL22-GFP (lower panels) were treated for 3 days with various concentrations of MLN4924 and imatinib at a fixed ratio of 1:100, CI values for relevant data point are indicated. Means ± SEM of percent specific cell death are depicted in the graphs.
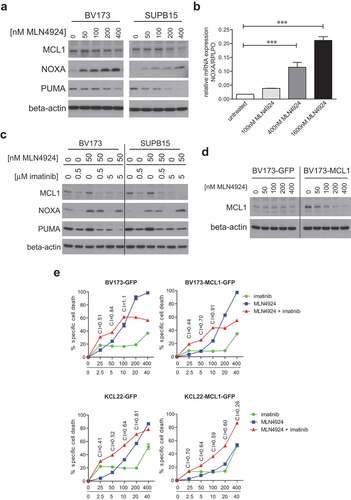
To study the shift of the MCL1/NOXA balance in more detail we overexpressed MCL1 in BV173 and KCL22 cells by retroviral transduction. Overexpression was confirmed by immunoblotting ()). The sensitivity for the combination of MLN4924 and imatinib, as well as for either drug alone, was diminished in MCL1-overexpressing cells, but, surprisingly, the synergistic effect of the combination was not abolished ()). To clarify this, we assessed the stability of MCL1 in MLN4294-treated MCL1-overexpressing BV173 cells. MLN4924 dose-dependently reduced MCL1 expression to baseline level, similar to the level in empty vector-transduced (GFP) cells ()), explaining the modest impact on MLN4924-induced cell death and imatinib-sensitization. These data suggest that MLN4924 may activate or stabilize a negative regulator of MCL1, which remains to be characterized.
Discussion
The introduction of imatinib has dramatically improved the treatment outcome of Ph+ CML and B-ALL patients, but despite these positive results 10–30% of patients will not achieve an optimal or complete response due to toxicities and drug-resistance [Citation57]. Hence, there is an unmet clinical need for novel therapeutic modalities that prevent or circumvent TKI-related toxicities and resistance. We demonstrate here that the first-in-class Nedd8-activating enzyme inhibitor MLN4924 very efficiently induced cell death of Ph+ leukemia cells, surpassing the effect in MM cells, for which MLN4924 is currently under investigation in a phase I/II clinical trial [Citation39]. In line with previous data [Citation47] we showed that MLN4924 induced caspase-dependent apoptosis and was equally active in the imatinib-resistant KBM5-T315I subline as in the parental KBM5 cell line, indicating that MLN4924 may be of use for treatment of imatinib-resistant leukemias. Furthermore, we show that MLN4924 sensitized Ph+ cell lines that are characterized by a limited TKI sensitivity for both imatinib and the third generation ABL TKI ponatinib. Before initiation of TKI therapy and during diagnostic workup, CML patients are typically treated with hydroxyurea (HU) to acutely decrease white blood cells counts [Citation58]. Interestingly, our results show that MLN4924 significantly improved the efficacy of HU treatment, suggesting that this combination might be useful for leukemia debulking regimens. Moreover, it was shown recently that MLN4924 is specifically effective in CML LICs since these have increased levels of NAE1 and single treatment with MLN4924 inhibited survival and self-renewal of these cells [Citation47]. Therefore, we speculate that MLN4924 can be a valuable addition to the current treatment protocols for Ph+ leukemia patients and may significantly aid in not only achieving early and deep MR in these patients, but also eradicating the LICs and thereby reducing the risk of TKI resistance. Therefore, the present study should form the basis for further investigation into the clinical activity of MLN4924 for Ph+ leukemia patients.
Treatment with MLN4924 resulted in DNA damage and the activation of the intra S-phase cell-cycle checkpoint in Ph+ leukemia cells, in line with previous reports on the antitumor and radiosensitizing effects of this compound in other cancer cell types [Citation32,Citation53,Citation59,Citation60]. In agreement, other investigators have shown that Nedd8 is involved in the DNA damage response in multiple ways; it accumulates at the sites of DNA damage by polyneddylation of histone H4, where it plays a role in the recruitment of RNF168, which in turn is important for the recruitment of the DNA repair factors 53BP1 and BRCA1 [Citation61]. In addition, Nedd8-conjugation was shown to be important for proper resolution of non-homologous end-joining (NHEJ) by promoting the ubiquitination and release of the KU70/KU80 from sites of DNA damage [Citation62]. Our data suggest that inhibition of Nedd8-conjugation causes replication stress in Ph+ leukemia cells, which is exacerbated by imatinib co-treatment, but in contrast to several other studies [Citation31,Citation32,Citation50,Citation53], we found that the cytotoxicity of MLN4924 was not due to DNA re-replication. The mechanistic basis for increased replication stress by MLN4924 and imatinib treatment is currently unknown, but may be related to the effect of ABL TKI on global protein neddylation. Immunoblotting experiments using an antibody that detects endogenous levels of free and protein-conjugated Nedd8 showed that treatment of Ph+ cell lines with imatinib or ponatinib resulted in increased protein neddylation. Whereas the levels of neddylated cullin dropped below basal levels in cells treated with the combination of ABL TKIs and MLN4924. These data suggest that ABL TKI treatment may potentiate the inhibitory effect of MLN4924 on NAE1 and global protein neddylation (Fig S7).
Additionally, the enhanced and prolonged intra S-phase checkpoint induced by BCR-ABL1 activity [Citation63]. We speculate that abrogation of this protective mechanism by imatinib renders cells more vulnerable to the replication stress-inducing effect of MLN4924. Enhanced replication stress also explains the synergy between MLN4924 and HU that instigates replication stress by depleting the intracellular nucleotide pool. It was shown that the Cullin-4 E3 ubiquitin ligase activity, which is activated by nedd8-conjugation, is required for the efficient processing of histone mRNA 3ʹ ends, ensuring proper histone supply [Citation64]. It is conceivable that MLN4924 may provoke replication stress by interfering with the expression of histone proteins in Ph+ leukemia cells. We observed robust CHK1 phosphorylation upon MLN4924 treatment. The activity of CHK1 is essential to preserve genomic integrity, and inhibition of CHK1 was shown to cause accumulation of DNA damage by deregulating DNA synthesis resulting in CHK1 phosphorylation [Citation65]. We show that the CHK1 kinase inhibitor AZD7762 had an almost perfect additive effect in combination with MLN4924 (Fig S3), suggesting that CHK1 and Nedd8-conjugation act in the same pathway that prevents replication stress in Ph+ leukemia cells. These findings are in good agreement with a recent study in which it was shown that MLN4924 induces DNA damage as reflected by accumulation of CDT1, γH2AX and phospho-Chk2 [Citation47].
Our results indicate that MLN4924- and imatinib-induced DNA damage and replication stress triggered apoptosis by altering the MCL1/NOXA balance. In other cancer cell types it was also found that MLN4924 increased NOXA protein and mRNA expression [Citation35,Citation47]. Of note, the induction of NOXA was also observed in p53 mutant cell lines (KCL22 and K562, data not shown), indicating its p53 independence. These data are in contrast with a recent study in which it has been shown MLN4924 did not affect the cell viability of p53-null CML cells unless the expression of p53 was ectopically restored [Citation47].
A potential candidate for driving NOXA expression is C-MYC, which was previously shown to be responsible for bortezomib-induced NOXA expression in cancer cells by transactivating the NOXA/PMAIP1 promoter [Citation66]. Consistent with these findings, by chromatin-immunoprecipitation (ChIP) we show that C-MYC was significantly enriched at the NOXA/PMAIP1 promoter in imatinib and MLN4924-treated BV173 cells (Fig S4). In addition, it was recently shown that C-MYC knockdown diminished the induction of NOXA in MLN4924-treated AML cells [Citation35]. We show that imatinib treatment diminished MCL1 expression, in agreement with an earlier study [Citation47,Citation56]. The combination of imatinib and MLN4924 can thus be considered as particularly toxic for Ph+ leukemia cells, as it induces NOXA expression while lowering the expression of MCL1, explaining its sensitizing effect. Moreover, we show that ectopically overexpressed MCL1 is down-regulated to basal levels upon MLN4924 treatment, which potentially cuts short resistance mechanisms that involve increased MCL1 expression. Lastly, ABL TKI treatment potentiated the effect of MLN4924 on NAE1, as shown by Nedd8 immunoblot analysis (Fig S5). Based on this result we hypothesize that increased protein neddylation upon ABL TKI treatment may reflect a salvage pathway, possibly linked to the cell-cycle and cell death-inducing effects of ABL TKIs on Ph+ leukemia cells, but this requires further study. In summary, we show that MLN4924 has promising activity against Ph+ leukemia cells, and these preclinical findings strongly support further clinical investigation of the combination therapy of MLN4924 and imatinib in Ph+ leukemia patients.
Author contribution statement
M.B. performed research, analyzed the data and wrote the paper. T.vD. performed research and analyzed the data. G.dW. performed research and analyzed the data C.M. performed research. T.B. performed research. R.J.B. wrote the paper. C.J.M.vN. wrote the paper. D.M.L. contributed analytical tools. E.E. contributed analytical tools and wrote the paper. M.J.K. analyzed the data and wrote the paper. J.E.J.G. designed research, performed research, analyzed the data and wrote the paper.
Supplemental Material
Download Zip (17.2 MB)Acknowledgments
The authors like to thank Dr. Michael Andreeff and Dr. Bing Carter (MD Anderson Cancer Center, Houston, TX) for kindly providing the KBM5 and KBM5-T315I cell lines. This work was supported by grants from the Academic Medical Center Amsterdam (AMC Fellowship), the Innovational Research Incentives VIDI Scheme (016126355), and the ‘Stichting Kinderen Kankervrij’ KIKA (project 252), all to JEJG.
Disclosure statement
M.J.K. has received support and compensation from Millennium/Takeda Pharmaceuticals for attending advisory boards.
Supplementary material
Supplemental data for this article can be accessed here.
Additional information
Funding
Related Research Data
References
- Moorman AV, Harrison CJ, Buck GAN, et al. Karyotype is an independent prognostic factor in adult acute lymphoblastic leukemia (ALL): analysis of cytogenetic data from patients treated on the medical research council (MRC) UKALLXII/Eastern cooperative oncology group (ECOG) 2993 trial. Blood. 2007;109:3189–3197.
- Mullighan CG. Molecular genetics of B-precursor acute lymphoblastic leukemia. J Clin Invest. 2012;122:3407–3415.
- Ben-Neriah Y, Daley GQ, Mes-Masson AM, et al. The chronic myelogenous leukemia-specific P210 protein is the product of the bcr/abl hybrid gene. Science. 1986;233:212–214.
- Van Etten RA, Jackson P, Baltimore D. The mouse type IV c-abl gene product is a nuclear protein, and activation of transforming ability is associated with cytoplasmic localization. Cell. 1989;58:669–678.
- Shuai K, Halpern J, Ten Hoeve J, et al. Constitutive activation of STAT5 by the BCR-ABL oncogene in chronic myelogenous leukemia. Oncogene. 1996;13:247–254.
- Gleissner B, Gökbuget N, Bartram CR, et al. Leading prognostic relevance of the BCR-ABL translocation in adult acute B-lineage lymphoblastic leukemia: a prospective study of the German multicenter trial group and confirmed polymerase chain reaction analysis. Blood. 2002;99:1536–1543.
- Dombret H, Gabert J, Boiron J-M, et al. Outcome of treatment in adults with Philadelphia chromosome-positive acute lymphoblastic leukemia–results of the prospective multicenter LALA-94 trial. Blood. 2002;100:2357–2366.
- Druker BJ, Tamura S, Buchdunger E, et al. Effects of a selective inhibitor of the Abl tyrosine kinase on the growth of Bcr-Abl positive cells. Nat Med. 1996;2:561–566.
- Druker BJ, Sawyers CL, Kantarjian H, et al. Activity of a specific inhibitor of the BCR-ABL tyrosine kinase in the blast crisis of chronic myeloid leukemia and acute lymphoblastic leukemia with the Philadelphia chromosome. N Engl J Med. 2001;344:1038–1042.
- Kantarjian H, Sawyers C, Hochhaus A, et al. Hematologic and cytogenetic responses to imatinib mesylate in chronic myelogenous leukemia. N Engl J Med. 2002;346:645–652.
- Schultz KR, Bowman WP, Aledo A, et al. Improved early event-free survival with imatinib in Philadelphia chromosome-positive acute lymphoblastic leukemia: a children’s oncology group study. J Clin Oncol. 2009;27:5175–5181.
- Bassan R, Rossi G, Pogliani EM, et al. Chemotherapy-phased imatinib pulses improve long-term outcome of adult patients with Philadelphia chromosome-positive acute lymphoblastic leukemia: Northern Italy leukemia group protocol 09/00. J Clin Oncol. 2010;28:3644–3652.
- le Coutre P, Tassi E, Varella-Garcia M, et al. Induction of resistance to the Abelson inhibitor STI571 in human leukemic cells through gene amplification. Blood. 2000;95:1758–1766.
- Gorre ME, Mohammed M, Ellwood K, et al. Clinical resistance to STI-571 cancer therapy caused by BCR-ABL gene mutation or amplification. Science. 2001;293:876–880.
- Shah NP, Nicoll JM, Nagar B, et al. Multiple BCR-ABL kinase domain mutations confer polyclonal resistance to the tyrosine kinase inhibitor imatinib (STI571) in chronic phase and blast crisis chronic myeloid leukemia. Cancer Cell. 2002;2:117–125.
- Bewry NN, Nair RR, Emmons MF, et al. Stat3 contributes to resistance toward BCR-ABL inhibitors in a bone marrow microenvironment model of drug resistance. Mol Cancer Ther. 2008;7:3169–3175.
- Vianello F, Villanova F, Tisato V, et al. Bone marrow mesenchymal stromal cells non-selectively protect chronic myeloid leukemia cells from imatinib-induced apoptosis via the CXCR4/CXCL12 axis. Haematologica. 2010;95:1081–1089.
- Duy C, Hurtz C, Shojaee S, et al. BCL6 enables Ph+ acute lymphoblastic leukaemia cells to survive BCR-ABL1 kinase inhibition. Nature. 2011;473:384–388.
- Eiring AM, Khorashad JS, Anderson DJ, et al. β-Catenin is required for intrinsic but not extrinsic BCR-ABL1 kinase-independent resistance to tyrosine kinase inhibitors in chronic myeloid leukemia. Leukemia. 2015;29:2328–2337.
- Xie H, Peng C, Huang J, et al. Chronic myelogenous leukemia- initiating cells require polycomb group protein EZH2. Cancer Discov. 2016;6:1237–1247.
- O’Hare T, Eide CA, Deininger MWN. Bcr-Abl kinase domain mutations, drug resistance, and the road to a cure for chronic myeloid leukemia. Blood. 2007;110:2242–2249.
- O’Hare T, Shakespeare WC, Zhu X, et al. AP24534, a pan-BCR-ABL inhibitor for chronic myeloid leukemia, potently inhibits the T315I mutant and overcomes mutation-based resistance. Cancer Cell. 2009;16:401–412.
- Cortes JE, Kantarjian H, Shah NP, et al. Ponatinib in refractory Philadelphia chromosome-positive leukemias. N Engl J Med. 2012;367:2075–2088.
- Mahon F-X, Réa D, Guilhot J, et al. Discontinuation of imatinib in patients with chronic myeloid leukaemia who have maintained complete molecular remission for at least 2 years: the prospective, multicentre Stop Imatinib (STIM) trial. Lancet Oncol. 2010;11:1029–1035.
- Richardson PG, Sonneveld P, Schuster MW, et al. Bortezomib or high-dose dexamethasone for relapsed multiple myeloma. N Engl J Med. 2005;352:2487–2498.
- Robak T, Huang H, Jin J, et al. Bortezomib-based therapy for newly diagnosed mantle-cell lymphoma. N Engl J Med. 2015;372:944–953.
- Kamitani T, Kito K, Nguyen HP, et al. Characterization of NEDD8, a developmentally down-regulated ubiquitin-like protein. J Biol Chem. 1997;272:28557–28562.
- Osaka F, Saeki M, Katayama S, et al. Covalent modifier NEDD8 is essential for SCF ubiquitin-ligase in fission yeast. Embo J. 2000;19:3475–3484.
- Ohh M, Kim WY, Moslehi JJ, et al. An intact NEDD8 pathway is required for Cullin-dependent ubiquitylation in mammalian cells. EMBO Rep. 2002;3:177–182.
- Emanuele MJ, Elia AEH, Xu Q, et al. Global identification of modular cullin-RING ligase substrates. Cell. 2011;147:459–474.
- Soucy TA, Smith PG, Milhollen MA, et al. An inhibitor of NEDD8-activating enzyme as a new approach to treat cancer. Nature. 2009;458:732–736.
- Paiva C, Godbersen JC, Berger A, et al. Targeting neddylation induces DNA damage and checkpoint activation and sensitizes chronic lymphocytic leukemia B cells to alkylating agents. Cell Death Dis. 2015;6:e1807.
- Milhollen MA, Traore T, Adams-Duffy J, et al. MLN4924, a NEDD8-activating enzyme inhibitor, is active in diffuse large B-cell lymphoma models: rationale for treatment of NF-{kappa}B-dependent lymphoma. Blood. 2010;116:1515–1523.
- Gu Y, Kaufman JL, Bernal L, et al. MLN4924, an NAE inhibitor, suppresses AKT and mTOR signaling via upregulation of REDD1 in human myeloma cells. Blood. 2014;123:3269–3276.
- Knorr KLB, Schneider PA, Meng XW, et al. MLN4924 induces Noxa upregulation in acute myelogenous leukemia and synergizes with Bcl-2 inhibitors. Cell Death Differ. 2015;22:2133–2142.
- Leclerc GM, Zheng S, Leclerc GJ, et al. The NEDD8-activating enzyme inhibitor pevonedistat activates the eIF2alpha and mTOR pathways inducing UPR-mediated cell death in acute lymphoblastic leukemia. Leuk Res. 2016;50:1–10.
- Zheng S, Leclerc GM, Li B, et al. Inhibition of the NEDD8 conjugation pathway induces calcium-dependent compensatory activation of the pro-survival MEK/ERK pathway in acute lymphoblastic leukemia. Oncotarget. 2018;9:5529–5544.
- Swords RT, Erba HP, DeAngelo DJ, et al. Pevonedistat (MLN4924), a First-in-Class NEDD8-activating enzyme inhibitor, in patients with acute myeloid leukaemia and myelodysplastic syndromes: a phase 1 study. Br J Haematol. 2015;169:534–543.
- Shah JJ, Jakubowiak AJ, O’Connor OA, et al. Phase I study of the novel investigational NEDD8-activating enzyme inhibitor pevonedistat (MLN4924) in patients with relapsed/refractory multiple myeloma or lymphoma. Clin Cancer Res. 2016;22:34–43.
- Smith MA, Maris JM, Gorlick R, et al. Initial testing of the investigational NEDD8-activating enzyme inhibitor MLN4924 by the pediatric preclinical testing program. Pediatr Blood Cancer. 2012;59:246–253.
- van Andel H, Ren Z, Koopmans I, et al. Aberrantly expressed LGR4 empowers Wnt signaling in multiple myeloma by hijacking osteoblast-derived R-spondins. Proc Natl Acad Sci U S A. 2017;114:376–381.
- Ochodnicka-Mackovicova K, Bahjat M, Bloedjes TA, et al. NF-κB and AKT signaling prevent DNA damage in transformed pre-B cells by suppressing RAG1/2 expression and activity. Blood. 2015;126:1324–1335.
- Ochodnicka-Mackovicova K, Bahjat M, Maas C, et al. The DNA damage response regulates RAG1/2 expression in pre-B cells through ATM-FOXO1 signaling. J Immunol. 2016;197:2918–2929.
- Chou TC, Talalay P. Quantitative analysis of dose-effect relationships: the combined effects of multiple drugs or enzyme inhibitors. Adv Enzyme Regul. 1984;22:27–55.
- Quentmeier H, Eberth S, Romani J, et al. BCR-ABL1-independent PI3Kinase activation causing imatinib-resistance. J Hematol Oncol. 2011;4:6.
- Carter BZ, Mak DH, Schober WD, et al. Regulation of survivin expression through Bcr-Abl/MAPK cascade: targeting survivin overcomes imatinib resistance and increases imatinib sensitivity in imatinib-responsive CML cells. Blood. 2006;107:1555–1563.
- Liu C, Nie D, Li J, et al. Antitumor effects of blocking protein neddylation in T315I-BCR-ABL leukemia cells and leukemia stem cells. Cancer Res. 2018;78:1522–1536.
- Latres E, Chiaur DS, Pagano M. The human F box protein beta-Trcp associates with the Cul1/Skp1 complex and regulates the stability of beta-catenin. Oncogene. 1999;18:849–854.
- Podust VN, Brownell JE, Gladysheva TB, et al. A Nedd8 conjugation pathway is essential for proteolytic targeting of p27Kip1 by ubiquitination. Proc Natl Acad Sci USA. 2000;97:4579–4584.
- Lin JJ, Milhollen MA, Smith PG, et al. NEDD8-targeting drug MLN4924 elicits DNA rereplication by stabilizing Cdt1 in S phase, triggering checkpoint activation, apoptosis, and senescence in cancer cells. Cancer Res. 2010;70:10310–10320.
- Ding D, Zhang Y, Wang J, et al. Induction and inhibition of the pan-nuclear gamma-H2AX response in resting human peripheral blood lymphocytes after X-ray irradiation. Cell Death Discov. 2016;2:16011.
- Hafner A, Bulyk ML, Jambhekar A, et al. The multiple mechanisms that regulate p53 activity and cell fate. Nat Rev Mol Cell Biol. 2019;20:199–210.
- Blank JL, Liu XJ, Cosmopoulos K, et al. Novel DNA damage checkpoints mediating cell death induced by the NEDD8-activating enzyme inhibitor MLN4924. Cancer Res. 2013;73:225–234.
- Villunger A, Michalak EM, Coultas L, et al. p53- and drug-induced apoptotic responses mediated by BH3-only proteins puma and noxa. Science. 2003;302:1036–1038.
- Guikema JE, Amiot M, Eldering E. Exploiting the pro-apoptotic function of NOXA as a therapeutic modality in cancer. Expert Opin Ther Targets. 2017.
- Aichberger KJ, Mayerhofer M, Krauth M-T, et al. Identification of mcl-1 as a BCR/ABL-dependent target in chronic myeloid leukemia (CML): evidence for cooperative antileukemic effects of imatinib and mcl-1 antisense oligonucleotides. Blood. 2005;105:3303–3311.
- Fielding AK, Rowe JM, Buck G, et al. UKALLXII/ECOG2993: addition of imatinib to a standard treatment regimen enhances long-term outcomes in Philadelphia positive acute lymphoblastic leukemia. Blood. 2014;123:843–850.
- Cortes J, Kantarjian H. How I treat newly diagnosed chronic phase CML. Blood. 2012;120:1390–1397.
- Zhou L, Chen S, Zhang Y, et al. The NAE inhibitor pevonedistat interacts with the HDAC inhibitor belinostat to target AML cells by disrupting the DDR. Blood. 2016;127:2219–2230.
- Wei D, Li H, Yu J, et al. Radiosensitization of human pancreatic cancer cells by MLN4924, an investigational NEDD8-activating enzyme inhibitor. Cancer Res. 2012;72:282–293.
- Ma T, Chen Y, Zhang F, et al. RNF111-dependent neddylation activates DNA damage-induced ubiquitination. Mol Cell. 2013;49:897–907.
- Brown JS, Lukashchuk N, Sczaniecka-Clift M, et al. Neddylation promotes ubiquitylation and release of Ku from DNA-damage sites. Cell Rep. 2015;11:704–714.
- Rink L, Slupianek A, Stoklosa T, et al. Enhanced phosphorylation of Nbs1, a member of DNA repair/checkpoint complex Mre11-RAD50-Nbs1, can be targeted to increase the efficacy of imatinib mesylate against BCR/ABL-positive leukemia cells. Blood. 2007;110:651–660.
- Brodersen MML, Lampert F, Barnes CA, et al. CRL4(WDR23)-mediated SLBP ubiquitylation ensures histone supply during DNA replication. Mol Cell. 2016;62:627–635.
- Syljuåsen RG, Sørensen CS, Hansen LT, et al. Inhibition of human Chk1 causes increased initiation of DNA replication, phosphorylation of ATR targets, and DNA breakage. Mol Cell Biol. 2005;25:3553–3562.
- Nikiforov MA, Riblett M, Tang W-H, et al. Tumor cell-selective regulation of NOXA by c-MYC in response to proteasome inhibition. Proc Natl Acad Sci USA. 2007;104:19488–19493.