
ABSTRACT
Objective
Esophageal cancer (EC) is one of the most general malignant tumors in humans. There were few studies researching the connections between lncRNA UCA1 and EC. This study is to research the effect of lncRNA UCA1 adsorbing microRNA-498 (miR-498) as a ceRNA to regulate ZEB2 expression on epithelial mesenchymal transition (EMT), invasion and migration of EC cells.
Methods
UCA1, miR-498 and ZEB2 expression in EC tissues and cells was detected by RT-qPCR or western blot analysis. EC cells were transfected with siRNA-UCA1, miR-498 mimics or their controls to determine cell colony, proliferation, cycle distribution, apoptosis, migration and invasion by colony formation assay, CCK-8 assay, flow cytometry, and Transwell assay, respectively. The protein expression of PCNA, c-Myc, E-cadherin, N-cadherin, MMP-2 and MMP-9 was detected by Western blot analysis. The growth rate and weight of transplanted tumor in nude mice were observed.
Results
There were overly expressed UCA1 and ZEB2 and lowly expressed miR-498 in EC tissues and cells. LncRNA UCA1 acted as ceRNA to inhibit miR-498 expression and thereby increasing ZEB2 expression. With down-regulated UCA1 and up-regulated miR-498, ZEB2 expression, cell proliferation, colony formation, invasion, migration ability, EMT, tumor growth rate and weight in nude mice were apparently reduced.
Conclusion
This study demonstrates that inhibited UCA1 up-regulated miR-498 and down-regulated ZEB2, thereby repressing proliferation activity, invasion, migration, and EMT of EC cells.
KEYWORDS:
Introduction
Esophageal cancer (EC) is one of the 10 most widespread newly diagnosed cancers in the world and the sixth most general reasons of death from cancer [Citation1]. EC usually happens as either squamous cell carcinoma in the middle or upper one-third of the esophagus, or as adenocarcinoma in the lower one-third or junction of the esophagus and stomach [Citation2]. Hookah smoking and cigarettes, hot tea drinking, poor oral health, opium consumption, low socioeconomic status, and low intake of fresh fruit and vegetables have been contributed to the risk of EC [Citation3]. Despite the administration of multidisciplinary treatments [Citation4], including radiotherapy, surgery, and chemotherapy, EC exhibits a poor prognosis, with a five-year survival lower than 20% after diagnosis [Citation5]. Because of the poor prognosis after surgery, it is urgent to seek new therapeutic targets to improve the prognosis of EC.
Long non-coding RNA urothelial carcinoma-associated 1 (UCA1) employs as an oncogene in different human cancers [Citation6]. LncRNA UCA1 could promote cell growth and migration [Citation7], which owns the potential to be a biomarker for the diagnoses of some cancers [Citation8]. Jiao et al. have found that lncRNA UCA1 is a significant molecular for tumor growth and could be an effective target for EC therapy [Citation9]. Several articles have conveyed that lncRNA UCA1 could perform as a competing endogenous RNA (ceRNA) of some microRNA (miRNAs), such as miR-193a [Citation7] and miR-122 [Citation10]. miRNA-485-5p (miR-485-5p) strained EC tumorigenesis and could provide as a novel candidate for therapeutic applications in EC treatment [Citation11]. MiR-498 has been verified to be one of the significant determinants of cell tumorigenicity in all kinds of tumors [Citation12,Citation13]. Zinc finger E-box-binding homeobox 2 (ZEB2) is structurally connected E-box binding homeobox transcription factors that induce epithelial mesenchymal transition (EMT) during development and disease [Citation14]. A study has pointed out that silencing ZEB2 strained the invasion and migration of EC Kyse30 and Kyse410 cells [Citation15]. Another study has revealed ZEB2 expression in esophageal squamous cell carcinoma (ESCC) was connected with plenty of clinicopathological factors, and it was also an independent predictive factor for shorter total living time [Citation16]. This study is to research the influence of lncRNA UCA1 adsorbing miR-498 as a ceRNA to regulate ZEB2 expression on EMT, invasion, and migration of EC cells.
Materials and methods
Ethics statement
The study was ratified by the Institutional Review Board of Taizhou People’s Hospital and followed the tenets of the Declaration of Helsinki. All participants signed a document of informed consent in this study. This study was approved and supervised by the animal ethics association of Taizhou People’s Hospital.
Study subjects
From June 2014 to November 2016, specimens of cancerous tissues and adjacent normal tissues (at least 5 cm away from the tumor edge) with surgical excision were gathered from 70 patients diagnosed with EC in Taizhou People’s Hospital, including 38 males and 32 females. The age of patients was 40 ~ 78 years old, and the median age was 57 years old. There were 42 cases in TNM stage I – II and 28 cases in stage III – IV. There were 37 cases with a tumor size more than 5 cm, and 33 cases less than 5 cm; 29 cases with lymph node metastasis (LNM) and 41 cases without LNM. There were 32 cases of high-grade differentiation and 38 cases of low-grade differentiation. Inclusion criteria: EC was confirmed by histological and pathological examination, which was met with the relevant diagnostic criteria for EC [Citation17]; Preoperative radiotherapy, chemotherapy and other clinical adjuvant therapy were not accepted before operation. Patients with distant metastasis or combined with other malignant tumors were excluded. All tissue samples were preserved in liquid nitrogen in a cryopreservation tube and then moved to a refrigerator at −80°C, during which repeated freeze-thaw of samples was avoided to affect protein denaturation.
Immunohistochemistry
The specimens were fixed in 10% formaldehyde, and the sections embedded with paraffin were 4 μm thickness. The tissue sections were dried in an oven at 60°C for l h, followed by conventional dewaxing and dehydration. The sections were incubated at 37°C with 3% H2O2 (Sigma Aldrich, St Louis, Missouri, USA) for 30 min. The sections were boiled at 0.01 M citrate buffer at 95°C for 20 min, cooled to room temperature, and washed with PBS. The working fluid of normal sheep serum was sealed for 10 min at 37°C. Primary antibody ZEB2 (1:100, Novus Biologicals, Littleton, Colorado, USA) was added into the sections, and incubated overnight at 4°C with PBS washing. The corresponding secondary antibody was dripped into the sections (Shanghai Yubo Biological Technology Co., Ltd., Shanghai, China) and incubated for 30 min. The sections were developed by diaminobenzidine (DAB) (Sigma Aldrich, St Louis, Missouri, USA). The sections were counterstained by hematoxylin (Shanghai Bogoo Biotechnology. Co., Ltd., Shanghai, China) and sealed. Each section was randomly selected with five high-power fields (400 ×), with 100 cells in each field. According to the percentage score of positive cells [Citation18], positive cells >10% of all tumor cells were considered as positive (+), and positive cells ≤10% were considered as negative (-). The immunohistochemical results were scored independently by two persons in a double-blind way.
Cell culture, grouping and transfection
Normal esophageal mucosa epithelial cells Het-1A (Shanghai Enzyme Research Biotechnology Co., Ltd., Shanghai, China) and the EC cell lines TE-1, TE-7, KYSE510, KYSE150, EC9706 (Shanghai Beinuo Biotechnology Co., Ltd., Shanghai, China) cell frozen suspensions were moved to a centrifuge tube. After centrifugation at 800 rpm for 5 min, the supernatant was discarded. Het-1A cell line was added into serum-free LHC-9 medium with 2% fetal bovine serum (FBS); TE-1, TE-7, KYSE510, KYSE150 and EC9706 were cultured with 1640 medium containing 10% FBS. All cell lines were cultured at 37°C in an incubator with 5% CO2 for standby. There were the detachment and passages of cells with 0.25% trypsin and the fluid was changed once every 24 ~48 h. When the cells grew 70–90% confluence, there were the detachment and passages of cells with 0.25% trypsin. Cells at logarithmic growth phase were chosen for the experiment. The expression of UCA1, miR-498 and ZEB2 mRNA in each cell line was tested by reverse transcription-quantitative polymerase chain reaction (RT-qPCR). And the EC cell lines with excessively expressed UCA1 and ZEB2 and the lowest expression of miR-498 were chosen for later cell experiments.
EC9706 cells were classified into the blank group, the siRNA-negative control (NC) group (transfected with siRNA-NC), the siRNA-UCA1 group (transfected with siRNA-UCA1), the mimics-NC group (transfected with miR-498 mimics NC sequence), and the miR-498 mimics group (transfected with miR-498 mimics). For further observing the effect of lncRNA UCA1 in reversing the EMT occurrence, invasion and migration of EC cells by miR-498, groups were set up, such as the pcDNA-UCA1 + mimics-NC group (transfected with pcDNA-UCA1 and miR-498 mimics NC sequence) and the pcDNA-UCA1 + miR-498 mimics group (transfected with pcDNA-UCA1 and miR-498 mimics). Among them, siRNA-NC, siRNA-UCA1, mimics-NC, miR-498 mimics and pcDNA-UCA1 were all synthesized from Shanghai GenePharma Co., Ltd. (Shanghai, China).
Cells were seeded into 12-well plates in 24 h before transfection. Each well was added with 1.5 mL complete culture solution without antibiotics, making the cell density reach about 70–90% when carrying out the infection. According to the specifications of Lipofectamine 2000 (Invitrogen, Carlsbad, CA, USA) transfection reagent, the above transfection content was transfected to EC cell line EC9706. After 6-h transfection, the liquid was changed, and after 48 h-culturing cells were collected for follow-up experiments.
RT-qPCR
Total RNA was extracted by using an RNA extraction kit (Invitrogen, Carlsbad, CA, USA). Primers for UCA1, miR-498, ZEB2, U6 and glyceraldehyde phosphate dehydrogenase (GAPDH) were designed by Takara Biotechnology Co., Ltd. (Osaka City, Osaka Prefecture, Japan) (). RNA was then reversely transcribed into cDNA by using PrimeScript RT kit (Takara Biotechnology Co., Ltd., Dalian, China), with a reverse transcription system of 10 μL. The reaction solution was taken for the fluorescence quantitative PCR, and the fluorescence quantitative PCR was carried out according to the specifications of the SYBR® Premix Ex TaqTM II kit (Takara Biotechnology Co., Ltd., Dalian, China). The fluorescence quantitative PCR was performed in ABI PRISM® 7300 system (Applied Biosystems, Waltham, Massachusetts, USA). The relative expression level of miR-498 was taken with the internal reference of U6, while those of UCA1 and ZEB2 were taken with the internal reference of GAPDH. Relative transcription levels of target genes UCA1, miR-498 and ZEB2 were calculated by using 2 – ΔΔCt [Citation19].
Table 1. PCR primer sequences.
Western blot analysis
Total proteins were extracted. Protein concentration was determined according to bicinchoninic acid kit (AmyJet Scientific, Wuhan, Hubei, China) instructions. There was preparation of 10% sodium dodecyl sulfate (SDS) separation gel and concentration gel. The extracted protein was added with the loading buffer, boiled at 100°C for 5 min, with ice bath and centrifugation. There was 10% polyacrylamide gel electrophoresis for the separation of the protein. And then the protein on the gel was transferred on the nitrocellulose membrane. The protein was added with 5% bovine serum albumin (10-L16, Beijing Zhongsheng Likang Technology Co., Ltd., Beijing, China) and sealed for 1 h. The protein was joined with primary antibody ZEB2 (1: 200), PCNA (1: 1000), c-Myc (1:1000) (Santa Cruz Biotechnology, Santa Cruz,CA, USA), E-cadherin (1: 1000), MMP-2 (1: 1000), MMP-9 (1: 1000) (Proteintech, Chicago, Illinois, USA), N-cadherin (1: 1000), and GAPDH (1: 1000) (Cell Signaling Technology, Beverly, MA, USA) were incubated for whole night at 4°C. The membrane was joined with horseradish peroxidase-labeled IgG (1:1000, Boster Biological Technology Co., Ltd., Wuhan, China) secondary antibody and incubated with oscillation at 37°C for l h. The membrane was placed in an enhanced chemiluminescence reaction solution (Pierce corporation, Washington, USA) for 1 min. After the liquid was removed, the membrane was covered with the food plastic film, exposed in a dark environment and developed by Gel Doc imager (Bio-rad, California, USA). With GAPDH as the internal reference, the protein imprinted images were of analysis through ImageJ2x software (National Institutes of Health, Maryland, USA). There were three-times repeated experiments, and the data were averaged.
Colony formation assay
Cells of each group at logarithmic growth stage were taken, triturated into single cells by detachment with 0.25% trypsin. The cells were suspended in Dulbecco’s Modified Eagle’s medium (DMEM) (Gibco by Life technologies, Grand Island, NY, USA) including 10% FBS for later use. The cells were seeded into 6-well plates at the density of 800 cells/well, incubated at 37°C with 5% CO2 for 2–3 w. The solution was changed every week. Under the microscope, the culture was terminated when each monoclone contained more than 50 cells. The supernatant was discarded, and PBS was washed for 2 times. The cells were of fixation with 4% paraformaldehyde for 15 min, and the fixed solution was removed. The crystal violet solution was added for staining for 10–30 min, and the staining solution was washed away by running water. The colonies were defined by cell colonies of more than 50 cells, and the number of colonies was finally calculated.
Cell counting kit-8 (CCK-8) assay
When reaching about 80% confluence, the cells were washed with PBS twice and detached with 0.25% trypsin, making a single cell suspension. After counting, the cells were seeded into 96-well plates with 3000 cells/100 μL per well and incubated. At 24th h, 48th h and 72th h after transfection, the cells were added with 10 µL CCK-8 reagent (Sigma Aldrich, St Louis, Missouri, USA) in each well with 2-h culture. The optical density (OD) value of each well at 450 nm was read by a microplate reader (Beijing Potenov Technology Co., Ltd., Beijing, China). There were three-times repeated experiments. Cell activity graph was drawn with the time point as the horizontal coordinate and OD value as the vertical coordinate.
Transwell assay
Cells of each group at logarithmic growth stage were detached with trypsin, rinsed with PBS. The cells were re-suspended with serum-free Opti-MEMI (Invitrogen, Carlsbad, CA, USA). The cell concentration was adjusted to 4 × 10⁵ cells/mL. There were 8 μm Transwell chambers (Corning, NY, USA) in 24-well plates used in the experiment. Each upper chamber was joined with 100 μL cell suspension, and each lower chamber was dripped with 10% FBS and chemokines epidermal growth factor (EGF) (25 ng/mL) medium (for the invasion assay, polycarbonate vinegar membrane in Transwell chamber was gelatinized with matrigel and fixed at 37°C for 45 min, with the rest of steps were similar to the migration experiment). The Transwell chambers were put into an incubator with 5% CO2 at 37°C for 24-h incubation. The culture solution of the Transwell upper chamber was sucked and rinsed with PBS once. After fixed with 4% paraformaldehyde for 30 min, the chamber was put into 0.2% Triton X-100 (Sigma Aldrich, St Louis, Missouri, USA) solution for 15 min. With being stained with 0.5% crystal violet solution for 5 min, the cells were rinsed with double steam water for 3 times and the number of stained cells was calculated under an inverted microscope. There were casually chosen five fields for the count, and the amount of cells was expressed by means. Repeated three-times experiments have existed.
Tumor formation in nude mice
Cells of each group in the logarithmic growth phase of EC9706 cells were detached with trypsin into a single cell suspension. The cells were centrifuged at 1000 rpm for 5 min and re-suspended with 1 × 10⁷ cells/200 μL volume in DMEM medium containing 10% FBS. There were 21 Balb/c nude mice, with age of 3–4 weeks old. The mice were purchased from Nanjing Biomedical Research Institute (Nanjing, China). The mice were cultured for 1 week, given appropriate diet, with room temperature at 22–25°C and normal circadian rhythm. The mice were kept in a clean animal house and divided into seven groups, with three mice in each group. The above-mentioned cell fluid with a volume of 200 μL was subcutaneously injected into the back of each nude mouse. The mice were continually fed after injection. The tumor size was measured with vernier calipers every 7 days. The volume was computed in accordance with the formula V = long diameter × short diameter2/2. After the experiment, tumor (g) was measured and the mean value of each group was calculated. All nude mice were killed after the experiment.
Fluorescence in situ hybridization (FISH) assay
The subcellular localization of lncRNA UCA1 was identified by FISH technique. In line with the instructions of RiboTMlncRNA FISH Probe Mix (Red) (RiboBio Co., Ltd., Guangzhou, China), the specific methods were as follows: a slide was put into a 24-well culture plate. The cells were taken and seeded by 6 × 10⁴ cells/well, reaching about 80% cell confluence. The slides were taken out and fixed with 1 mL 4% paraformaldehyde. After being treated with protease K, glycine and ethyl phthalide reagent, the cells were joined with 250 µL prehybridization solution and incubated at 42°C for 1 h. Pre-hybridization solution was removed and 250 µL lncRNA UCA1 (300 ng/mL) hybridization solution containing probe was added. The cells were hybridized overnight at 42°C. After Phosphate Buffered Saline plus Tween-20 (PBST) cleaning for 3 times, the cells were added with 4ʹ,6-diamidino-2-phenylindole 2hci(a stain) (DAPI) (ab104139, 1:100, Abcam, Shanghai, China) diluted with PBST for staining the nucleus. The cells were joined into 24-well culture plates with 5-min staining. The anti-fluorescence quenching agent was used to seal the slides. There were observation and photographing of cells under the fluorescence microscope (Olympus, Tokyo, Japan).
Luciferase activity assay
Through bioinformatics website (https://cm.jefferson.edu/rna22/Precomputed/), the binding sites between the lncRNA UCA1 and miR-498 were predicted and analyzed. Luciferase activity assay was employed to verify the binding relationship between UCA1 and miR-498. And the wild type (WT) sequence and mutant type (MUT) sequence of miR-498 3ʹ-untranslated region (3ʹ-UTR) was synthesized artificially. The restriction enzymes were used to cut pmiR-RB-REPORTTM plasmid (RiboBio Co., Ltd., Guangzhou, China). Then, the synthetic gene fragments WT and MUT were inserted into the pmiR-RB-REPORTTM vector (RiboBio Co., Ltd., Guangzhou, China) respectively. At the same time, empty plasmid transfected was as the control group. The correct luciferase reporter plasmids WT and MUT were sequenced for subsequent transfection, and the vectors of WT and MUT were transferred to EC9706 cells by oe-NC or oe-UCA1. After 48-h transfection, the cells were gathered and lysed with centrifugation of 3–5 min. The supernatant was taken, and relative light unit (RLU) was examined by luciferase detection kit (RG005, Shanghai Beyotime Biotechnology Co., Ltd., Shanghai, China) respectively. With firefly luciferase as internal inference, the RLU of firefly luciferase to RLU of renilla luciferase ratios were determined and expressed as relative luciferase activity. The experiment was repeated three times.
Through bioinformatics software (http://www.targetscan.org), the target relationship between miR-498 and ZEB2 and the binding sites between miR-498 and ZEB2 3ʹ-UTR were predicted, respectively. ZEB2 3ʹ-UTR WT plasmid (ZEB2-WT) and ZEB2 3ʹ-UTR MUT plasmid (ZEB2-MUT) were constructed. The procedures were carried out according to the plasmid extraction kit (Promega, Madison, WI, USA). The logarithmically grown EC9706 cells were seeded into a 96-well plate, and then transfected with Lipofectamine 2000 when the cell reached about 70% confluence. The ZEB2-WT and ZEB2-MUT plasmids were mixed with mimics NC and miR-498 mimics plasmids, respectively, and then transfected into EC9706 cells together. Cells were gathered and lysed after 48-h transfection, and luciferase activity was tested by a luciferase assay kit. Repeated three-time experiments were showed up.
RNA-pull down assay
Biotin-labeled miR-498 WT plasmid and biotin-labeled miR-498 MUT plasmid (50 nM each) were transfected to cells, respectively. After 48-h transfection, the cells were gathered, and of 10-min incubation with specific cell lysates (Ambion, Austin, Texas, USA). Then, there were 50 mL sample cell lysates divided. Residual lysates were incubated with M-280 streptomyces magnetic bead precoated with RNase-free and yeast tRNA (Sigma, St. Louis, MO, USA). The cells were incubated at 4°C for 3 h, and then wash twice with cold lysate, three times with low salt buffer, and once with high salt buffer. Antagonistic miR-498 probes were set up as an NC. Total RNA was extracted by Trizol, and UCA1 expression was tested by RT-qPCR.
Statistical analysis
All data were processed by SPSS 21.0 statistical software. Measurement data were of expression in the performance of mean ± standard deviation. Comparison between the two groups was of analysis by the t-test, and one-way analysis of variance (ANOVA) was employed for comparison in multiple groups. Pearson correlation analysis was employed for analysis of the relationship of UCA1 and miR-498 expression in EC tissues. The chi-square test was for confirming the connection between lncRNA UCA1 expression and the clinicopathological features of patients with EC. P < 0.05, there was statistically crucial difference.
Results
Highly expressed UCA1 and ZEB2 and poorly expressed miR-498 in EC tissues
RT-qPCR results showed that UCA1 and ZEB2 expression levels were apparently increased, and miR-498 expression levels were distinctly decreased in EC tissues compared with adjacent normal tissues (all P < 0.05) ().
Figure 1. High expression of UCA1 and ZEB2 and low expression of miR-498 in EC tissues. A. Expression levels of UCA1, miR-498 and ZEB2 mRNA in EC tissues and adjacent normal tissues; B. Correlation analysis of UCA1 and miR-498 expression in EC tissues; C. ZEB2 immunohistochemical staining for positive rate of ZEB2 protein in EC tissues and adjacent normal tissues (× 400, 25 μm); D. Comparison of positive rate of ZEB2 protein expression in EC tissues and adjacent normal tissues; E. Protein band of ZEB2 protein in EC tissues and adjacent normal tissues; F. Quantification results of ZEB2 protein expression in EC tissues and adjacent normal tissues; * P < 0.05 vs adjacent normal tissues. Data were expressed in the form of mean ± standard deviation. The t-test was used for data analysis.
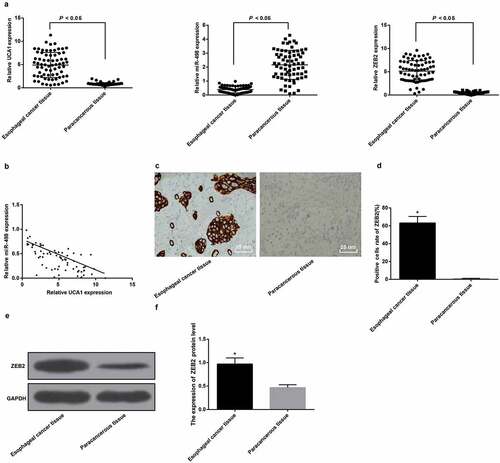
Pearson correlation analysis was for analysis of the correlation between UCA1 and miR-498 expression in EC tissues, and the results indicated that UCA1 and miR-498 expression in EC tissues was manifest negatively correlated (r = −0.7105, P < 0.001; ).
Immunohistochemistry and Western blot analysis results manifested that ZEB2 protein was mainly expressed in cytoplasm, and the positive expression was brown-yellow. With neighboring normal tissues by comparison, the positive rate and expression of ZEB2 protein in EC tissues were evidently increased (all P < 0.05) (-).
Apparent correlation between TNM staging and LNM of EC and UCA1 expression
The results showed that patients with EC were divided into two groups according to the median value of relative UCA1 expression level: low expression and high expression groups. The relationships between the high and low expression and clinicopathological parameters of EC tissues were analyzed, respectively. The results manifested that there was a manifest correlation of TNM stage and appearing of LNM with UCA1 expression level (P < 0.05), while age, gender, tumor differentiation degree and tumor size had nothing to do with UCA1 expression levels (P > 0.05) ().
Table 2. Distinct correlation between TNM staging and lymph node metastasis of esophageal cancer and UCA1 expression.
Silencing lncRNA UCA1 promotes miR-498 expression, thereby downregulating ZEB2 expression
For exploring the mechanism of UCA1 in EC, UCA1 was analyzed through the online analysis website (http://lncatlas.crg.eu/), and the results suggested that UCA1 was mainly distributed in cytoplasm (). The results were verified by the RNA-FISH assay, which showed that UCA1 was indeed concentrated in the cytoplasm, indicating that UCA1 might function in the cytoplasm (). Through searching RNA22 website (https://cm.jefferson.edu/rna22/Precomputed/), UCA1 could combine with miR-498 (). Dual-luciferase reporter gene assay results found that with oe-NC group by contrast, there was distinctly decreased luciferase activity of miR-498-WT in the oe-UCA1 group (P < 0.05), while there was no distinct difference in luciferase activity of miR-498-MUT (P > 0.05), suggesting that there might be a specifically binding relationship between miR-498 and UCA1 (). RNA pull-down assay was used to verify that UCA1 could be used as ceRNA to adsorb miR-498. The results revealed that UCA1 enrichment level in the Bio-miR-498-WT group distinctly increased in comparison with the Bio-probe NC group (P < 0.05), while UCA1 enrichment level in the Bio-miR-498-MUT group indicated no significant difference (P > 0.05) (). The above results performed that lncRNA UCA1 could adsorb miR-498 as a ceRNA, thereby affecting the expression of mir-498.
Figure 2. Silencing lncRNA UCA1 up-regulates miR-498 expression, thereby down-regulating ZEB2 expression. A. UCA1 subcellular localization predicted by online analysis website; B. UCA1 subcellular localization verified by FISH assay (× 800, 12.5 μm); C. The binding site of UCA1 and miR-498 predicted in RNA22 website; D. The combination of UCA1 and miR-498 verified by luciferase activity assay; E. RNA pull-down detection of UCA1 enrichment by miR-498; F. The target relationship between miR-498 and ZEB2 predicted by Targetscan website; G. The targeting relationship between miR-498 and ZEB2 verified by luciferase activity assay. * means P < 0.05; The data in the figure were all measurement data, expressed as mean ± standard deviation. The independent sample t-test was used for statistical analysis between the two groups, One-way ANOVA was used for the comparison among multiple groups, and LSD-t was used for pairwise comparison after ANOVA analysis. The experiment was repeated three times.
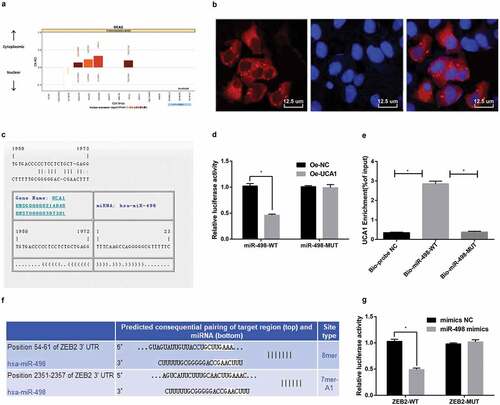
The results of luciferase activity assay expressed that the relative luciferase activity of ZEB2-WT in the miR-498 mimics group was overtly reduced relative to the mimics NC group (P < 0.05). However, the relative luciferase activity of the cells was not affected by co-transfection with ZEB2-MUT and miR-498 mimics (P > 0.05). This suggested that ZEB2 was an immediate target gene of miR-498 (–).
Highly expressed UCA1 and ZEB2 and lowly expressed mir-498 in EC cells
UCA1, miR-498 and ZEB2 mRNA expression in human esophageal mucosal epithelial cells Het-1A and EC TE-1, TE-7, KYSE510, KYSE150 and EC9706 cell lines were tested by RT-qPCR. The EC cell lines with the highest expression of UCA1 and ZEB2 and the lowest miR-498 expression were screened. The results displayed that by contrast with Het-1A cell lines, the expression of UCA1 and ZEB2 mRNA in TE-1, TE-7, KYSE510, KYSE150 and EC9706 cell lines were manifest increased, and the expression of miR-498 was distinctly reduced (all P < 0.05). In EC cell lines, UCA1 and ZEB2 mRNA expression levels of EC9706 cell lines were the highest, while miR-498 expression levels were the lowest (). Western blot analysis results showed that ZEB2 protein expression was overtly increased in TE-1, TE-7, KYSE510, KYSE150 and EC9706 cell lines with Het-1A cell lines by comparison (all P < 0.05). ZEB2 protein expression was highest in EC9706 cell line of EC (–). Therefore, EC9706 cell lines were selected for subsequent cell experiments.
Figure 3. High expression of UCA1 and ZEB2 and low expression of miR-498 in EC cell lines. A. UCA1, miR-498 and ZEB2 mRNA expression in Het-1A, TE-1, TE-7, KYSE510, KYSE150 and EC9706 cell lines; B. Protein bands of ZEB2 in Het-1A, TE-1, TE-7, KYSE510, KYSE150, EC9706 cell lines; C. Quantification results of protein expression of ZEB2 in Het-1A, TE-1, TE-7, KYSE510, KYSE150, EC9706 cell lines; * P < 0.05 vs Het-1A cell line; N = 3, the data were expressed in the form of mean ± standard deviation; One-way ANOVA was used for data analysis, and LSD-t was used for pairwise comparison after ANOVA analysis.
Promotion of miR-498 and down-regulation of ZEB2 by decreasing UCA1
RT-qPCR results showed that there were no obvious differences in the expression levels of miR-498 and ZEB2 mRNA in the blank group, siRNA-NC group, mimics-NC group, and pcDNA-UCA1 + miR-498 mimics group (P > 0.05). In contrast with the siRNA-NC group, the expression of UCA1 and ZEB2 mRNA in the siRNA-UCA1 group was apparently reduced, and miR-498 expression was obviously increased (all P < 0.05). In comparison with the mimics-NC group, ZEB2 mRNA expression level in the miR-498 mimics group was distinctly reduced, and the miR-498 expression level was obviously increased (both P < 0.05), while the UCA1 expression was not overtly changed (P > 0.05). In order to further observe the reverse influence of lncRNA UCA1 on UCA1, miR-498 and ZEB2 expression in EC9706 cell lines caused by miR-498, the results revealed that, making contrast with the pcDNA-UCA1 + mimics-NC group, ZEB2 mRNA expression in the pcDNA-UCA1 + miR-498 mimics group was overtly reduced, and miR-498 expression was apparently increased (both P < 0.05), while UCA1 expression was not evidently changed (P > 0.05) ().
Figure 4. Up-regulated miR-498 and declined ZEB2 by down-regulated UCA1. A. Expression of UCA1, miR-498 and ZEB2 mRNA in transfected cells of each group; B. Protein bands of ZEB2 in transfected cells of each group; C. Quantification results of protein expression of ZEB2 in transfected cells of each group; * P< 0.05 vs the siRNA-NC group. # P < 0.05 vs the mimics-NC group; & P < 0.05 vs the pcDNA-UCA1 + mimics-NC group. N = 3, the data were expressed in the form of mean ± standard deviation; One-way ANOVA was used for data analysis, and LSD-t was used for pairwise comparison after ANOVA analysis.
Western blot analysis results indicated that there was no apparent difference of ZEB2 protein expression levels in the blank group, siRNA-NC group, mimics-NC group and pcDNA-UCA1 + miR-498 mimics group (P > 0.05). With the siRNA-NC group by contrast, ZEB2 protein expression in the siRNA-UCA1 group was obviously reduced (P < 0.05). With mimics-NC group by comparison, ZEB2 protein expression level in the miR-498 mimics group was overtly reduced (P < 0.05). By contrast with the pcDNA-UCA1 + mimics-NC group, ZEB2 protein expression level in the pcDNA-UCA1 + miR-498 mimics group was distinctly reduced (P < 0.05) (-).
Inhibited cell colony formation of EC9706 cells by silencing UCA1 and up-regulated miR-498
The results of colony formation experiment revealed that there was no apparent difference in the amount of colonies in the blank group, siRNA-NC group, mimics-NC group and pcDNA-UCA1 + miR-498 mimics group (P > 0.05). With the siRNA-NC group by comparison, the number of colonies in the siRNA-UCA1 group was distinctly reduced (P < 0.05). With mimics-NC group by contrast, the colony number of the miR-498 mimics group was overtly reduced (P < 0.05). In order to further observe the effect of lncRNA UCA1 reversing miR-498 on the colony number of EC9706 cell line, the results indicated that, in comparison with the pcDNA-UCA1 + mimics-NC group, the colony number of the pcDNA-UCA1 + miR-498 mimics group was manifest reduced (P < 0.05) (-).
Figure 5. Inhibited cell colony formation ability of EC9706 cells by silencing UCA1 and up-regulated miR-498. A. Colony formation after transfection of EC9706 cells in each group; B. Comparison of the number of colonies after transfection of EC9706 cells in each group; * P < 0.05 vs the siRNA-NC group. # P< 0.05 vs mimics-NC group; & P < 0.05 vs the pcDNA-UCA1 + mimics-NC group. N = 3, the data were expressed in the form of mean ± standard deviation; One-way ANOVA was used for data analysis, and LSD-t was used for pairwise comparison after ANOVA analysis.
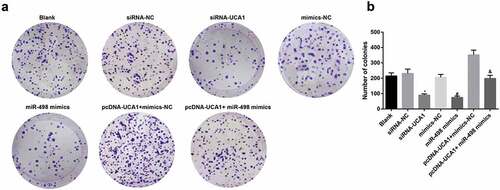
Inhibited cell proliferation of EC9706 cells by silencing UCA1 and up-regulated miR-498
CCK-8 assay was for detection of the changes in proliferation capacity of each group after transfection, and the results suggested that the detection of the proliferation ability of the blank group, siRNA-NC group, mimics-NC group and pcDNA-UCA1 + miR-498 mimics group, and no apparent difference was showed up in proliferation ability between 24 and 72 h (P > 0.05). With the siRNA-NC group by contrast, the cell proliferation ability of the siRNA-UCA1 group was manifest reduced at 24–72 h (P < 0.05). In comparison with the mimics-NC group, the cell proliferation ability of the miR-498 mimics group was obviously reduced at 24–72 h (P < 0.05). In order to further observe the effect of lncRNA UCA1 reversing miR-498 on the proliferation ability of EC9706 cells, the results suggested that, by contrast with the pcDNA-UCA1 + mimics-NC group, the cell proliferation ability of the pcDNA-UCA1 + miR-498 mimics group was overtly reduced at 24–72 h (P < 0.05) ().
Figure 6. Inhibited cell proliferation of EC9706 cells by silencing UCA1 and up-regulated miR-498. A. Differences in cell proliferation after transfection of EC9706 cells in each group; B. Protein bands of PCNA and c-Myc in transfected EC cells of each group; C. Quantification results of PCNA protein expression after transfection of EC9706 cells in each group; D. C-Myc protein expression after transfection of EC9706 cells in each group; * P < 0.05 vs the siRNA-NC group. # P < 0.05 vs mimics-NC group; & P < 0.05 vs the pcDNA-UCA1 + mimics-NC group. N = 3, the data were expressed in the form of mean ± standard deviation; One-way ANOVA was used for data analysis, and LSD-t was used for pairwise comparison after ANOVA analysis.
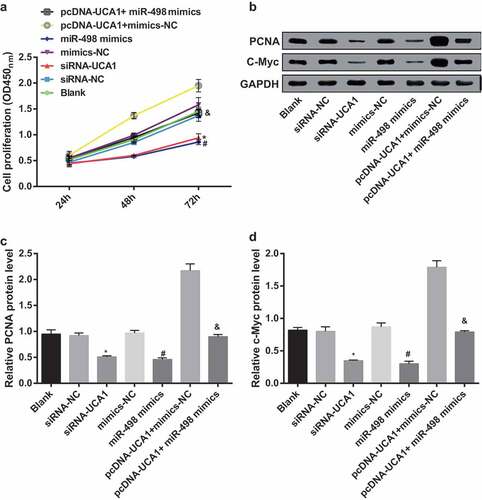
Western blot analysis results revealed that no obvious difference happened in PCNA and c-Myc protein expression in the blank, siRNA-NC, mimics-NC, pcDNA-UCA1 + miR-498 mimics groups (P > 0.05). In contrast with the siRNA-NC group, the expression levels of PCNA and c-Myc proteins in the siRNA-UCA1 group were distinctly reduced (both P < 0.05). Making comparison with the mimics-NC group, the expression levels of PCNA and c-Myc proteins in the miR-498 mimics group were distinctly reduced (both P < 0.05). By comparison with the pcDNA-UCA1 + mimics-NC group, the expression levels of PCNA and c-Myc proteins in the pcDNA-UCA1 + miR-498 mimics group were evidently reduced (both P < 0.05) (–).
Inhibited cell invasion and migration of EC9706 cells by silencing UCA1 and up-regulated miR-498
Transwell assay results suggested no obvious difference in cell migration and invasion ability in the blank, siRNA-NC, mimics-NC and pcDNA-UCA1 + miR-498 mimics groups (P > 0.05). With the siRNA-NC group by comparison, the cell invasion and migration ability of the siRNA-UCA1 group were apparently decreased (P < 0.05). By contrast with the mimics-NC group, the cell invasion and migration ability of the miR-498 mimics group were distinctly reduced (P < 0.05). To further observe the effect of lncRNA UCA1 reversing miR-498 on the ability of the invasion and migration of EC9706 cells, the results revealed that, by contrast with the pcDNA-UCA1 + mimics-NC group, the cell invasion and migration ability was manifest reduced in the pcDNA-UCA1 + miR-498 mimics group (P < 0.05) (–).
Figure 7. Declining cell migration and invasion of EC9706 cells by silencing UCA1 and up-regulated miR-498. A. Comparison of migration and invasion ability of EC9706 cells in each group after transfection (× 100, 100 μm); B. Comparison of migration and invasion numbers of EC9706 cells in each group after transfection; C. Protein bands of MMP-2 and MMP-9 in transfected EC9706 cells of each group; D. Quantification results of protein expressions of MMP-2 and MMP-9 in transfected EC9706 cells of each group;* P < 0.05 vs the siRNA-NC group. # P< 0.05 vs mimics-NC group; & P < 0.05 vs the pcDNA-UCA1 + mimics-NC group. N = 3, the data were expressed in the form of mean ± standard deviation; One-way ANOVA was used for data analysis, and LSD-t was used for pairwise comparison after ANOVA analysis.
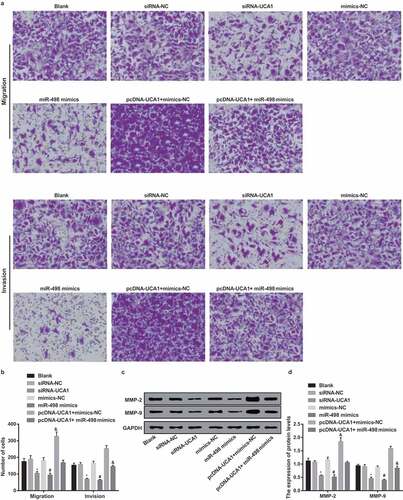
Western blot analysis results revealed that no apparent difference occurred in MMP-2 and MMP-9 expression in the blank, siRNA-NC, mimics-NC, and pcDNA-UCA1 + miR-498 mimics groups (P > 0.05). In comparison with the siRNA-NC group, the expression levels of MMP-2 and MMP-9 proteins in the siRNA-UCA1 group were distinctly reduced (both P < 0.05). In contrast with the mimics-NC group, the expression levels of MMP-2 and MMP-9 proteins in the miR-498 mimics group were overtly reduced (both P < 0.05). For further observing the influence of lncRNA UCA1 reversing miR-498 on MMP-2 and MMP-9 proteins expression in EC9706 cells, by contrast with the pcDNA-UCA1 + mimics-NC group, MMP-2 and MMP-9 proteins expression in the pcDNA-UCA1 + miR-498 mimics group were obviously reduced (both P < 0.05) (-).
Inhibited EMT of EC9706 cells by silencing UCA1 and up-regulated miR-498
Western blot analysis results revealed that no obvious difference was present in E-cadherin and N-cadherin expression in the blank, siRNA-NC, mimics-NC, and pcDNA-UCA1 + miR-498 mimics groups (P > 0.05). In contrast with the siRNA-NC group, the expression level of N-cadherin protein in the siRNA-UCA1 group was apparently reduced, while the expression of E-cadherin protein was distinctly increased (P < 0.05). With the mimics-NC group by comparison, the expression level of N-cadherin protein in the miR-498 mimics group was overtly reduced, while the expression level of E-cadherin protein was distinctly increased (both P < 0.05). For further observing the influence of lncRNA UCA1 reversing miR-498 on E-cadherin and N-cadherin proteins expression in EC9706 cells, by contrast with the pcDNA-UCA1 + mimics-NC group, N-cadherin protein expression in the pcDNA-UCA1 + miR-498 mimics group was manifest reduced, and E-cadherin protein expression was overtly increased (both P < 0.05) (–).
Figure 8. Inhibited EMT of EC9706 cells by silencing UCA1 and up-regulated miR-498. A. Protein bands of E-cadherin and N-cadherin in transfected EC9706 cells of each group; B. Quantification results of protein expression of E-cadherin and N-cadherin in transfected EC9706 cells of each group; * P < 0.05 vs the siRNA-NC group. # P < 0.05 vs mimics-NC group; & P < 0.05 vs the pcDNA-UCA1 + mimics-NC group. N = 3, the data were expressed in the form of mean ± standard deviation; One-way ANOVA was used for data analysis, and LSD-t was used for pairwise comparison after ANOVA analysis.
Declining tumor volume and weight in nude mice with EC by silencing UCA1 and up-regulated miR-498
The growth changes of EC were observed through the establishment of tumor-forming experiments in nude mice, and the results of the tumor volume changes in nude mice showed no apparent difference in the blank, the siRNA-NC, the mimics-NC, and the pcDNA-UCA1 + miR-498 mimics groups (P > 0.05). In contrast with the siRNA-NC group, the tumor volume of nude mice in the siRNA-UCA1 group at the 14th to 35th day was distinctly reduced (P < 0.05). In contrast with the mimics-NC group, the tumor volume of nude mice in the miR-498 mimics group at the 14th to 35th day was overtly reduced (P < 0.05). In order to further observe the effect of lncRNA UCA1 reversing miR-498 on the tumor volume change of nude mice, with the pcDNA-UCA1 + mimics-NC group by contrast, the tumor volume of nude mice in the pcDNA-UCA1 + miR-498 mimics group was overtly reduced at the 14th to 35th day (P < 0.05) (–).
Figure 9. Declining tumor volume and tumor weight in nude mice with EC by silencing UCA1 and up-regulated miR-498. A. Tumorigenesis of nude mice transfected with EC9706 cells in each group; B. Changes in tumor volume of nude mice after transfection of EC9706 cells in each group; C. Comparison of tumor weight of glioma after transfection of EC9706 cells in each group; * P < 0.05 vs the siRNA-NC group. # P < 0.05 vs mimics-NC group; & P < 0.05 vs the pcDNA-UCA1 + mimics-Nc group. N = 3, the data were expressed in the form of mean ± standard deviation; One-way ANOVA was used for data analysis, and LSD-t was used for pairwise comparison after ANOVA analysis.
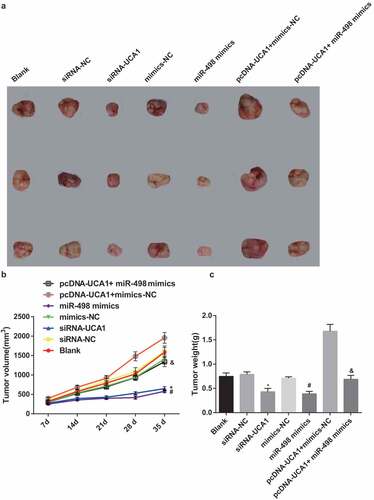
The results suggested that no distinct difference showed up in tumor weight of nude mice with EC in the blank, the siRNA-NC, the mimics-NC, and the pcDNA-UCA1 + miR-498 mimics groups (P > 0.05). With the siRNA-NC group by comparison, the tumor weight of nude mice with EC in the siRNA-UCA1 group was apparently reduced (P < 0.05). In contrast with the mimics-NC group, the tumor weight of nude mice with EC in the miR-498 mimics group was manifest reduced (P < 0.05). For further observing the effect of lncRNA UCA1 reversing miR-498 on the tumor weight of nude mice with EC, with the pcDNA-UCA1 + mimics-NC group by contrast, the tumor weight of nude mice with EC in the pcDNA-UCA1 + miR-498 mimics group was obviously reduced (P < 0.05) ().
Discussion
EC is 1 of the 10 most general malignant tumors in humans [Citation20]. Several reports have conveyed that miRNAs and lncRNAs were closely connected with EC. A prior study has noted that lncRNA XIST may be regarded as an oncogenic part in the progress of EC by sponging miR-494 for regulation of CDK6 expression [Citation21]. Another research has revealed that miR‑30a‑3p may employ as a potential tumor suppressor in EC, suppressing metastasis and enhancing radiosensitivity through declining IGF‑1R [Citation22]. This study was to research the influence of lncRNA UCA1 adsorbing miR-498 as a ceRNA for the regulation of ZEB2 expression on EMT, invasion and migration of EC cells. Collectively, the obtained outcomes performed that up-regulated miR-498 that was resulted from inhibited UCA1 expression could decrease ZEB2 expression, and restricted proliferation activity, migration, invasion and EMT of EC cells.
Our results suggested that there was highly expressed lncRNA UCA1 in EC, and there was a manifest correlation of TNM stage and appearing of LNM with UCA1 expression level. A possible explanation for this might be that lncRNA UCA1 as an oncogene promotes cell proliferation in a ceRNA manner in EC, and higher UCA1 expression in EC was connected with higher TNM stage and poor differentiation [Citation9]. The major finding of this work showed that down-regulated lncRNA UCA1 expression resulted in reducing cell colony formation, proliferation, migration, invasion ability, EMT, tumor growth rate and weight in nude mice. Knocking out of UCA1 repressed the cell viability, inhibited the cell proliferation and restrained the migration potential and overexpression of UCA1 promoted that in primary cystitis glandularis (pCGs) [Citation23]. There were, however, other articles indicated that lncRNA-UCA1 silence decreased cell viability, promoted apoptosis, while lowering the invasion and migration of glioblastoma cells by miR-193a-mediated silence of CDK6, with blockage of PI3K/AKT, MAPK, and Notch pathways [Citation7]; meanwhile, there were the suppressive effects of UCA1 down-regulation on melanoma cell migration and proliferation [Citation6]. All these evidences confirmed the essential role of UCA1 in the progression of EC.
In this current study, it has been performed that there was lowly expressed miR-498 in EC, and overexpressed miR-498 repressed cell proliferation, colony formation, invasion, migration ability, EMT, tumor growth rate and weight in nude mice. Accordingly, miR-498 was down-regulated in ESCC and its overexpression triggered various downstream effects such as inactivation of ESCC cell colony formation, invasion and cell proliferation in vitro [Citation24]. There was a strong evidence highlighting that down-regulated miR-498 has existed in both non-small cell lung cancer (NSCLC) tissues and cell lines, and overexpressed miR-498 promoted cellular invasion, proliferation, and migration of NSCLC [Citation25]. Collectively, our study also suggested that there was highly expressed ZEB2 in EC. Yoshida et al. demonstrated increased ZEB2 expression in OSCC tissues in comparison with normal esophageal epithelium [Citation16]. This was consonant with the fact that up-regulation of miR-200c and down-regulation of ZEB2 could promote the chemotherapeutic sensitivity of gastric cancer and chemotherapy-induced apoptosis [Citation26]. Furthermore, we have confirmed that lncRNA UCA1 could act as ceRNA to adsorb miR-498, and repress miR-498 expression in EC. It fitted well with the previously defined role that UCA1-overexpressing SHG44 cells performed a significant reduction in miR-204-5p in comparison with the vector control cells [Citation27]. The observation results were consistent that the functional impacts of lncRNA UCA1 silence on HMEC-1 cells growth, migration and tube formation were attenuated when miR-195 was suppressed [Citation28]. Our findings suggested that promotion miR-498 expression decreased ZEB2 expression in EC. In accordance with the present results, a previous study has demonstrated that miR-101 overexpression decreased the mRNA expression of ZEB2 in G292 and U2OS cells [Citation29]. Another research demonstrated that ZEB2 was predicted as a target of miR-206 [Citation30]. All these data suggest that lncRNA UCA1 could act as ceRNA to decrease miR-498 expression, thereby elevating ZEB2 expression.
In summary, our study concluded that downregulated lncRNA UCA1 could elevate miR-498 expression, thereby decreasing ZEB2 expression and inhibiting the proliferation, invasion, EMT and tumor growth of EC cells. This study provides a new method to further explore the pathogenesis of EC. The results of this paper can be further verified by expanding the sample size in the future.
Authors’ contributions
Guarantor of integrity of the entire study:Peng Wang, Xinfa Liu, Gaohua Han, Shengbin Dai.
Study concepts: Peng Wang, Xinfa Liu.
Study design: Peng Wang, Xinfa Liu, Gaohua Han, Shengbin Dai.
Experimental studies: Peng Wang, Xinfa Liu, Gaohua Han, Shengbin Dai, Qingtao Ni, Shujun Xiao, Junxing Huang.
Statistical analysis: Xinfa Liu, Gaohua Han, Shengbin Dai, Qingtao Ni.
Manuscript editing: Qingtao Ni, Shujun Xiao, Junxing Huang.
Ethical statement
The experiment was approved by Taizhou People’s Hospital.
Consent for publication
Not applicable
Acknowledgments
We would like to acknowledge the reviewers for their helpful comments on this paper.
Disclosure statement
No potential conflict of interest was reported by the authors.
Data availability statement
Research Data are not shared.
Additional information
Funding
References
- Mora A, Kawada K, Nakajima Y, et al. Mid- and long-term outcomes of endoscopic resection for submucosal esophageal cancer types pT1b-SM1 and pT1b-SM2. Endosc Int Open. 2019;7(6):E733–E742.
- Bharat A, Crabtree T. Management of advanced-stage operable esophageal cancer. Surg Clin North Am. 2012;92(5):1179–1197.
- Mao WM, Zheng WH, Ling ZQ. Epidemiologic risk factors for esophageal cancer development. Asian Pac J Cancer Prev. 2011;12(10):2461–2466.
- Ma DW, Cho Y, Jeon M-J, et al. Relationship between sarcopenia and prognosis in patient with concurrent chemo-radiation therapy for esophageal cancer. Front Oncol. 2019;9:366.
- Yoshida J, Ishikawa T, Doi T, et al. Clinical significance of soluble forms of immune checkpoint molecules in advanced esophageal cancer. Med Oncol. 2019;36(7):60.
- Han C, Tang F, Chen J, et al. Knockdown of lncRNA-UCA1 inhibits the proliferation and migration of melanoma cells through modulating the miR-28-5p/HOXB3 axis. Exp Ther Med. 2019;17(5):4294–4302.
- Xin H, Liu N, Xu X, et al. Knockdown of lncRNA-UCA1 inhibits cell viability and migration of human glioma cells by miR-193a-mediated downregulation of CDK6. J Cell Biochem. 2019.
- Horita K, Kurosaki H, Nakatake M, et al. lncRNA UCA1-mediated Cdc42 signaling promotes oncolytic vaccinia virus cell-to-cell spread in ovarian cancer. Mol Ther Oncolytics. 2019;13:35–48.
- Jiao C, Song Z, Chen J, et al. lncRNA-UCA1 enhances cell proliferation through functioning as a ceRNA of Sox4 in esophageal cancer. Oncol Rep. 2016;36(5):2960–2966.
- Kong L, Wu Q, Zhao L, et al. Upregulated lncRNA-UCA1 contributes to metastasis of bile duct carcinoma through regulation of miR-122/CLIC1 and activation of the ERK/MAPK signaling pathway. Cell Cycle. 2019;18(11):1212–1228.
- Han DL, Wang LL, Zhang GF, et al. MiRNA-485-5p, inhibits esophageal cancer cells proliferation and invasion by down-regulating O-linked N-acetylglucosamine transferase. Eur Rev Med Pharmacol Sci. 2019;23(7):2809–2816.
- Zhang X, Xu X, Ge G, et al. miR‑498 inhibits the growth and metastasis of liver cancer by targeting ZEB2. Oncol Rep. 2019;41(3):1638–1648.
- Liu R, Liu F, Li L, et al. MiR-498 regulated FOXO3 expression and inhibited the proliferation of human ovarian cancer cells. Biomed Pharmacother. 2015;72:52–57.
- Goossens S, Wang J, Tremblay C, et al. ZEB2 and LMO2 drive immature T-cell lymphoblastic leukemia via distinct oncogenic mechanisms. Haematologica. 2019.
- Zhu X, Wei L, Bai Y, et al. FoxC1 promotes epithelial-mesenchymal transition through PBX1 dependent transactivation of ZEB2 in esophageal cancer. Am J Cancer Res. 2017;7(8):1642–1653.
- Huo X, Huo B, Wang H, et al. Prognostic significance of the epithelial-mesenchymal transition factor zinc finger E-box-binding homeobox 2 in esophageal squamous cell carcinoma. Oncol Lett. 2017;14(3):2683–2690.
- Stahl M, Budach W, Meyer H-J, et al. Esophageal cancer: clinical practice guidelines for diagnosis, treatment and follow-up. Ann Oncol. 2010;21(Suppl 5):v46–9.
- Zhong H, De Marzo AM, Laughner E, et al. Overexpression of hypoxia-inducible factor 1alpha in common human cancers and their metastases. Cancer Res. 1999;59(22):5830–5835.
- Ayuk SM, Abrahamse H, Houreld NN. The role of photobiomodulation on gene expression of cell adhesion molecules in diabetic wounded fibroblasts in vitro. J Photochem Photobiol B. 2016;161:368–374.
- Hu S, Zang R, Wang Y, et al. Highly expressed microRNA-124 inhibits migration and promotes apoptosis of esophageal cancer cells by degrading PDCD6. J Buon. 2019;24(2):805–812.
- Chen Z, Hu X, Wu Y, et al. Long non-coding RNA XIST promotes the development of esophageal cancer by sponging miR-494 to regulate CDK6 expression. Biomed Pharmacother. 2019;109:2228–2236.
- Fan Y, Bian X, Qian P, et al. miRNA30a3p inhibits metastasis and enhances radiosensitivity in esophageal carcinoma by targeting insulinlike growth factor 1 receptor. Mol Med Rep. 2019;20(1):81–94.
- Zhou X, Cui Y, Chen J, et al. UCA1 promotes cell viability, proliferation and migration potential through UCA1/miR-204/CCND2 pathway in primary cystitis glandularis cells. Biomed Pharmacother. 2019;114:108872.
- Islam F, Gopalan V, Law S, et al. MiR-498 in esophageal squamous cell carcinoma: clinicopathological impacts and functional interactions. Hum Pathol. 2017;62:141–151.
- Gao N, Wang F X, Wang G, et al. Targeting the HMGA2 oncogene by miR-498 inhibits non-small cell lung cancer biological behaviors. Eur Rev Med Pharmacol Sci. 2018;22(6):1693–1699.
- Jiang T, Dong P, Li L, et al. MicroRNA-200c regulates cisplatin resistance by targeting ZEB2 in human gastric cancer cells. Oncol Rep. 2017;38(1):151–158.
- Liang C, Yang Y, Guan J, et al. LncRNA UCA1 sponges miR-204-5p to promote migration, invasion and epithelial-mesenchymal transition of glioma cells via upregulation of ZEB1. Pathol Res Pract. 2018;214(9):1474–1481.
- Yin D, Fu C, Sun D. Silence of lncRNA UCA1 represses the growth and tube formation of human microvascular endothelial cells through miR-195. Cell Physiol Biochem. 2018;49(4):1499–1511.
- Lin H, Zheng X, Lu T, et al. The proliferation and invasion of osteosarcoma are inhibited by miR-101 via targetting ZEB2. Biosci Rep. 2019;39(2). doi:10.1042/BSR20181283
- Chen ZL, Liu J Y, Wang F, et al. Suppression of MALAT1 ameliorates chronic constriction injury-induced neuropathic pain in rats via modulating miR-206 and ZEB2. J Cell Physiol. 2019;1–7.