
ABSTRACT
Multiple myeloma (MM) is a plasma cells malignant proliferative disease, especially in aged people. LncRNAs have been considered as important regulators in MM. This research was to study the effect of LncRNA MALAT1 on the proliferation and adhesion of myeloma cells and whether Long non-coding RNAs MALAT1(LncRNA MALAT1) plays its regulative role through Hippo-YAP signaling pathway by targeting miR-181a-5p. Reverse transcription-quantitative polymerase chain reaction (RT-qPCR) analysis was used to detect the LncRNA MALAT1/miR-181a-5p expression and improve the transfection efficiency. Western blot analysis was used to analyze the expression of proliferation and apoptosis related proteins and Hippo-Yes-associated protein (YAP) signaling pathway related proteins. Cell proliferative ability and cell apoptosis were respectively determined by Cell Counting Kit-8 (CCK-8) assay and flow cytometry analysis. ELISA assay was for the determination of adherence factors. Immunohistochemistry was to detect the expression of proliferation and adhesion related proteins. LncRNA MALAT1 targeting gene was determined by Dual-luciferase reporter assay. LncRNA MALAT1 was increased in MM cells and LncRNA MALAT1 interference could inhibit cell proliferation and promote cell apoptosis with the changes in the related proteins. Also, LncRNA MALAT1 interference could inhibit cell adhesion through Hippo-YAP signaling pathway. MiR-181a-5p was demonstrated to be a target of LncRNA MALAT1 and miR-181a-5p overexpression could also regulate the changes in cellular behavior in accordance with the LncRNA MALAT1 interference. In addition, LncRNA MALAT1 interference could decrease the expression of miR-181a-5p and inhibit the growth of tumor. In conclusion, this study showed that LncRNA MALAT1 interference inhibited the proliferation and adhesion of myeloma cells by the up-regulation of miR-181a-5p through activating the Hippo-YAP signaling pathway.
Introduction
Multiple myeloma (MM) is a kind of malignant blood disease, characterized by abnormal clone proliferation of plasma cells in bone marrow. The plasma cells secrete large amounts of monoclonal immunoglobulin or its pieces, which causes damage to tissues or organs, such as kidneys or bones [Citation1]. The incidence rate of MM accounts for about 10% of all malignant blood diseases, and it tends to occur in the elderly. With the progress of China’s aging population, the number of MM patients tends to increase [Citation2].
Cell adhesion molecules play an important role in many physiological and pathological processes, including the development of tumor. Study reported that various adhesion molecules on the myeloma cells were combined with bone marrow stromal cells and corresponding ligands in extracellular matrix cells (ECM) which formed the molecular basis of tumor cell anchor-dependent growth. In addition, the network constituted by bone marrow stromal cells and ECM provided an appropriate microenvironment for tumor cell growth. A series of adhesion molecules expressed by MM cells enabled myeloma cells selectively to adhere which provided physical and cytokine support for tumor cells proliferation [Citation3,Citation4]. Therefore, it is particularly important to inhibit the expression of cell adhesion molecules.
Long non-coding RNAs (LncRNAs) which the length was more than 200 nucleotides have been recently reported to be linked to the development and progression of carcinomas [Citation5–Citation7]. In multiple myeloma cells, LncRNA MALAT1 targeting miR-509-5p could regulate the expression of Forkhead box protein P1 (FOXP1) to promote the development of MM [Citation8]. Studies have shown that LncRNA MALAT1 overexpression in plasma of MM patients has been demonstrated to be related to poor prognosis of MM patients [Citation9,Citation10]. However, the mechanism of LncRNA MALAT1 in myeloma cell adhesion has not been explored.
Hippo signaling pathway is a signal transduction pathway that can regulate cell proliferation and apoptosis, and YAP (Yes-associated protein) is its main effector molecule. YAP is a candidate oncogenic factor, and the abnormality of Hippo-YAP pathway is closely related to the occurrence and development of various tumors [Citation11–Citation13]. Hippo signaling pathway is now extended to the study of the regulation of factors affecting cell adhesion and polarity changes [Citation14]. Therefore, the therapeutic strategy targeting Hippo-YAP pathway may provide new ideas for tumor treatment.
MiR-181 regulates the cell growth, invasion and cell apoptosis in a variety of tumor types, such as breast cancer, gastric cancer, hepatic cancer and glioma [Citation15–Citation18]. However, what the role of miR-181 in MM has not been studied.
Therefore, this study aims to explore the effect of LncRNA MALAT1 on the proliferation and adhesion of MM cells, and to explore whether LncRNA MALAT1 is involved in the proliferation and adhesion of MM cells through the Hippo-YAP signaling pathway.
Materials and methods
Cell culture
Human bone marrow stromal cell lines HS-5, and Human myeloma cell lines U266, MM.1S, RPMI8226 were purchased from the American Type Culture Collection (ATCC). Cells were cultured in Dulbecco’s modified Eagle’s medium (DMEM) (Gibco, Grand Island, NY, USA) containing 10% fetal bovine serum (FBS) (Hyclone, Australia) and 1% antibiotic-antimycotic solution at 37°C in a humidified incubator with 5% CO2.
LncRNA MALAT1 interference plasmid construction and transfection
One day before transfection, cells were seeded into 60 mm DMEM until the abundance values reached to 60%–80%. Then, the diluted plasmids and diluted Lipofectamine® 2000 reagent (Invitrogen; Thermo Fisher Scientific, Inc., Waltham, MA, USA) were mixed. At the same time, cells were washed by polybutylene succinate (PBS) and added into 3000 μL DMEM without FBS. The transfection complex was directly added to the above DMEM, which were gently swayed and placed into incubator. Finally, transfected cells with sh-MALAT1-1, sh-MALAT1-2, and sh-RNA plasmids were obtained. The cells with no any treatments were the control group.
Cell transfection
The cells were cultured in DMEM in a humid incubator at 37°C with 5% CO2 and reseeded into 12-well plates. MiR-181a-5p mimic, mimic control (NC) and miR-181a-5p mimic+MALAT1 were transfected into cells with Lipofectamine® 2000 reagent (Invitrogen; Thermo Fisher Scientific, Inc.). The cells of control group were received not any treatments. Reverse transcription-quantitative polymerase chain reaction (RT-qPCR) was detecting the transfected levels of miR-129-5p.
RT-qPCR analysis
Total RNA was extracted with TRIzol reagent (Invitrogen; Thermo Fisher Scientific, Inc.). cDNA was produced with 2 μg of total RNA using a PrimeScript Reverse Transcription Reagent kit (Takara Biotechnology Co., Ltd., Beijing, China). RT-qPCR was performed with the SYBR ExScript qRT-PCR Kit (Takara, China). The relative expression levels of miRNA was normalized to U6 expression and calculated with 2−ΔΔCq method. The primer sequences for qPCR were as follows: U6 forward, 5ʹ-CTCGCTTCGGCAGCACA-3ʹ, and reverse, 5ʹ-AACGCTTCACGAATTTGCGT-3ʹ; LNCRNA MALAT1 forward, 5ʹ-AAAGCAAGGTCTCCCCACAAG-3ʹ, and reverse, 5ʹ-GGTCTGTGCTAGATC-3ʹ; miR-181a-5p forward 5ʹ-ACACTCCAGCTGGGAACATTCAACGCTGTCGG-3ʹ, and reverse, 5ʹ-TGGTGTCGTGGAGTCG-3ʹ.
Western blot analysis
After transfection, the cells were obtained and washed with PBS three times. Then, total proteins in cells were extracted with a RIPA buffer (Biocolors Biotechnology Co., Shanghai, China). BCA Protein Assay Kit (Pierce; Thermo Fisher Scientific, Inc.) was used to detect the concentration of total proteins. Subsequently, 50 μg proteins per lane was separated on 12% SDS-PAGE gels and absorbed into polyvinylidene fluoride (PVDF) membranes (Merck Millipore, Billerica, MA, USA). 0.5% Tween 20 was used to block the nonspecific binding sites and then incubated with primary antibody against LNCRNA MALAT1 (ab57030; Abcam; dilution, 1:1000), Cyclin-dependent kinase-2 (CDK2) (#2546; Cell Signaling Technology, Inc.; dilution, 1:1000), cyclinE1 (#20808; Cell Signaling Technology, Inc.; dilution, 1:1000), P21 (#2947; Cell Signaling Technology, Inc.; dilution, 1:1000), B-cell lymphoma-2 (Bcl-2) (#4223; Cell Signaling Technology, Inc.; dilution, 1:1000), Bax (#5023; Cell Signaling Technology, Inc.; dilution, 1:1000), cleaved caspase3 (#9664; Cell Signaling Technology, Inc.; dilution, 1:1000), MST1 (#14946; Cell Signaling Technology, Inc.; dilution, 1:1000), LATS1 (#3477; Cell Signaling Technology, Inc.; dilution, 1:1000), Yes-associated protein 1 (YAP1) (#14074; Cell Signaling Technology, Inc.; dilution, 1:1000) and GAPDH (#5174; Cell Signaling Technology, Inc.; dilution, 1:1000). The membranes were washed with PBS three times and incubated with anti-rabbit horseradish peroxidase-linked IgG secondary antibody (Cell Signaling Technology, Inc.) for 2–3 h at room temperature on a shaker. The electrochemiluminescence kit (Roche Diagnostics) was to observe the protein bands, which the intensity was analyzed by the ImageJ software (National Institutes of Health, Bethesda, MD).
Cell counting Kit-8 (CCK-8) assay
After transfection, the proliferation of myeloma cells was detected by the CCK8 (Dojindo Molecular Technologies, Shanghai, China) assay. The myeloma cells were planted into a 96-well plate and cultured at 37°C and 5% CO2. The supernatant of each well was discarded and 10 μl CCK8 solution was added into each well for another culture of 4 h. With the examination of a Model 680 Microplate Reader (Bio-Rad Laboratories, Inc., Hercules, CA), the absorbance value of each well was detected at 450 nm.
Flow cytometry analysis
After transfection, cells were washed by PBS three times and digested by 200 μL pancreatic enzymes. The pancreatic enzymes were soaked up and PBS containing 20% fetal calf serum was added to terminate the digestion. After centrifugation, 490 μL precooled binding buffer was used to resuspend to obtain the cell suspension. 5 µL Annexin V-FITC and 5 µL propidium iodide (PI) were added to stain the cells at 4°C n the dark for 15 min. The apoptosis rate of cells was analyzed by flow cytometry within 1 h.
Enzyme-linked immuno sorbent assay (ELISA) assay
Interleukin-1 (IL-1), tumor necrosis factor-alpha (TNFα), Interferon gamma (IFNγ), Mucin 1 (Muc-1), Intercellular Adhesion Molecule 1 (ICAM-1), and vascular cell adhesion molecule-1 (VCAM-1) in myeloma cells were evaluated by commercially available ELISA kits (Boster, China). The results were calculated according to the standard curves using standard proteins.
Dual-luciferase reporter assay
The targeted miRNA of lncRNA MALAT1 was predicted by http://starbase.sysu.edu.cn/index.php. Cells were co-transfected with luciferase reporters and miR-181a-5p mimics or controls using Lipofectamine 2000. After incubation for 48 h, luciferase activity was determined with a Dual Luciferase Assay Kit (Promega) under the Dual-Luciferase Reporter Assay System (E1910, Promega).
Immunohistochemistry
The paraffin-embedded tumor tissues were cut into pieces of which thickness was 5 μm and transferred onto glass slides. The paraffin sections were treated according to the Immunohistochemical Kit and immunohistochemical staining procedure was detailed in a previous study [Citation19]. The primary antibodies were Ki-67, muc-1, ICAM-1, VCAM-1, MST1, LATS1, YAP1 (Abcam, USA), and Biotin-labeled Goat Anti-Rabbit IgG H&L (Abcam, USA) was the second antibody.
Xenograft model in vivo
The male nude mice incubated for 6–8 wk were divided into three groups randomly (n = 4), including sh-MALAT1 group, sh-RNA group and control group. 1 × 10⁶ cells/100 μL were transplanted subcutaneously into right side of the mice. The tumor growth was observed at 1th, 5th, 10th, 15th, and 20th day, and tumor size was measured and calculated by the formula V = (L× W2)/2. Twelve mice were killed and tumors were stripped which the wet weight was weighed.
Statistical analysis
The experimental data were expressed as the form of mean ± standard deviation (SD). Statistical analysis and figure making were performed with SPSS 22.0 and GraphPad Prism 5 software. Student’s t-test was used for comparisons between groups, while one-way analysis of variance was used for comparisons between multiple groups. P < 0.05 was perceived as statistically significant.
Results
LncRNA MALAT1 is increased in myeloma cells
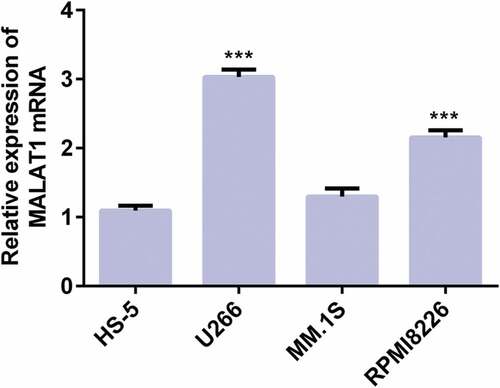
The LncRNA MALAT1 expression in myeloma cells was detected by RT-qPCR analysis. As shown in , LncRNA MALAT1 expression in U266, MM.1S, and RPMI8226 were increased compared with HS-5 and LncRNA MALAT1 expression was highest in U266. Therefore, U266 was chosen for the subsequent experiment.
Figure 1. The MALAT1 mRNA expression in HS-5, U266, MM.1S and RPMI8226 cells analyzed by RT-qPCR. ***P < 0.001 vs. HS-5 cells
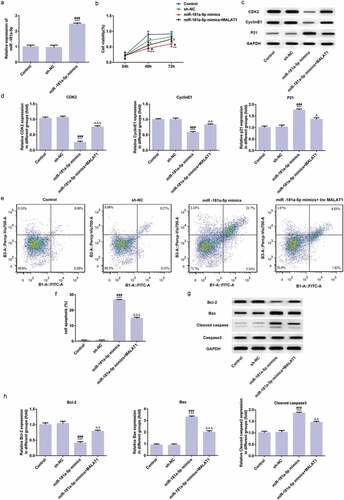
LncRNA MALAT1 interference inhibits proliferation and promotes apoptosis of myeloma cells
The RT-qPCR analysis and western blot analysis were used to verify the transfection effects. As shown in ), compared with control group and sh-RNA group, mRNA expression level and protein expression level of LncRNA MALAT1 were all decreased and sh-MALAT1-1 transfected cells expressed lower LncRNA MALAT1 than sh-MALAT1-2 transfected cells. Therefore, sh-MALAT1-1 transfected cells were chosen for the subsequent experiment. Compared with control group and sh-RNA group, CCK-8 assay displayed that cell proliferation was suppressed in sh-MALAT1-1 group ()) and Western blot analysis displayed that expression of CDK2 and cyclinE1 was increased while P21 expression was decreased in sh-MALAT1-1 group ()).
Figure 2. LncRNA MALAT1 interference inhibits proliferation and promotes apoptosis of myeloma cells. (A) The transfection effect was assessed by RT-qPCR. ***P < 0.001 vs. control group. ###P < 0.001 vs. sh-NC group. (B) The transfection effect was assessed by western blot. *P < 0.05 and ***P < 0.001 vs. control group. #P < 0.05 and ###P < 0.001 vs. sh-NC group. (C) The effect of LncRNA MALAT1 interference on cell proliferation was determined by CCK-8 assay. **P < 0.01 and ***P < 0.001 vs. control group. #P < 0.05 vs. sh-NC group. (D) The proliferation related proteins (CDK2, cyclinE1, and P21) were detected by Western blot. **P < 0.01 and ***P < 0.001 vs. control group. ##P < 0.01 and ###P < 0.001 vs. sh-NC group. (E/F) The cell apoptosis rate was determined by flow cytometry analysis. ***P < 0.001 vs. control group. ###P < 0.001 vs. sh-NC group. (G) The apoptosis related proteins (Bcl-2, Bax, and cleaved caspase3) were detected by Western blot. **P < 0.01 and ***P < 0.001 vs. control group. ##P < 0.01 and ###P < 0.001 vs. sh-NC group
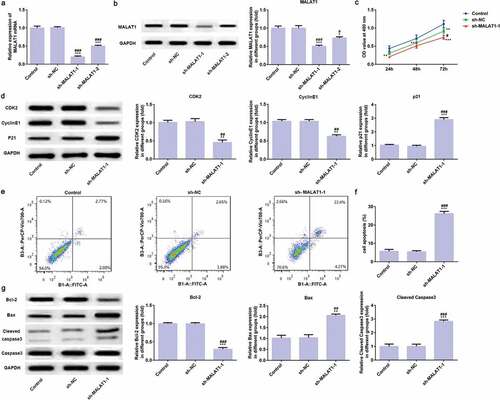
Compared with control group and sh-RNA group, the results of flow cytometry analysis showed that cell apoptosis was increased () and Western blot analysis showed that Bcl-2 expression was increased while Bax and cleaved caspase3 were decreased in sh-MALAT1-1 group ()). These data suggest that LncRNA MALAT1 interference inhibits proliferation and promotes apoptosis of myeloma cells.
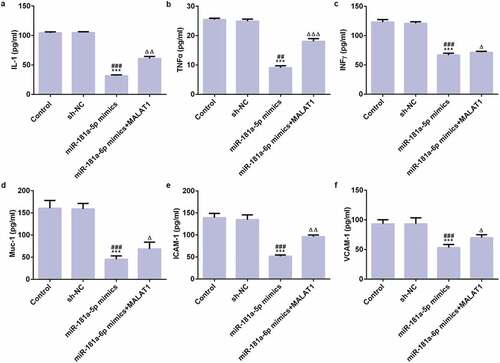
LncRNA MALAT1 interference inhibits adhesion of myeloma cells
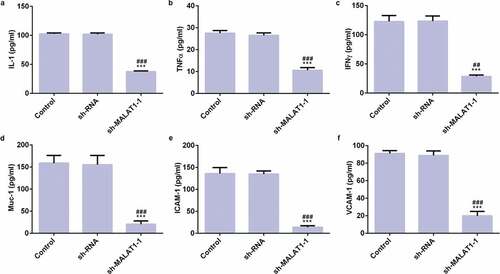
ELISA assay was used to detect the expression of inflammatory factors and adhesion factors. As shown in , compared with control group and sh-RNA group, the expression levels of IL-1, TNFα, IFNγ and Muc-1, ICAM-1, VCAM-1 were all decreased in sh-MALAT1-1 group. These data reveal that LncRNA MALAT1 interference inhibits adhesion of myeloma cells.
Figure 3. LncRNA MALAT1 interference inhibits adhesion of myeloma cells. The ELISA was used to detect the expression levels of IL-1 (a), TNFα (b), IFNγ (c), and Muc-1 (d), ICAM-1 (e), and VCAM-1 (f). ***P < 0.001 vs. control group. ##P < 0.01 and ###P < 0.001 vs. sh-NC group
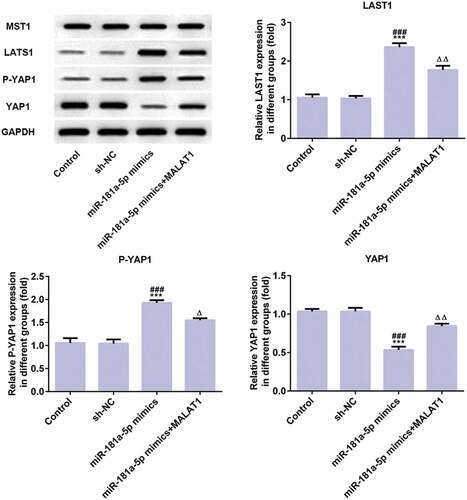
LncRNA MALAT1 interference inhibits proliferation and adhesion of myeloma cells through Hippo-YAP signaling pathway
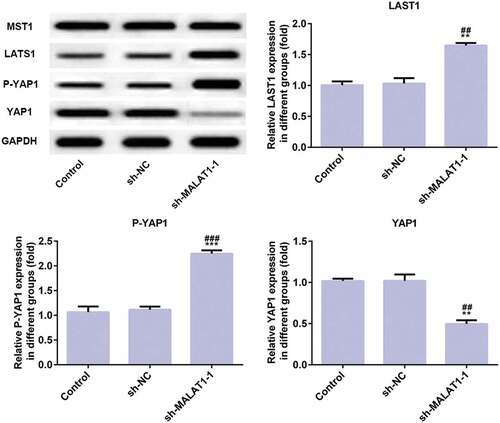
As shown in , compared with control group and sh-RNA group, LATS1 expression and P-YAP1 expression were increased while YAP1 expression was decreased and MST1 expression was not changed in sh-MALAT1-1 group. The results indicate that LncRNA MALAT1 interference inhibits proliferation and adhesion of myeloma cells by regulating Hippo-YAP signaling pathway.
Figure 4. LncRNA MALAT1 interference inhibits proliferation and adhesion of myeloma cells through Hippo-YAP signaling pathway. The proteins (MST1, LATS1, P-YAP1, and YAP1) related to Hippo-YAP signaling pathway were detected by western blot. **P < 0.01 and ***P < 0.001 vs. control group. ##P < 0.01 and ###P < 0.001 vs. sh-NC group
LncRNA MALAT1 directly targets miR-181a-5p
Bioinformatics analysis predicted the potential target gene of LncRNA MALAT1 and results demonstrated that miR-181a-5p is a downstream target gene of LncRNA MALAT1 ()). Dual-luciferase reporter assay was used to improve the prediction. As shown in ), transfection of MALAT1 wild-type and miR-181a-5p mimics reduced the fluorescence activity, indicating that MALAT1 and miR-181a-5p have binding sites. In addition, compared with control group and sh-RNA group, miR-181a-5p was overexpressed in sh-MALAT1-1 group ()).
Figure 5. LncRNA MALAT1 directly targets miR-181a-5p. (a) Interaction between miR-181a-5p and 3ʹUTR of MALAT1 was predicted by starBase. (b) Luciferase activity of a reporter containing MALAT1 3ʹUTR-WT or 3ʹUTR-MUT (with a mutation in the miR-181a-5p binding site). ***P < 0.001 vs. control group. (c) The miR-181a-5p expression was upregulated in myeloma cells transfected with sh-MALAT1. ***P < 0.001 vs. control group. ###P < 0.001 vs. sh-NC group. (d) The miR-181a-5p expression in myeloma cells was detected by RT-qPCR. **P < 0.01 and ***P < 0.001 vs. HS-5 group
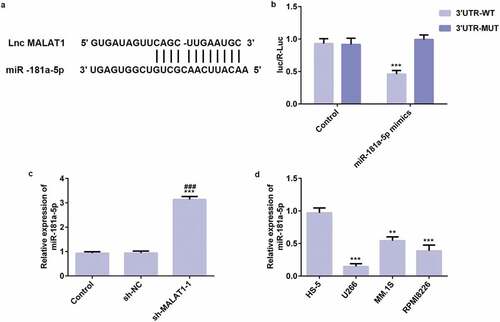
MiR-181a-5p is decreased in myeloma cells
The miR-181a-5p expression in myeloma cells was detected by RT-qPCR analysis. As shown in ), compared with HS-5, miR-181a-5p expression in U266, MM.1S, and RPMI8226 were decreased. U266 cells with the lowest miR-181a-5p expression were selected for the following experiment.
MiR-181a-5p overexpression inhibits proliferation and promotes apoptosis of myeloma cells
As shown in ), RT-qPCR analysis indicated that miR-181a-5p in cells transfected with miR-181a-5p mimics expressed higher than control group and NC group. CCK-8 assay was used to detect the viability of cells and the data indicated that miR-181a-5p overexpression decreased the cell viability and cell viability was improved in miR-181a-5p mimics+MALAT1 group which the cell viability was still under the cell viability in control group and NC group ()). The proliferation related proteins were determined by western blot analysis and expression of CDK2 and cyclinE1 were decreased and P21 expression was increased compared with control group and NC group while expression of CDK2 and cyclinE1 were risen and P21 expression was decreased compared with miR-181a-5p mimics group ()). As shown in ), flow cytometry analysis showed that cell apoptosis in miR-181a-5p mimics group was increased compared with control group and NC group while cell apoptosis was lower in miR-181a-5p mimics+MALAT1 group than that in miR-181a-5p mimics group but still higher than control group and NC group. And, expression of apoptosis-related proteins detected by Western blot analysis indicated that Bcl-2 expression was decreased while expression of Bax and cleaved caspase3 were increased compared with control group and NC group while Bcl-2 expression was risen and expression of Bax and cleaved caspase3 was decreased in miR-181a-5p mimics+MALAT1 group compared with miR-181a-5p mimics group (). The above findings indicate that miR-181a-5p overexpression inhibits proliferation and promotes apoptosis of myeloma cells.
Figure 6. MiR-181a-5p overexpression inhibits proliferation and promotes apoptosis of myeloma cells. (a) The transfection effect was assessed by RT-qPCR. ***P < 0.001 vs. control group. ###P < 0.001 vs. sh-NC group. (b) The effect of miR-181a-5p overexpression on cell proliferation was determined by CCK-8 assay. *P < 0.05 and **P < 0.01 and ***P < 0.001 vs. control group. #P < 0.05 vs. sh-NC group. ∆P < 0.05 vs. miR-181a-5p mimics group. (c/d) The proliferation related proteins (CDK2, cyclinE1, and P21) were detected by Western blot. ***P < 0.001 vs. control group. ###P < 0.001 vs. sh-NC group. ∆P < 0.05 vs. miR-181a-5p mimics group. ∆∆P < 0.01 and ∆∆∆P < 0.001 vs. miR-181a-5p mimics group. (e/f) The cell apoptosis rate was determined by flow cytometry analysis. ***P < 0.001 vs. control group. ###P < 0.001 vs. sh-NC group. ∆∆∆P < 0.001 vs. miR-181a-5p mimics group. (g/h) The apoptosis related proteins (Bcl-2, Bax, and cleaved caspase3) were detected by Western blot. ***P < 0.001 vs. control group. ###P < 0.001 vs. sh-NC group. ∆∆P < 0.01 and ∆∆∆P < 0.001 vs. miR-181a-5p mimics group
MiR-181a-5p overexpression inhibits adhesion of myeloma cells
As shown in , the results of ELISA assay showed that expression of IL-1, TNFα, IFNγ and Muc-1, ICAM-1, VCAM-1 were all decreased in miR-181a-5p mimics group compared with control group and NC group while expression of those inflammatory factors and adhesion factors were risen in miR-181a-5p mimics+MALAT1 group but still lower than control group and NC group. These data suggest that miR-181a-5p overexpression inhibits adhesion of myeloma cells.
Figure 7. MiR-181a-5p overexpression inhibits adhesion of myeloma cells. The ELISA was used to detect the expression levels of IL-1 (a), TNFα (b), IFNγ (c), and Muc-1 (d), ICAM-1 (e), and VCAM-1 (f). ***P < 0.001 vs. control group. ##P < 0.01 and ###P < 0.001 vs. sh-NC group. ∆P < 0.05, ∆∆P < 0.01, and ∆∆∆P < 0.001 vs. miR-181a-5p mimics group
MiR-181a-5p overexpression inhibits proliferation and adhesion of myeloma cells through Hippo-YAP signaling pathway.
As shown in , expression of LATS1 and P-YAP1 was upregulated and YAP1 expression was downregulated in miR-181a-5p mimics group compared with control group and NC group while expression of LATS1 and P-YAP1 was decreased and YAP1 expression was risen in miR-181a-5p mimics+MALAT1 group. MST1 expressions in all groups were not changed. Above all, miR-181a-5p overexpression affects the Hippo-YAP signaling pathway to inhibit proliferation and adhesion of myeloma cells.
Figure 8. MiR-181a-5p overexpression inhibits proliferation and adhesion of myeloma cells through Hippo-YAP signaling pathway. The proteins (MST1, LATS1, P-YAP1, and YAP1) related to Hippo-YAP signaling pathway were detected by western blot. ***P < 0.001 vs. control group. ###P < 0.001 vs. sh-NC group. ∆P < 0.05 and ∆∆P < 0.01 vs. miR-181a-5p mimics group
LncRNA MALAT1 interference inhibits tumor growth
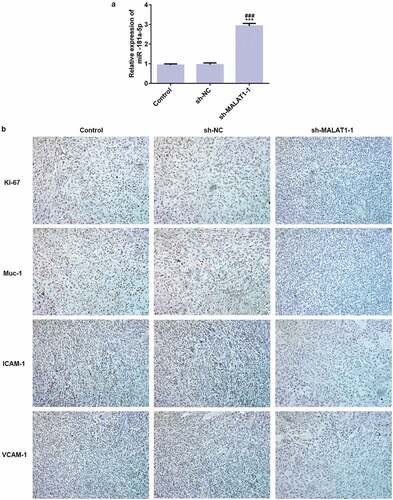
The phenotypes of tumors in vitro and in vivo were showed in ) and . As shown in ), tumor volume was gradually decreased from 1th to 20th Day in three groups and tumor volume in sh-MALAT1-1 group was smaller than control group and sh-RNA group from 1th to 20th Day. Accordingly, the weight of tumor was lower than control group and sh-RNA group ()). In addition, the miR-181a-5p expression in sh-MALAT1-1 group was higher than control group and sh-RNA group ()). Immunohistochemistry analyzed the expression of proliferation related protein (Ki-67) and adhesion related proteins (Muc-1, ICAM-1 and VCAM-1) and results indicated that expression of those proteins were all downregulated in sh-MALAT1-1 group compared with control group and sh-RNA group ()). Therefore, LncRNA MALAT1 interference inhibits the growth of tumor with the downregulated expression of proliferation-related protein and adhesion-related proteins in vivo.
Figure 9. LncRNA MALAT1 interference inhibits tumor growth. (a) The phenotypes of tumors in vitro. (b) The phenotypes of tumors in vivo. (c) The tumor growth curve according to tumor volume. *P < 0.05 vs. control group. (d) The tumor growth curve according to tumor weight. ***P < 0.001 vs. control group. ###P < 0.001 vs. sh-NC group
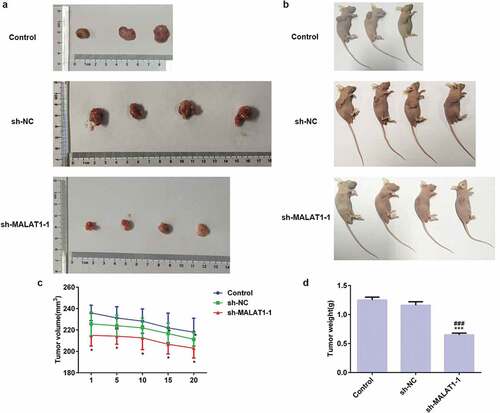
Figure 10. LncRNA MALAT1 interference inhibits the expression of proliferation and adhesion related proteins. (a) The expression of miR-181a-5p in tumor after transfection. ***P < 0.001 vs. control group. ###P < 0.001 vs. sh-NC group. (b) The expression of proliferation (Ki-67) and adhesion (Muc-1, ICAM-1, and VCAM-1) related proteins was detected by immunohistochemistry
LncRNA MALAT1 interference inhibits tumor growth through Hippo-YAP signaling pathway
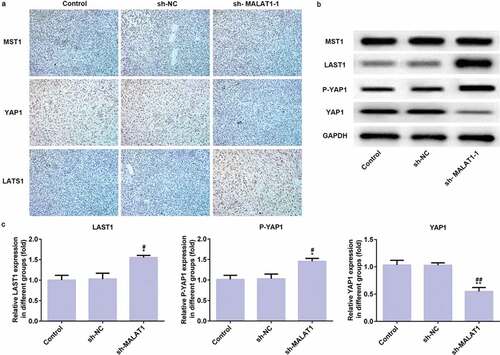
Immunohistochemistry data showed that MST1 expression was not changed in three groups and YAP1 expression was increased in sh-MALAT1-1 group compared with control group and sh-RNA group while LAST1 expression was increased in sh-MALAT1-1 group compared with control group and sh-RNA group ()). And, the results of expression of MST1, YAP1, and LAST1 in western blot were consistent with the previous results in immunohistochemistry. And, P-YAP1 was expressed higher in sh-MALAT1-1 group compared with control group and sh-RNA group (). Therefore, LncRNA MALAT1 interference affects Hippo-YAP signaling pathway in vivo to suppress tumor growth.
Figure 11. LncRNA MALAT1 interference inhibits tumor growth through Hippo-YAP signaling pathway. (a) The proteins (MST1, LATS1, and YAP1) related to Hippo-YAP signaling pathway were detected by immunohistochemistry. (b/c) The proteins (MST1, LATS1, P-YAP1, and YAP1) related to Hippo-YAP signaling pathway were detected by western blot. *P < 0.05 and **P < 0.01 vs. control group. #P < 0.05 and ##P < 0.01 vs. sh-NC group
Discussion
In the present study, the main findings showed that LncRNA MALAT1 expression and miR-181a-5p expression in myeloma cells were overexpressed. LncRNA MALAT1 interference or miR-181a-5p overexpression play suppressive role in the proliferation and adhesion of myeloma cells, which was also demonstrated in vivo experiment. In addition, Hippo-YAP signaling pathway was involved in the progression of LncRNA MALAT1/miR-181a-5p affecting the proliferation and adhesion of myeloma cells.
Currently, many existing studies indicated that LncRNA/miRNA was involved in the development of various cancers, which could be relieved by changing the expression of LncRNA/miRNA [Citation20–Citation23]. Xu et al. [Citation24] found that MALAT1 could facilitate colorectal cancer cell proliferation and suppress cell apoptosis by downregulating miR-145 and upregulating SOX9. MALAT1 was upregulated in tumor tissues and ovarian cancer cells and could induce the proliferation and metastasis of ovarian cancer cells via the PI3K-AKT pathway [Citation25]. MiR-181a-5p was reported downregulated in the cell cycle in prostate cancer and miR-181a-5p silence could inhibit proliferation and the cell cycle [Citation26]. The overexpression of miR-181a-5p enhanced cell proliferation and invasion and inhibited apoptosis of cervical cancer cells by negatively targeting INPP5A [Citation27]. Therefore, we speculated that LncRNA MALAT1 and miR-181a-5p maybe also could inhibit the proliferation of myeloma cells.
MM cells express a series of adhesion molecules, which enable myeloma cells to selectively adhere and return to the homing matrix, providing physical and cytokine support for tumor cell proliferation. Therefore, it is particularly important to suppress cell adhesion by inhibiting the expression of cell adhesion molecules. Studies have indicated that LncRNA/miRNA could regulate the cell adhesion in many cancers [Citation28–Citation31]. In summary, whether LncRNA MALAT1 and miR-181a-5p could inhibit the cell adhesion of myeloma cells remains unknown. Therefore, the aim of the present study was to explore the role of LncRNA MALAT1 and miR-181a-5p in proliferation and adhesion of MM cells. Here, the results of our study indicated that LncRNA MALAT1 was overexpressed in myeloma cells, which was consistent with LncRNA MALAT1 expression in other cancers [Citation32,Citation33]. In addition, downregulation of LncRNA MALAT1 could inhibit the proliferation and adhesion of MM cells by upregulating the expression of miR-181a-5p.
Hippo-YAP signaling pathway has been reported to be related to the proliferation, invasion and apoptosis in many cancers [Citation34–Citation36]. YAP overexpression efficiently promoted cell growth in epithelial ovarian cancer cells [Citation37]. Liu et al. [Citation38] found that knockdown of LINC00662 suppressed the Hippo-YAP1 signaling pathway in GC cells which leaded to the inhibition of cell growth. MAC30 knockdown activated the Hippo signaling pathway to promote the cell apoptosis in breast cancer [Citation39]. Therefore, Hippo signaling pathway was involved in the proliferation and apoptosis in cancer, which could be also involved in the proliferation in myeloma cells. In this study, we investigated the role of Hippo signaling pathway in myeloma cells and found that LncRNA MALAT1 and miR-181a-5p inhibited the cell proliferation and adhesion via regulation of Hippo signaling pathway.
In conclusion, our results revealed that inhibition effect of LncRNA MALAT1 interference by the downregulation of miR-181a-5p on the proliferation and adhesion of myeloma cells via the activation of Hippo-YAP signaling pathway. Our finding provides new insight into the effective treatment for MM with targeted gene therapy. However, there still exist limitations in this study. The results of this study is depending on a single cell line and further study more cell lines will be used. In addition, animal experiments will be used to verify these results in this study. The present study can provide the basis for the further experiment.
Disclosure statement
No potential conflict of interest was reported by the authors.
Related Research Data
References
- Yang Q, Shen XJ, Su ZY, et al. Emerging roles of noncoding RNAs in multiple myeloma: A review. J Cell Physiol. 2019;234(6):7957–7969.
- Ludwig H, Miguel JS, Dimopoulos MA et al. International Myeloma Working Group recommendations for global myeloma care. Leukemia. 2014;28(5):981–992.
- Cultrara CN, Kozuch SD, Ramasundaram P, et al. GRP78 modulates cell adhesion markers in prostate cancer and multiple myeloma cell lines. Bmc Cancer. 2018;18:1–14.
- Redondo-Munoz J, Garcia-Pardo A, Teixido J. Molecular players in hematologic tumor cell trafficking. Front Immunol. 2019;10:1–18.
- Wang QY, Lu GP, Chen ZY. MALAT1 promoted cell proliferation and migration via MALAT1/miR-155/MEF2A pathway in hypoxia of cardiac stem cells. J Cell Biochem. 2019;120(4):6384–6394.
- Zheng LH, Zhang YH, Fu YJ, et al. Long non-coding RNA MALAT1 regulates BLCAP mRNA expression through binding to miR-339-5p and promotes poor prognosis in breast cancer. Biosci Rep. 2019;39.
- Zhang Y, Wu J, Jing H, et al. Long noncoding RNA MEG3 inhibits breast cancer growth via upregulating endoplasmic reticulum stress and activating NF-kappa B and p53. J Cell Biochem. 2019;120(4):6789–6797.
- Gu Y, Xiao X, Yang S. LncRNA MALAT1 acts as an oncogene in multiple myeloma through sponging miR-509-5p to modulate FOXP1 expression. Oncotarget. 2017;8(60):101984–101993.
- Hu Y, Lin JH, Fang H, et al. Targeting the MALAT1/PARP1/LIG3 complex induces DNA damage and apoptosis in multiple myeloma. Leukemia. 2018;32(10):2250–2262.
- Cho S-F, Chang YC, Chang C-S, et al. MALAT1 long non-coding RNA is overexpressed in multiple myeloma and may serve as a marker to predict disease progression. BMC Cancer. 2014;14(1):809.
- Fa-Xing Y, Kun-Liang G. The Hippo pathway: regulators and regulations. Genes Dev. 2013;27(4):355–371.
- Chai YT, Xiang K, Wu YZ, et al. Cucurbitacin B inhibits the Hippo-YAP signaling pathway and exerts anticancer activity in colorectal cancer cells. Med Sci Monit. 2018;24:9251–9258.
- Ai A, Xiong Y, Wu BL, et al. Induction of miR-15a expression by tripterygium glycosides caused premature ovarian failure by suppressing the Hippo-YAP/TAZ signaling effector Lats1. Gene. 2018;678:155–163.
- Beatriz García F, Pedro G, Catarina BP, et al. Actin-capping protein and the Hippo pathway regulate F-actin and tissue growth in Drosophila. Development. 2011;138(5):2337–2346.
- Neel JC, Lebrun JJ. Activin and TGFβ regulate expression of the microRNA-181 family to promote cell migration and invasion in breast cancer cells. Cell Signal. 2013;25(7):1556–1566.
- Chang HK, Kim HK, Rettig RL, et al. miRNA signature associated with outcome of gastric cancer patients following chemotherapy. BMC Med Genomics. 2011 Nov 23;4(1):79.
- Ji J, Yamashita TA. Identification of microRNA-181 by genome-wide screening as a critical player in EpCAM-positive hepatic cancer stem cells. Hepatology. 2010;50(2):472–480.
- Wang F, Sun JY, Zhu YH, et al. MicroRNA-181 inhibits glioma cell proliferation by targeting cyclin B1. Mol Med Rep. 2014;10(4):2160–2164.
- Wang TY, Zhou QL, Li M, et al. Shikonin alleviates allergic airway remodeling by inhibiting the ERK-NF-κB signaling pathway. Int Immunopharmacol. 2017;48:169.
- Liu K, Huang J, Ni J, et al. MALAT1 promotes osteosarcoma development by regulation of HMGB1 via miR-142â 3p and miR-129â 5p. Cell Cycle. 2017;16(6):578–587.
- Zhang TH, Liang LZ, Liu XL, et al. Long non-coding RNA MALAT1 interacts with miR-124 and modulates tongue cancer growth by targeting JAG1. Oncol Rep. 2017;37(4):2087.
- Li Y, Wu Z, Yuan J, et al. Long non-coding RNA MALAT1 promotes gastric cancer tumorigenicity and metastasis by regulating vasculogenic mimicry and angiogenesis. Cancer Lett. 2017;395(Complete):31.
- Shi D, Zhang Y, Lu R, et al. The long non-coding RNA MALAT1 interacted with miR-218 modulates choriocarcinoma growth by targeting Fbxw8. Biomed Pharmacother. 2018;97:543–550.
- Xu YL, Zhang XH, Hu XF, et al. The effects of lncRNA MALAT1 on proliferation, invasion and migration in colorectal cancer through regulating SOX9. Mol Med. 2018;24:15.
- Jin Y, Feng SJ, Qiu S, et al. LncRNA MALAT1 promotes proliferation and metastasis in epithelial ovarian cancer via the PI3K-AKT pathway. Eur Rev Med Pharmacol Sci. 2017;21(14):3176–3184.
- Shen H, Weng XD, Liu XH, et al. miR-181a-5p is downregulated and inhibits proliferation and the cell cycle in prostate cancer. Int J Clin Exp Pathol. 2018;11(8):3969–3976.
- Yang M, Zhai X, Ge TT, et al. miR-181a-5p promotes proliferation and invasion and inhibits apoptosis of cervical cancer cells via regulating inositol polyphosphate-5-phosphatase a (INPP5A). Oncol Res. 2018;26(5):703–712.
- Chen J, Hu LJ, Chen J, et al. Low expression lncRNA RPLP0P2 is associated with poor prognosis and decreased cell proliferation and adhesion ability in lung adenocarcinoma. Oncol Rep. 2016;36(3):1665–1671.
- Trenkmann M, Bertoncelj MF, Brock M, et al. Cytokine-mediated repression of the LncRNA hotair enhances intracellular signaling and the expression of adhesion molecules in synovial fibroblasts. Arthritis Rheum. 2013;65:S327–S328.
- Hsing EW, Shiah SG, Kuo CC, et al. miRNA-450a suppresses adhesion but promotes invasion through targeting of TMEM182 in oral squamous cell carcinoma. Cancer Res. 2017;77:1475.
- Wang HY, Zhu YC, Zhao MC, et al. miRNA-29c suppresses lung cancer cell adhesion to extracellular matrix and metastasis by targeting integrin beta 1 and matrix metalloproteinase2 (MMP2). Plos One. 2013;8:8.
- Liu J, Dong HH, Yang YX, et al. Upregulation of long noncoding RNA MALAT1 in papillary thyroid cancer and its diagnostic value. Future Oncol. 2018;14(29):3015–3022.
- Yan L, Zhang J, Guo D, et al. IL-21R functions as an oncogenic factor and is regulated by the lncRNA MALAT1/miR-125a-3p axis in gastric cancer. Int J Oncol. 2019;54(1):7–16.
- Ouyang H, Zhou EX, Wang H. Mst1-Hippo pathway triggers breast cancer apoptosis via inducing mitochondrial fragmentation in a manner dependent on JNK-Drp1 axis. Oncol Targets Ther. 2019;12:1147–1159.
- Zhao W, Zhang LN, Wang XL, et al. Long noncoding RNA NSCLCAT1 increases non-small cell lung cancer cell invasion and migration through the Hippo signaling pathway by interacting with CDH1. Faseb J. 2019;33(1):1151–1166.
- Deng PF, Zuo Y, Feng SX, et al. Knockdown of NRSF inhibits cell proliferation of ovarian cancer via activating Hippo pathway. Life Sci. 2018;215:73–79.
- Xie Y, Zhou F, Zhao X. TNFAIP8 promotes cell growth by regulating the Hippo pathway in epithelial ovarian cancer. Exp Ther Med. 2018;16(6):4975–4982.
- Liu Z, Yao YY, Huang SS, et al. LINC00662 promotes gastric cancer cell growth by modulating the Hippo-YAP1 pathway. Biochem Biophys Res Commun. 2018;505(3):843–849.
- Song GQ, Zhao Y. MAC30 knockdown involved in the activation of the Hippo signaling pathway in breast cancer cells. Biol Chem. 2018;399(11):1305–1311.