
ABSTRACT
Recently, the impacts of microRNAs (miRNAs) have been identified in epilepsy (EP), this study was designed to assess the role of miR-183 in hippocampal neuron injury in EP. Rat EP models were established by injected with lithium-pilocarpine. The pathological observation of rats’ hippocampus sections was conducted. Expression of miR-183, Foxp1, Jak1, Stat1, and Stat3 in rats’ hippocampal tissues was determined by reverse transcription quantitative polymerase chain reaction (RT-qPCR) and Western blot analysis. The proliferation ability and the apoptosis of the rats’ neurons were measured. Furthermore, the target relation between miR-183 and Foxp1 was determined by bioinformatics analysis and dual-luciferase gene reporter assay. The levels of miR-183, Jak1, Stat1, and Stat3 were elevated, and the expression of Foxp1 was declined in EP rats’ hippocampal tissues. Inhibited miR-183 could up-regulate Foxp1, inhibited miR-183 together with up-regulated Foxp1 could repress hippocampal neuron injury, promote neuron proliferation, suppress neuron apoptosis, and inactivate the Jak/Stat signaling pathway, resulting in an attenuation of EP progression. Moreover, down-regulated Foxp1 could reverse the attenuation of EP progression which was contributed by inhibited miR-183. Our study implies that inhibited miR-183 could up-regulate Foxp1, resulting in an inactivation of the Jak/Stat signaling pathway and promotion of neuron proliferation, as well as inhibition of apoptosis of hippocampal neurons in EP rats, by which the hippocampal neuron injury and EP progression could be repressed.
Introduction
Among all the nervous system diseases, epilepsy (EP) is the commonest, which is a kind of chronic and serious disease. There were 65 million people affected by EP all over the world [Citation1], who usually suffered unkindness and inconvenience from the society [Citation2]. Though EP can be cured in a majority of cases, there is still a great therapy gap, particularly in low- and middle-income countries [Citation3]. According to the previous literatures, there were several risk factors of EP, such as attention-deficit/hyperactivity disorder [Citation4], depressogenic medications [Citation5] and socioeconomic status [Citation6]. Electroencephalogram (EEG) signals were usually employed to diagnose EP as a noninvasive method, by which the brain electrical activity could be recorded [Citation7], and about two-thirds of EP patients can be treated by antiepileptic drugs [Citation8]. In recent years, a number of microRNAs (miRNAs) have been verified and characterized in human diseases, and there were many extant studies have unraveled that miRNAs were implicated in the development of EP, such as miR-132 [Citation9]and miR-210 [Citation10], as well as miR-183 [Citation11].
MiRNAs are known as small noncoding RNAs and generally deregulated in human diseases. As one of the miRNAs, miR-183 belongs to an evolutionarily conversed miRNA family, and was associated with different types of human diseases as a tumor inhibitor or an oncogene [Citation12]. There are several literatures have demonstrated that miR-183 was involved in the nervous system diseases, such as neuroblastoma [Citation13] and spinal muscular atrophy [Citation14]. Moreover, as a member of the Foxp family, forkhead box protein P1 (Foxp1) was initially cloned from B cell leukemia cell line BCL1 of a mouse [Citation15]. Many researches have provided evidence that Foxp1 is performed in human diseases, including primary central nervous system lymphoma [Citation16] and mental retardation [Citation17]. Playing an essential role in blood formation and immune response, the Janus kinase (Jak)/signal transducer and activator of transcription (Stat) pathway is of great importance to signaling through cytokine receptors, which contain over 30 proteins that distinguish particular cytokines [Citation18]. In addition, some studies have proven that the Jak/Stat signaling pathway is tightly related with EP [Citation19,Citation20]. However, there was little known about the relation among miR-183, Foxp1 and the Jak/Stat signaling pathway in the process of EP. Thus, this study was determined to focus on the capacity of miR-183 and Foxp1 in EP, and we speculated that miR-183 may mediate the Jak/Stat signaling pathway to attenuate hippocampal neuron injury in EP rats by targeting Foxp1.
Materials and methods
Ethics statement
Animal experiments were strictly consistent with the Guide to the Management and Use of Laboratory Animals issued by the National Institutes of Health. The protocol of animal experiments was authorized by the Institutional Animal Care and Use Committee of Affiliated hospital of zunyi medical university.
Study subjects
A total of 85 clean male Sprague Dawley (SD) rats (aged 4 w, weighed 200 ± 20 g) were obtained from Shanghai SLAC Laboratory Animal Co., Ltd. (Shanghai, China). Feeding conditions: the rats were separately fed with 12 h day/night cycle, avoidance of noise, temperature at 18–25°C, and relative humidity at 45–70%.
An amount of 10 clean SD rats newly born in 24 h were purchased from Shanghai SLAC Laboratory Animal Co., Ltd. (Shanghai, China). Feeding conditions: the rats were separately fed with 12 h day/night cycle, avoidance of noise, temperature at 20–23°C, and relative humidity at 45–50%.
Preparation of EP rat models
Preparation of lithium-pilocarpine-induced EP models: 75 SD rats were intraperitoneally injected with lithium chloride (125 mg/kg, Sigma, St. Louis, MO, USA). After 16 h, the rats were intraperitoneally injected with atropine (1 mg/kg, BOSTER Biological Technology Co., Ltd., Wuhan, Hubei, China), then intraperitoneally injected with pilocarpine (15 ng/kg, Sigma, St. Louis, MO, USA) after 30 min. Next, the rats without seizures in 30 min were injected with above dose again, no seizure after three times of continuous injection indicated failure of model establishment. Rats with over 30-min seizure were intraperitoneally injected with 10% chloral hydrate (1 mL/kg) to stop the seizure, this rejection would be repeated until the seizure stopped. After injected with pilocarpine, the ethology of rats was observed, and the rats were assessed by Racine classification criteria, rats reached or over IV class were used for the subsequent experiments.
Grouping and treatment
The successfully modeled 70 rats were separated into seven groups (10 rats in each group): the EP group (lithium-pilocarpine-induced EP rats); the EP + Antagomir negative control (NC) group: 4–6 h after EP induction, stereotaxic introduction of 50 μL miR-183 antagonist NC (1 nmol/50 μL) was conducted in lateral cerebral ventricle of the EP rats; the EP + Antagomir-miR-183 group: 4–6 h after EP induction, stereotaxic introduction of 50 μL miR-183 antagonist (1 nmol/50 μL) was conducted in lateral cerebral ventricle of the EP rats; the EP + overexpressed (oe)-NC group: 4–6 h after EP induction, stereotaxic introduction of 4 μL overexpressed Foxp1 vector NC was conducted in lateral cerebral ventricle of the EP rats; the EP + oe-Foxp1 group: 4–6 h after EP induction, stereotaxic introduction of 4 μL overexpressed Foxp1 vector was conducted in lateral cerebral ventricle of the EP rats; the EP + Antagomir-miR183 + siRNA-NC group: 4–6 h after EP induction, stereotaxic introduction of 50 μL miR-183 antagonist (1 nmol/50 μL) as well as 15 μL down-regulated Foxp1 vector NC was conducted in lateral cerebral ventricle of the EP rats; the EP + Antagomir-miR-183 + siRNA-Foxp1 group: 4–6 h after EP induction, stereotaxic introduction of 50 μL miR-183 antagonist (1 nmol/50 μL) as well as 15 μL down-regulated Foxp1 vector was conducted in lateral cerebral ventricle of the EP rats. The miR-183 antagonist NC and miR-183 antagonist were obtained from Guangzhou RiboBio Co., Ltd. (Guangdong, China), overexpressed Foxp1 vector NC, overexpressed Foxp1 vector, down-regulated Foxp1 vector NC and down-regulated Foxp1 vector were acquired from Shanghai GenePharma Co., Ltd. (Shanghai, China). In the normal group, rats were intraperitoneally injected with normal saline. The study timing of each group was set at 7 d after the EP, the data of rats (N = 10) in each group were recorded by electroencephalogram (EEG), then the hippocampus were collected, a part of which were made into paraffin sections (N = 5) and conducted with total RNA and total protein extraction for the following experiments (N = 5).
EEG monitoring
Before the EEG monitoring, the frequency of EP seizure was detected 7 d after the models were established (from AM 8:00 to PM 8:00). At first, the location of subdural electrode was confirmed (near median line = 3 mm, behind anterior fontanel = 3 mm), two pairs of electrodes (four Ag/AgCl electrodes, diameter: 100–200 μm) were imbedded in two sides of median line, and an indifferent electrode was imbedded in nasal side; an EEG recorder (Yuyan instruments Co., Ltd., Shanghai, China) was used to record for 60 min after the baseline was stable. The number of EP wave was calculated as the sum of spike wave in each minute – slow wave in each minute.
Hematoxylin-eosin (HE) staining
The samples were fixed by 10% formalin, embedded by paraffin, and sectioned into 4 μm. The toasted sections were, respectively, soaked in xylene I and xylene II (each for 10 min); then the dewaxed sections were, respectively, soaked in absolute ethanol I, absolute ethanol II, 95% ethanol, 80% ethanol and 70% ethanol (each for 2 min), and washed by phosphate-buffered solution (PBS) for 2 times, 5 min/time. Next, the sections were stained by hematoxylin (Solabio Life Sciences Co., Ltd, Beijing, China) for 3 min, rinsed by tap water for 3 min, differentiated by 1% hydrochloric alcohol for 2 s, then, respectively, soaked in 50%, 70% and 80% ethanol (each for 2 min), soaked by eosin for 5 s, and washed by tap water for 3 min. Subsequently, the sections were, respectively, soaked in 95% ethanol, absolute ethanol I and absolute ethanol II (each for 3 min), then, respectively, soaked in xylene I and xylene II (each for 5 min), and sealed by neutral balsam for microscopic examination.
Electron microscopy observation
The hippocampus tissues were fixed in glutaraldehyde (40 g/L) for 1 h and washed by PBS (0.1 mol/L, pH 7.4) for 3 times, 5 min/time, and fixed by osmium tetroxide (10 g/L) for 1.5 h, rinsed by PBS again (0.1 mol/L, pH 7.4) for 3 times, 5 min/time. Then, the tissues were dehydrated by gradient ethanol, soaked in acetone and equal Epon812 (HEAD Biotechnology Co., Ltd., Beijing, China) mixed liquor for 3 h, embedded by Epon812, and polymerized at 60°C for 48 h. The tissues were sectioned, and stained by uranyl acetate (40 g/L) and lead nitrate (27 g/L, both for 20 min), and observed under an electron transmission microscope (Thermo Fisher Scientific Inc., Waltham, MA, USA).
Nissl’s staining
The hippocampus tissue sections were soaked in xylene, 100%, 95%, 80% and 70% ethanol (each for 2 min), rinsed by PBS, stained by 1% toluidine blue (Beyotime Institute of Biotechnology, Shanghai, China) for 40 min, then rinsed by running water for 8 min. Afterward, the sections were dehydrated by successfully soaked in 70%, 80%, 95% and 100% ethanol (each for 2 min), and then permeabilized by xylene Ⅰ and xylene Ⅱ (each for 3 min). After sealed by neutral balsam, the Nissl positive cells in hippocampus tissue sections were observed and counted under a microscope.
Fluoro-Jade C (FJC) staining
The hippocampus tissue sections were soaked in 1% NaOH-80% ethanol-mixed liquor for 5 min, soaked in 70% ethanol for 2 min and soaked in distilled water for 2 min, then immersed in 0.06% potassium permanganate solution for 10 min, and rinsed by distilled water for 2 min. The 0.0001% FJC dye (United Chemi-Con, CA, USA) containing 0.1% acetic acid was evenly added on the treated hippocampus tissue sections for 10-min reaction; the reacted sections were washed by distilled water for 3 times, 1 min/time; then the sections were dried, permeabilized by xylene for 1 min, and sealed by dibutyl phthalate and xylene. Next, the sections were observed under Olympus BX60 fluorescence microscope (Olympus Optical Co., Ltd, Tokyo, Japan) at wavelength 450–490 nm with blue filter, and the images were collected.
Terminal deoxynucleotidyl transferase-mediated dUTP nick end-labeling (TUNEL) staining
The paraffin sections were dewaxed and dehydrated, and incubated by pepsin (0.25–0.5 hydrochloric acid solution) at 37°C for 60 min, washed by PBS for 3 times, appended with 50 μL TUNEL solution (BOSTER Biological Technology Co., Ltd., Wuhan, Hubei, China), then incubated in a wet box at 37°C for 60 min, and washed by PBS for 3 times. Subsequently, the sections were supplemented with transforming agent peroxidase, then incubated in a wet box at 37°C for 30 min, and washed by PBS for 3 times. Afterward, the sections were developed by diaminobenzidine (DAB, BOSTER Biological Technology Co., Ltd., Wuhan, Hubei, China), which was stopped by adding water. Then, the sections were soaked in hematoxylin for 2 min and washed by water for 2 min, dipped by 95% ethanol I-II, absolute ethanol I-II, each for 3–5 min, and xylene I-II, each for 3–5 min. After sealed by neural balsam, the sections were observed by a light microscope.
Fluorescein diacetate/propidium iodide (FDA/PI) staining
The hippocampal tissues were cut into sections (0.5 mm), which were immersed in PBS containing 3 mg/L FDA (Huaxia Chemical Reagent Co., Ltd., Sichuan, China) and incubated at 37°C for 5 min, then soaked in PBS containing 10 mg/L PI (Huaxia Chemical Reagent Co., Ltd., Sichuan, China) and incubated for 1 min. After rinsed by PBS for 3 times, the sections were observed under an inverted fluorescence microscope (Olympus Optical Co., Ltd, Tokyo, Japan). The red fluorescence represented for cells that have been stained by PI, which were apoptotic cells, and the green fluorescence represented for cells that have been stained by FDA, which were survival cells. The neuronal apoptosis was assessed by the ratio of apoptotic cells and survival cells.
Hoechst 33258 staining
After dewaxed by xylene and gradient ethanol, the sections were conducted with water bath by citrate solution at 97°C for 15 min, and washed by PBS twice, 3 min/time, then stained by Hoechst 33,258 dye (Beyotime Institute of Biotechnology, Shanghai, China) for 5 min. Washed by PBS twice (3min/time), the sections were supplemented with a drop of anti-quenching sealing solution and fixed in a cover glass, then photographed by a fluorescence microscope (Olympus Optical Co., Ltd, Tokyo, Japan, excitation wavelength at 350 nm, emission wavelength at 460 nm). The apoptotic nuclei were performed as pyknosis and bright blue after Hoechst 33,258 staining. The number of positive cells and total cells in the same area was investigated by IPP 6.0 (Media Cybernetics Inc. MD, USA). The apoptotic rate = number of positive cells/number of total cells × 100%.
Reverse transcription quantitative polymerase chain reaction (RT-qPCR)
The total RNA in tissues and cells was extracted by Trizol kit (Invitrogen, Carlsbad, California, USA). The primers () were designed and synthetized by Takara Biotechnology Ltd. (Dalian, China). The RNAs were then reversely transcripted into cDNAs according to the directions of PrimeScript RT kit (TaKaRa Biotechnology Co., Ltd., Liaoning China), the reverse transcription system was 10 μL. The reaction solution was conducted with RT-qPCR under the guide of instructions of SYBR® Premix Ex TaqTM II kit (TaKaRa Biotechnology Co., Ltd., Liaoning China), then conducted with RT-qPCR in ABI PRISM® 7300 system. U6 was taken as the internal reference of miR-183, glyceraldehyde phosphate dehydrogenase (GAPDH) was taken as the internal reference of Foxp1, Jak1, Stat1, Stat3, Bcl-2, and Bax. The data were analyzed by 2−△△Ct method [Citation21].
Table 1. Primer sequence
Western blot analysis
The total protein of hippocampus tissues and cells were extracted and the protein concentration of each sample was determined. The samples were mixed up with loading buffer and boiled at 100°C for 5 min, conducted with ice bath, centrifugation, and electrophoretic separation. The proteins were transferred onto nitrocellulose membrane and fixed by 5% skim milk powder at 4°C overnight. The proteins were added with primary antibodies: Foxp1 (1:100), Jak1 (1:500), Stat1 (1:500) and Stat3 (1:500, all from Abcam, Cambridge, UK), Bcl-2 and Bax (1:500, both from Proteintech, Chicago, USA), incubated overnight. Then, the proteins were washed by PBS for 3 times, 5 min/time, appended with horseradish peroxidase-labeled IgG (1:1000, BOSTER Biological Technology Co. Ltd., Wuhan, Hubei, China) and incubated at 37°C for 1 h. Rinsed by PBS for 3 times (5 min/time), the membrane was soaked in an enhanced chemiluminescent reaction solution (Pierce, Rockford, IL, USA) for 1 min. With the solution discarded, the proteins were covered by food wrap and exposed by radiographs in dark environment, then observed after development and fixation. GAPDH was taken as the internal reference, the protein maker was acquired from Piercenet (#84,785), the Western blot images were analyzed by ImageJ2x software (National Institutes of Health (NIH), MD, USA).
Isolated culture and model establishment of neurons
The SD rats (in 24 h after birth) were disinfected by 75% ethanol and decapitated, the rats’ brains were soaked in D-Hank’s solution (Procell Life Science&Technology Co., Ltd., Wuhan, China), and the hippocampus tissues were separated, meninges and blood vessels were cut into pieces, then detached at 37°C for 20–25 min by 1.25 g/mL trypsin. With the upper trypsin removed, the trypsinization was stopped by adding 4 mL planting medium, the cells were triturated by polished straw for 20 times and centrifuged at 1000 r/min for 5 min. With supernatant discarded, the cells were made into single cell suspension and filtered. Then, the cells were counted by trypan staining, the cell concentration was diluted to 1 × 10⁸ cells/L, and the cell suspension was seeded on 96-well plates with L-polylysine peridium, five wells were set in each group, incubated at 37°C and saturated humidity for 24 h, the full dose of medium was changed, then half dose of the medium was changed every 3 d.
The cells were observed under an inverted phase contrast microscope (Olympus Optical Co., Ltd, Tokyo, Japan), and assessed by streptavidin-peroxidase (SP) immunocytochemical staining. The neurons were labeled by neurofilament (NF) monoclonal antibody (Sigma-Aldrich Chemical Company, St Louis, MO, USA). With medium discarded, hippocampal neurons in vitro on the 9th day were appended with magnesium-free solution and cultured for 3 h to establish epileptic cell models.
Cell grouping
The cells were separated into eight groups: the control group (normal hippocampal neurons of rats); the EP group (epileptic hippocampal neurons); the EP + inhibitor NC group (epileptic hippocampal neurons were introduced with inhibitor NC); the EP + miR-183 inhibitor group (epileptic hippocampal neurons were introduced with miR-183 inhibitor); the EP + oe-NC group (epileptic hippocampal neurons were transfected with overexpressed Foxp1 vector NC); the EP + oe-Foxp1 group (epileptic hippocampal neurons were introduced with overexpressed Foxp1 vector); the EP + miR-183 inhibitor + siRNA-NC group (epileptic hippocampal neurons were transfected with miR-183 inhibitor and poorly expressed Foxp1 vector NC); the EP + miR-183 inhibitor + siRNA-Foxp1 group (epileptic hippocampal neurons were transfected with miR-183 inhibitor and poorly expressed Foxp1 vector). The inhibitor NC, miR-183 inhibitor, overexpressed Foxp1 vector NC and overexpressed Foxp1 vector were obtained from GeneCopoeia Co., Ltd. (Guangdong, China), the poorly expressed Foxp1 vector NC and poorly expressed Foxp1 vector were purchased from Shanghai GenePharma Co. Ltd. (Shanghai, China). Twenty-four hours before the transfection, the cells were seeded onto 6-well plates, when the cell confluence reached 50%, the cells were transiently transfected by lipofectamine2000 (Invitrogen, Carlsbad, California, USA). The medium was changed after the cells were transfected for 6 h, and the cells were collected after 48-h culture for the subsequent experiments.
3-(4,5-dimethyl-2-thiazolyl)-2,5-diphenyl-2-H-tetrazolium bromide (MTT) assay
An amount of 5000 cells in the logarithmic growth phase were seeded onto 96-well plates, and 6 duplicate wells were set in each group, meanwhile, the blank control without cells was set. Each well was supplemented with 20 μL MTT solution (5 μg/mL, Sigma-Aldrich Chemical Company, St Louis, MO, USA) for 4-h incubation. With supernatant discarded, the cells were added with dimethyl sulfoxide (DMSO, 200 μL/well, Sigma-Aldrich Chemical Company, (St Louis, MO, USA)) and mixed for 10 min to dissolve precipitates. The optical density (OD) value at 490 nm was analyzed by a microplate reader.
5-ethynyl-2ʹ-deoxyuridine (EdU) assay
Hippocampal neurons in the logarithmic growth phase were seeded onto 24-well plates, which were supplemented with 5 μL EdU, and incubated at 37°C for 2 h, then washed by PBS for 3 times. After fixed by cold methanol for 15 min, the cells were stained strictly in accordance with the instructions of EdU kits (Shanghai Rainbow Chemistry Co., Ltd., Shanghai, China), then observed by a laser scanning confocal microscope (Wolfbn precision machinery Co., Ltd., Jiangsu, China).
Hoechst 33342 staining
Cells in each group were added with 2 mL Roswell Park Memorial Institute (RPMI)-1640 medium containing 2% fetal bovine serum (FBS, both from Gibco, Carlsbad, CA, USA), appended with Hoechst 33,342 dye (5 μg/mL, Biolab Technology Co., Ltd., Beijing, China) and incubated at 37°C without light exposure for 90 min, then washed by PBS twice and added with 1 mL RPMI-1640 medium containing 2% FBS. Subsequently, the cells were observed and photographed using a fluorescence microscope.
Flow cytometry
The apoptosis was detected by AnnexinV-Activated Protein C (APC)/PI double staining: the binding buffer was diluted by deionized water (4 mL binding buffer and 12 mL deionized water); the cells were rinsed by precooled PBS twice and resuspended by 250 μL binding buffer to adjust the concentration to 1 × 10⁶ cells/mL; cell suspension (100 μL) was appended into 5 mL flow tubes, then supplemented with 5 μL Annexin V-APC and 5 μL PI solution (both from BD Biosciences, Franklin Lakes, NJ, USA), and the cells were cultured without light exposure for 15 min; with 400 μL PBS appended, the reaction tubes were introduced in flow cytometry, and the results were analyzed by computer.
Dual luciferase reporter gene assay
The binding sites and target relation of miR-183 and Foxp1 were predicted by a bioinformatics software (http://www.targetscan.org). The promoter region sequences of Foxp1 3ʹ-untranslated region (3ʹUTR) containing the binding sites of miR-183 were synthesized and inserted into pMIR-REPORTTM Luciferase vector plasmid (Ambion, Austin, TX, USA) to establish Foxp1 3ʹUTR wild type plasmid (Foxp1-WT), based on which the binding sites were mutated to establish Foxp1 3ʹUTR mutation plasmid (Foxp1-MUT). The above steps were under the guide of the instructions of plasmid extraction kits (Promega, Madison, Wisconsin, USA). Cells in the logarithmic growth phase were seeded onto 96-well plates and introduced with Lipofectamine 2000 when the cell confluence reached 70%. Foxp1-WT and Foxp1-MUT were, respectively, mixed up with mimics NC and miR-183 mimics (GenePharma Ltd. Company, Shanghai, China), and introduced to the cells. The 48-h transfection was followed by cells lysed, and the luciferase activity was evaluated by luciferase detection kit (BioVision, San Francisco, CA, USA) as well as Glomax20/20 luminometer (Promega, Madison, Wisconsin, USA).
Statistical analysis
All data analyses were conducted using SPSS 21.0 software (IBM-SPSS, Inc, Chicago, IL, USA). The measurement data conforming to the normal distribution were performed as mean ± standard deviation. The one-way analysis of variance (ANOVA) was employed for comparisons among multiple groups, and Tukey’s post hoc test was used for pairwise comparisons after one-way ANOVA. P value <0.05 was indicative of statistically significant difference.
Results
Inhibited miR-183 and overexpressed Foxp1 attenuate EP progression
Ethology observation of rats ()): the rats that were intraperitoneally injected with normal saline instead of lithium and chloride taken food and water as normal, without epileptic seizure. The rats induced by EP were also free to act, take food and water, while with facial spasm, nutation, forelimb clonus and standing on hind limbs, which were over Ⅳ Racine criterion, and the rate of seizure was 95%.
Figure 1. Inhibited miR-183 and overexpressed Foxp1 attenuate EP progression. (a), epileptic seizure in rats; (b-c), the results of EEG monitoring of rats in each group on the 7th day, * P < 0.05 vs the normal group, + P < 0.05 vs the EP + Antagomir-NC group, # P < 0.05 vs the EP + oe-NC group, & P < 0.05 vs the EP + Antagomir-miR-183 + siRNA-NC group. N = 10, the measurement data conforming to the normal distribution were performed as mean ± standard deviation, one-way ANOVA was employed for comparisons among multiple groups, and Tukey’s post hoc test was used for pairwise comparisons after one-way ANOVA
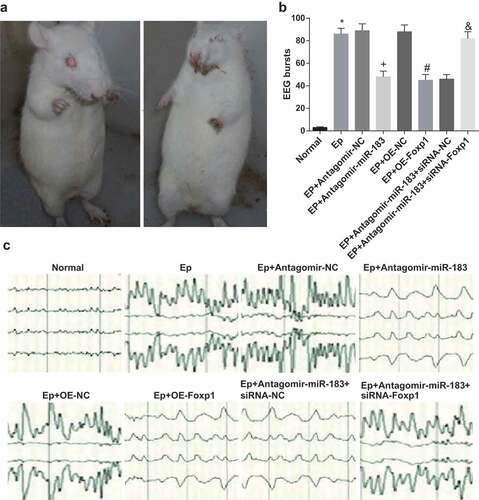
The results of EEG monitoring (,c)): in contrast to the normal group, the number of spine-slow waves in the EP group was evidently elevated (P < 0.05); the number of spine-slow waves in the EP + Antagomir-miR-183 group was broadly declined relative to the EP + Antagomir-NC group (P < 0.05); contrasted to the EP + oe-NC group, the number of spine-slow waves in the EP + oe-Foxp1 group was apparently reduced (P < 0.05); relative to the EP + Antagomir-miR-183 + siRNA-NC group, the number of spine-slow waves in the EP + Antagomir-miR-183 + siRNA-Foxp1 group was noticeably advanced (P < 0.05).
Inhibited miR-183 and overexpressed Foxp1 repress hippocampal neuron injury in EP rats
According to the results of HE staining ()), neurons in the normal group were with uniform order, clear outline, circle or oval shape, transparent cytoplasm and integrate structure; while neurons in the EP group, the EP+ Antagomir NC group as well as the EP + oe-NC group were with irregular order, indistinct outline, karyopyknosis, cytoplasm vacuoles, and structural injury such as obvious neuronal degeneration and apoptosis; neurons in the EP + Antagomir-miR-183 group, the EP + oe-Foxp1 group and the EP + Antagomir-miR-183 + siRNA-NC group were with uniform order, attenuated cellular edema, cytoplasm vacuoles, and structural injury such as neuronal degeneration and apoptosis, which were in comparison to the EP group; neurons in the EP + Antagomir-miR-183 + siRNA-Foxp1 group were with higher degrees of cellular edema, cytoplasm vacuoles, and structural injury such as neuronal degeneration and apoptosis, which was relative to the EP + Antagomir-miR-183 + siRNA-NC group.
Figure 2. Inhibited miR-183 and overexpressed Foxp1 repress hippocampal neuron injury in EP rats. (a), results of rats’ neuron staining observation in each group (400 ×); (b), comparison of ultrastructure of rats’ hippocampus pyramidal cells among the groups (7500 ×); (c-d), comparison of rats’ neuron injury among the groups (200 ×), * P < 0.05 vs the normal group, + P < 0.05 vs the EP + Antagomir-NC group, # P < 0.05 vs the EP + oe-NC group, & P < 0.05 vs the EP + Antagomir-miR-183 + siRNA-NC group. N = 5, the measurement data conforming to the normal distribution were performed as mean ± standard deviation, one-way ANOVA was employed for comparisons among multiple groups, and Tukey’s post hoc test was used for pairwise comparisons after one-way ANOVA
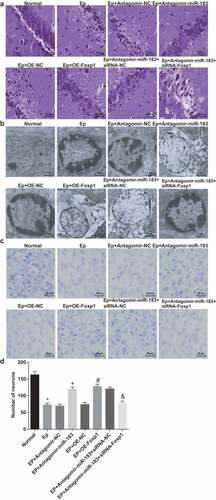
The results of electron microscope observation ()) implied that neurons in the normal group were with normal ultrastructure, oval nuclear, integrate karyotheca, evenly distributed chromatin, and obvious nucleolus; while neurons in the EP group, the EP + Antagomir NC group and the EP + oe-NC group were with aggravated neuron injury, distinct karyotheca, karyopyknosis, margination, breakage of mitochondrial membrane, disappearance of matrix, occurrence of vacuolization, disintegration of inner and outer membrane, huge mitochondrial, myeloid body, cavitation and swelling of part of glia cells, sparseness and structural damage of organelle, swelling of vesica and endoplasmic reticulum of Golgi complex, and apoptotic cells; neurons in the EP + Antagomir-miR-183 group, the EP + oe-Foxp1 group and the EP + Antagomir-miR-183 + siRNA-NC group were with karyopyknosis, mitochondrial swelling and vacuole in cytoplasm; neurons in the EP + Antagomir-miR-183 + siRNA-Foxp1 group were with margination, nucleolar migration, cavitation of mitochondrion, incomplete and fractured mitochondrial membrane, which was in contrast to the EP + Antagomir-miR-183 + siRNA-NC group.
The results of Nissl’s staining (,d)) revealed that relative to the normal group, the number of cells in the EP group was declined (P < 0.05); in comparison to the EP + Antagomir-NC group, the number of cells in the EP + Antagomir-miR-183 group was elevated (P < 0.05); compared with the EP + oe-NC group, the number of cells were augmented in the EP + oe-Foxp1 group (P < 0.05); contrasted to the EP + Antagomir-miR-183 + siRNA-NC group, the number of cells in the EP + Antagomir-miR-183 + siRNA-Foxp1 group was decreased (P < 0.05).
Inhibited miR-183 and overexpressed Foxp1 suppress neuron apoptosis in hippocampus of EP rats
The positive cell morphology of FJC degeneration ()): there were no FJC positive cells in the normal group, while the FJC positive cells in yellow-green fluorescence could be observed on the brain sections of the EP group. According to the situation of soma, dendrite, axon and axon terminal, the FJC positive cells in the EP + Antagomir-miR-183 group were less than the EP + Antagomir-NC group; the FJC positive cells in the EP + oe-Foxp1 group were less than the EP + oe-NC group; the FJC positive cells in the EP + Antagomir-miR-183 + siRNA-Foxp1 group were more than the EP + Antagomir-miR-183 + siRNA-NC group.
Figure 3. Inhibited miR-183 and overexpressed Foxp1 suppress neuron apoptosis in hippocampus of EP rats. (a), FJC positive degeneration neurons of rats (400 ×); (b), results of TUNEL staining observation (400 ×); (c), results of Hoechst 33258 staining observation (400 ×) of rats’ hippocampus; (d), neuron apoptotic rates of rats’ hippocampus; (e), mRNA expression of Bax and Bcl-2 were detected by RT-qPCR; (f), the statistical results of protein expression of Bax and Bcl-2 in rats’ hippocampus; (g), protein bands of Bax and Bcl-2 in rats’ hippocampus, 1–8 indicated the normal group, the EP group, the EP + Antagomir-NC group, the EP + Antagomir-miR-183 group, the EP + oe-NC group, the EP + oe-Foxp1 group, the EP + Antagomir-miR-183 + siRNA-NC group and the EP + Antagomir-miR-183 + siRNA-Foxp1 group, respectively. * P < 0.05 vs the normal group, + P < 0.05 vs the EP + Antagomir-NC group, # P < 0.05 vs the EP + oe-NC group, & P < 0.05 vs the EP + Antagomir-miR-183 + siRNA-NC group. N = 5, the measurement data conforming to the normal distribution were performed as mean ± standard deviation, one-way ANOVA was employed for comparisons among multiple groups, and Tukey’s post hoc test was used for pairwise comparisons after one-way ANOVA
Outcomes of TUNEL staining indicated that ()) there were less positive cells in the normal group, which was relative to the EP group; the positive cells in the EP + Antagomir-miR-183 group were less than the EP + Antagomir-NC group; the positive cell in the EP + oe-Foxp1 group were less than the EP + oe-NC group; and the positive cells in the EP + Antagomir-miR-183 + siRNA-Foxp1 group were more than the EP + Antagomir-miR-183 + siRNA-NC group.
Results of Hoechst 33,258 staining illuminated that (,d)) in comparison to the EP group, apoptotic rate of the normal group was declined (P < 0.05); relative to the EP + Antagomir-NC group, apoptotic rate of the EP + Antagomir-miR-183 group was lowered (P < 0.05); contrasted to the EP + oe-NC group, apoptotic rate of the EP + oe-Foxp1 group was reduced (P < 0.05); apoptotic rate in the EP + Antagomir-miR-183 + siRNA-Foxp1 group was heightened, which was in contrast to the EP + Antagomir-miR-183 + siRNA-NC group (P < 0.05).
Results of RT-qPCR and Western blot analysis (–g)) reflected that relative to the normal group, Bcl-2 expression was decreased, while Bax expression was elevated in the EP group (both P < 0.05); in contrast to the EP + Antagomir-NC group, Bcl-2 expression was advanced, while Bax expression was abated in the EP + Antagomir-miR-183 group (both P < 0.05); the expression of Bcl-2 was heightened and the expression of Bax was declined in the EP + oe-Foxp1 group, which was relative to the EP + oe-NC group (both P < 0.05); contrasted to the EP + Antagomir-miR-183 + siRNA-NC group, the expression of Bcl-2 was reduced, while the expression of Bax was augmented in the EP + Antagomir-miR-183 + siRNA-Foxp1 group (both P < 0.05).
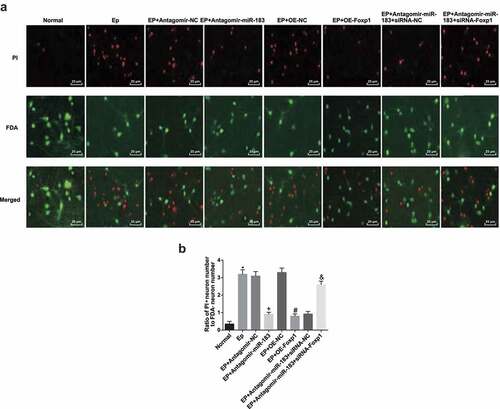
The hippocampal tissues of rats in each group have been conducted with FDA/PI staining (,b)), the red fluorescence represented for apoptotic neurons, and green fluorescence represented for survival neurons. The results mirrored that the ratio of apoptotic neurons and survival neurons in the normal group, the EP + Antagomir-miR-183 group, the EP + oe-Foxp1 group, and the EP + Antagomir-miR-183 + siRNA-NC group was lower than that of the EP group, the EP + Antagomir-NC group, the EP + oe-NC group, and the EP + Antagomir-miR-183 + siRNA-Foxp1 group, severally (all P < 0.05).
Figure 4. Inhibited miR-183 and overexpressed Foxp1 restrict neuron apoptosis in hippocampus of EP rats. (a), representative images of FDA/PI staining (400 ×); (b), statistical results of ratio of apoptotic neurons and survival neurons after the rats’ hippocampal tissues conducted with FDA/PI staining. * P < 0.05 vs the normal group, + P < 0.05 vs the EP + Antagomir-NC group, # P < 0.05 vs the EP + oe-NC group, & P < 0.05 vs the EP + Antagomir-miR-183 + siRNA-NC group. N = 5, the measurement data conforming to the normal distribution were performed as mean ± standard deviation, one-way ANOVA was employed for comparisons among multiple groups, and Tukey’s post hoc test was used for pairwise comparisons after one-way ANOVA
Inhibited miR-183 up-regulates Foxp1 and inactivates the Jak/Stat signaling pathway in EP rats
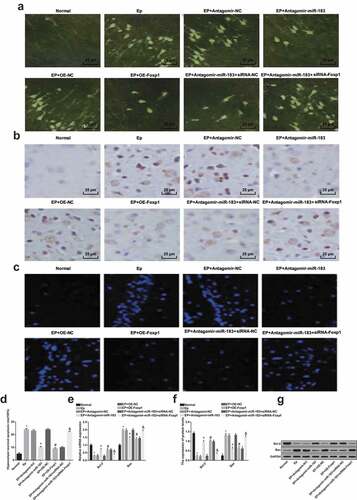
Results of RT-qPCR and Western blot analysis (–c)) implied that in comparison to the normal group, expression of miR-183, Jak1, Stat1, and Stat3 was heightened, while the expression of Foxp1 was reduced in the EP group (all P < 0.05); relative to the EP + Antagomir-NC group, expression of miR-183, Jak1, Stat1, and Stat3 was inhibited, while the expression of Foxp1 was advanced in the EP + Antagomir-miR-183 group (all P < 0.05); in contrast to the EP + oe-NC group, expression of Jak1, Stat1, and Stat3 was declined, while the expression of Foxp1 was elevated in the EP + oe-Foxp1 group (all P < 0.05); in comparison to the EP + Antagomir-miR-183 + siRNA-NC group, expression of Jak1, Stat1, and Stat3 was increased, while the expression of Foxp1 was repressed in the EP + Antagomir-miR-183 + siRNA-Foxp1 group (all P < 0.05).
Figure 5. Inhibited miR-183 up-regulates Foxp1 and inactivates the Jak/Stat signaling pathway in EP. (a), expression of miR-183, Foxp1, Jak1, Stat1, and Stat3 were detected by RT-qPCR; (b), the statistical results of protein expression of Foxp1, Jak1, Stat1, and Stat3 in rats’ hippocampus; (c), protein bands of Foxp1, Jak1, Stat1, and Stat3 in rats’ hippocampus, 1–8 indicated the normal group, the EP group, the EP + Antagomir-NC group, the EP + Antagomir-miR-183 group, the EP + oe-NC group, the EP + oe-Foxp1 group, the EP + Antagomir-miR-183 + siRNA-NC group and the EP + Antagomir-miR-183 + siRNA-Foxp1 group, respectively. * P < 0.05 vs the normal group, + P < 0.05 vs the EP + Antagomir-NC group, # P < 0.05 vs the EP + oe-NC group, & P < 0.05 vs the EP + Antagomir-miR-183 + siRNA-NC group. N = 5, the measurement data conforming to the normal distribution were performed as mean ± standard deviation, one-way ANOVA was employed for comparisons among multiple groups, and Tukey’s post hoc test was used for pairwise comparisons after one-way ANOVA
Inhibited miR-183 and overexpressed Foxp1 promote neuron proliferation in EP rats
The growth of rats’ hippocampal neurons in vitro ()): most of the cells became adherent 4–6 h after they were seeded, and two or three small processes could be observed after 1-d culture; the neurons enlarged into spindle, pyrometric cone, and polygon after 3-d culture; the neurons were with large soma, satiation, and a halo surrounding, and the processes contacted with each other, forming a complicated neural network after 7-d culture.
Figure 6. Inhibited miR-183 and overexpressed Foxp1 promote neuron proliferation in EP rats. (a), observation of neuron morphology of rats’ hippocampus (200 ×); (b), expression of NF of neurons in rats’ hippocampus; (c), comparison of cell proliferation ability among the groups; (d), positive cells in EdU staining of each group; (e), representative images of EdU staining (400 ×), * P < 0.05 vs the control group, + P < 0.05 vs the EP + inhibitor NC group, # P < 0.05 vs the EP + oe-NC group, & P < 0.05 vs the EP + miR-183 inhibitor + siRNA-NC group. The experiment was independently repeated for 3 times, the measurement data conforming to the normal distribution were performed as mean ± standard deviation, one-way ANOVA was employed for comparisons among multiple groups, and Tukey’s post hoc test was used for pairwise comparisons after one-way ANOVA
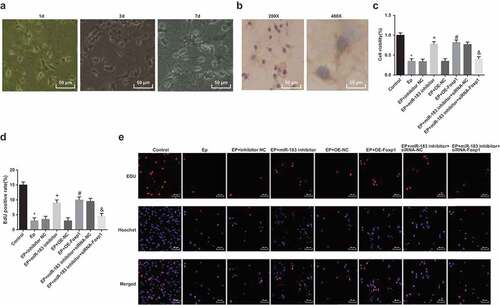
According to the assessment of neurons in vitro ()), the cells were conducted with anti-NF immunocytochemical staining, and a large number of brown positive cells could be found in neuron cytoplasm and axon under an inverted microscope. The purity of neurons approached 90% on the 9th day of culture.
The neuron proliferation was evaluated by MTT assay and EdU assay (–e)), relative to the control group, the cell proliferation of the EP group was evidently reduced (P < 0.05); in contrast to the EP + inhibitor NC group, the cell proliferation of the EP + miR-183 inhibitor group was broadly elevated (P < 0.05); in contrast to the EP + oe-NC group, the cell proliferation of the EP + oe-Foxp1 group was considerably advanced (P < 0.05); compared with the EP + miR-183 inhibitor + siRNA-NC group, the cell proliferation of the EP + miR-183 inhibitor + siRNA-Foxp1 group was apparently declined (P < 0.05).
Inhibited miR-183 and overexpressed Foxp1 suppress neuron apoptosis in EP rats
According to the Hoechst 33342 staining ()), the apoptotic cells in the EP group were more than the control group, and that of the EP + miR-183 inhibitor group were less than the EP + inhibitor NC group; the apoptotic cells in the EP + oe-Foxp1 group were less than the EP + oe-NC group, and that of the EP + miR-183 inhibitor + siRNA-Foxp1 group were more than the EP + miR-183 inhibitor + siRNA-NC group.
Figure 7. Inhibited miR-183 and overexpressed Foxp1 suppress neuron apoptosis in EP. (a), apoptosis was detected by Hoechst 33342 staining; (b), apoptosis was detected by flow cytometry; (c), comparison of apoptotic rates among the groups; (d), mRNA expression of Bcl-2 and Bax was detected by RT-qPCR; (e), statistical results of protein expression of Bcl-2 and Bax; F, protein bands of Bcl-2 and Bax, 1–8 indicated the control group, the EP group, the EP + inhibitor NC group, the EP + miR-183 inhibitor group, the EP + oe-NC group, the EP + oe-Foxp1 group, the EP + miR-183 inhibitor + siRNA-NC group and the EP + miR-183 inhibitor + siRNA-Foxp1 group, respectively. * P < 0.05 vs the control group, + P < 0.05 vs the EP + inhibitor NC group, # P < 0.05 vs the EP + oe-NC group, & P < 0.05 vs the EP + miR-183 inhibitor + siRNA-NC group. The experiment was independently repeated for 3 times, the measurement data conforming to the normal distribution were performed as mean ± standard deviation, one-way ANOVA was employed for comparisons among multiple groups, and Tukey’s post hoc test was used for pairwise comparisons after one-way ANOVA
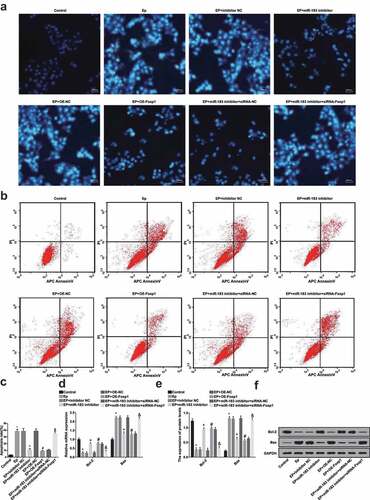
Outcomes of AnnexinV-APC/PI double staining (,c)) implied that relative to the control group, neuron apoptotic rate of the EP group was broadly elevated (P < 0.05); in comparison to the EP + inhibitor NC group, neuron apoptotic rate of the EP + miR-183 inhibitor was evidently declined (P < 0.05); contrasted to the EP + oe-NC group, neuron apoptotic rate of the EP + oe-Foxp1 group was broadly lowered (P < 0.05); compared with the EP + miR-183 inhibitor + siRNA-NC group, neuron apoptotic rate of the EP + miR-183 inhibitor + siRNA-Foxp1 group was markedly heightened (P < 0.05).
Results of RT-qPCR and Western blot analysis (–f)) suggested that contrasted to the control group, Bcl-2 expression was declined, while Bax expression was elevated in the EP group (both P < 0.05); in contrast to the EP + inhibitor NC group, Bcl-2 expression was advanced, while the expression of Bax was abated in the EP + miR-183 inhibitor group (both P < 0.05); the expression of Bcl-2 was heightened and the expression of Bax was declined in the EP + oe-Foxp1 group, which was compared with the EP + oe-NC group (both P < 0.05); in comparison to the EP + miR-183 inhibitor + siRNA-NC group, Bcl-2 expression was reduced, while Bax expression was advanced in the EP + miR-183 inhibitor + siRNA-Foxp1 group (both P < 0.05).
Inhibited miR-183 inactivates the Jak/Stat signaling pathway in EP rats by targeting Foxp1
The target relation between miR-183 and Foxp1 was analyzed by online prediction software, which showed that there were specific binding region among the sequences of Foxp1 and miR-183, indicating that Foxp1 is a target gene of miR-183 ()). It was verified by dual luciferase reporter gene assay that Foxp1 is the target gene of miR-183 ()), the results of which unraveled that relative to the NC group, the luciferase activity of Foxp1-WT was lowered in the miR-183 mimics group (P < 0.05), no difference could be observed in the luciferase activity of Foxp1-MUT between the NC group and the miR-183 mimics group (P > 0.05), suggesting that miR-183 could specifically bind with Foxp1.
Figure 8. Inhibited miR-183 inactivates the Jak/Stat signaling pathway in EP rats by targeting Foxp1. (a), predicted binding sites of miR-183 on Foxp1 3ʹUTR; (b), detection of luciferase activity between miR-183 on Foxp1; (c), the expression of miR-183, Foxp1, Jak1, Stat1, and Stat3 was detected by RT-qPCR; (d), statistical results of protein expression of Foxp1, Jak1, Stat1, and Stat3; (e), protein bands of Foxp1, Jak1, Stat1, and Stat3, 1–8 indicated the control group, the EP group, the EP + inhibitor NC group, the EP + miR-183 inhibitor group, the EP + oe-NC group, the EP + oe-Foxp1 group, the EP + miR-183 inhibitor + siRNA-NC group and the EP + miR-183 inhibitor + siRNA-Foxp1 group, respectively. * P < 0.05 vs the control group, + P < 0.05 vs the EP + inhibitor NC group, # P < 0.05 vs the EP + oe-NC group, & P < 0.05 vs the EP + miR-183 inhibitor + siRNA-NC group. The experiment was independently repeated for 3 times, the measurement data conforming to the normal distribution were performed as mean ± standard deviation, one-way ANOVA was employed for comparisons among multiple groups, and Tukey’s post hoc test was used for pairwise comparisons after one-way ANOVA
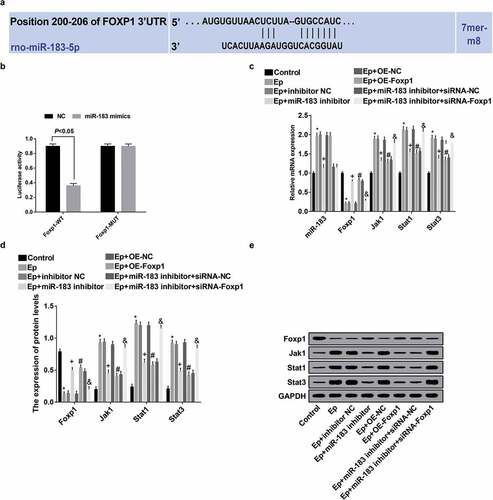
Results of RT-qPCR and Western blot analysis (–e)) suggested that contrasted to the control group, expression of miR-183, Jak1, Stat1, and Stat3 was heightened, while the Foxp1 expression was abated in the EP group (all P < 0.05); relative to the EP + inhibitor NC group, expression of miR-183, Jak1, Stat1, and Stat3 was inhibited, while Foxp1 expression was advanced in the EP + miR-183 inhibitor group (all P < 0.05); in contrast to the EP + oe-NC group, expression of Jak1, Stat1, and Stat3 was declined, while the expression of Foxp1 was elevated in the EP + oe-Foxp1 group (all P < 0.05); in comparison to the EP + miR-183 inhibitor + siRNA-NC group, expression of Jak1, Stat1, and Stat3 was amplified, while the Foxp1 expression was repressed in the EP + miR-183 inhibitor + siRNA-Foxp1 group (all P < 0.05).
Discussion
Performing as epileptic seizures, EP is the commonest severe nervous system disease [Citation22]. It has been identified that the miRNAs, which were characterized as small non-coding RNAs, played a critical role in leading molecules in the RNA silencing [Citation23]. Moreover, there were several researches implied that the mechanism of miR-183 might be associated with human diseases, including spinal muscular atrophy [Citation14] and neuroblastoma [Citation13]. Nevertheless, there is little known about miR-183, Foxp1, as well as the Jak/Stat signaling pathway in progression of EP. Consequently, this study was determined to explore the impacts of miR-183 and Foxp1 on EP by modulating the Jak/Stat signaling pathway, and we have found in this study that down-regulated miR-183 could mediate the Jak/Stat signaling pathway to attenuate hippocampal neuron injury in epilepsy rats via upregulating Foxp1.
Among the vital results in our research, one of them suggested that miR-183 was highly expressed in EP, implying that there was aberrant expression of miR-183 in EP. This dysregulation of miR-183 has also been identified in temporal lobe EP [Citation11] and other human disease, such as prostate cancer [Citation24]and human brain glioma [Citation12]. Furthermore, we have found in the results that Foxp1 performed a down-regulation in EP, and the down-regulation of Foxp1 was in line with that in neuroblastoma [Citation25]and primary mediastinal large B-cell lymphoma [Citation26]. What’s more, we have found that Foxp1 is the target gene of miR-183, and reduced miR-183 could elevate the expression of Foxp1, which is a new finding that has not been revealed in other studies. In addition, our research has illustrated that the Jak/Stat signaling pathway was activated in EP, and a similar result has been clarified in pilocarpine-induced status epilepticus by Grabenstatter et al. [Citation27]. Another important result of this research unraveled that inhibited miR-183 could alleviate hippocampal neuron injury in EP by promoting the expression of Foxp1. Similar to this result, evidence has been proved that the aberrant expression of miR-183 could abate hypoxia-induced H9c2 cell injury [Citation28]. Furthermore, we have found in the outcomes that the suppression of miR-183 and elevation of Foxp1 were able to inhibit apoptosis of neurons in EP. Consistent with this result, the down-regulation of Foxp1 was demonstrated to be able to promote apoptosis in human glioma [Citation29]. In addition, Bi et al. have illustrated in their study that miR-183 has the ability to repress apoptosis and accelerate the proliferation of colon cancer cell by regulating expression of ATP-binding cassette transporter A1 [Citation30], which is in line with another finding in our study that the down-regulation of miR-183 and the amplification of Foxp1 could promote the proliferation of hippocampus neurons in EP. Except for the last literature, we have found in an extant research that Foxp1 could regulate the proliferation as well as maturation of myocytes in cardiac development [Citation31]. Moreover, a recent research has also unearthed that overexpressed miR-183 has the ability to accelerate the proliferation in esophageal squamous cell carcinoma through targeting programmed cell death 4 [Citation32]. Finally, we have found in this research that the reduction of miR-183 could inactivate the Jak/Stat signaling pathway by elevating the expression of Foxp1. Similarly, Yang et al. have affirmed that miR-183 could function as a tumor repressor to modulate the activation of the lipoprotein receptor-related protein 6-Wnt/β-catenin signaling pathway in osteosarcoma [Citation33]. These data contributed to the recognition of the roles of miR-183 together with its target gene Foxp1 and their molecular mechanisms in EP.
To sum up, our study implies that inhibited miR-183 could up-regulate Foxp1, resulting in an inactivation of the Jak/Stat signaling pathway and promotion of cell proliferation, as well as inhibition of apoptosis of hippocampal neuron in EP rats, by which the hippocampal neuron injury and EP progression could be repressed. Nevertheless, more endeavors remained to ulteriorly explore the function mechanisms of miR-183 and Foxp1, and the Jak/Stat signaling pathway in the development of EP.
Ethical statement
This study was approved and supervised by the animal ethics committee of Affiliated hospital of zunyi medical university. The treatment of animals in all experiments conforms to the ethical standards of experimental animals.
Consent for publication
Not applicable.
Availability of data and material
Not applicable.
Authors’ contributions
Guarantor of integrity of the entire study: Xiangyong Feng
Study design: Wei Xiong, Mingqiong Yuan, Jian Zhan
Experimental studies: Xiankun Zhu, Zhijie Wei, Xidong Chen
Manuscript editing: Xianbing Cheng
Acknowledgments
We would like to acknowledge the reviewers for their helpful comments on this paper.
Disclosure statement
No potential conflict of interest was reported by the authors.
Related Research Data
References
- Moshe SL, Perucca E, Ryvlin P, et al. Epilepsy: new advances. Lancet. 2015;385(9971):884–898.
- Quintas R, Raggi A, Giovannetti AM, et al. Psychosocial difficulties in people with epilepsy: a systematic review of literature from 2005 until 2010. Epilepsy Behav. 2012;25(1):60–67.
- Meyer AC, Dua T, Ma J, et al. Global disparities in the epilepsy treatment gap: a systematic review. Bull World Health Organ. 2010;88(4):260–266.
- Hesdorffer DC, Ludvigsson P, Olafsson E, et al. ADHD as a risk factor for incident unprovoked seizures and epilepsy in children. Arch Gen Psychiatry. 2004;61(7):731–736.
- Bosak M, Turaj W, Dudek D, et al. Depressogenic medications and other risk factors for depression among Polish patients with epilepsy. Neuropsychiatr Dis Treat. 2015;11:2509–2517.
- Hesdorffer DC, Tian H, Anand K, et al. Socioeconomic status is a risk factor for epilepsy in Icelandic adults but not in children. Epilepsia. 2005;46(8):1297–1303.
- Martis RJ, ACHARYA UR, TAN JH, et al. Application of empirical mode decomposition (emd) for automated detection of epilepsy using EEG signals. Int J Neural Syst. 2012;22(6):1250027.
- Wang Y, Lin Y. Brain stimulation for epilepsy. Chin Med J (Engl). 2014;127(18):3201–3203.
- Guo J, Wang H, Wang Q, et al. Expression of p-CREB and activity-dependent miR-132 in temporal lobe epilepsy. Int J Clin Exp Med. 2014;7(5):1297–1306.
- Chen L, Zheng H, Zhang S. Involvement of up-regulation of miR-210 in a rat epilepsy model [Corrigendum][J]. Neuropsych Disease Treat. 2017;13:2003.
- Alsharafi W, Xiao B. Dynamic expression of MicroRNAs (183, 135a, 125b, 128, 30c and 27a) in the rat pilocarpine model and temporal lobe epilepsy patients. CNS Neurol Disord Drug Targets. 2015;14(8):1096–1102.
- Ye Z, Zhang Z, Wu L, et al. Upregulation of miR-183 expression and its clinical significance in human brain glioma. Neurol Sci. 2016;37(8):1341–1347.
- Lodrini M, Oehme I, Schroeder C, et al. MYCN and HDAC2 cooperate to repress miR-183 signaling in neuroblastoma. Nucleic Acids Res. 2013;41(12):6018–6033.
- Kye MJ, Niederst ED, Wertz MH, et al. SMN regulates axonal local translation via miR-183/mTOR pathway. Hum Mol Genet. 2014;23(23):6318–6331.
- Hu H, Wang B, Borde M, et al. Foxp1 is an essential transcriptional regulator of B cell development. Nat Immunol. 2006;7(8):819–826.
- Courts C, Brunn A, Montesinos-Rongen M, et al. Preferential expression of truncated isoforms of FOXP1 in primary central nervous system lymphoma. J Neuropathol Exp Neurol. 2009;68(9):972–976.
- Horn D, Kapeller J, Rivera-Brugués N, et al. Identification of FOXP1 deletions in three unrelated patients with mental retardation and significant speech and language deficits. Hum Mutat. 2010;31(11):E1851–60.
- Vainchenker W, Constantinescu SN. JAK/STAT signaling in hematological malignancies. Oncogene. 2013;32(21):2601–2613.
- Lund IV, Hu Y, Raol YH, et al. BDNF selectively regulates GABAA receptor transcription by activation of the JAK/STAT pathway. Sci Signal. 2008;1(41):ra9–ra9.
- Han CL, Ge M, Liu YP, et al. LncRNA H19 contributes to hippocampal glial cell activation via JAK/STAT signaling in a rat model of temporal lobe epilepsy. J Neuroinflammation. 2018;15(1):103.
- Ayuk SM, Abrahamse H, Houreld NN. The role of photobiomodulation on gene expression of cell adhesion molecules in diabetic wounded fibroblasts in vitro. J Photochem Photobiol B. 2016;161:368–374.
- Vezzani A, Fujinami RS, White HS, et al. Infections, inflammation and epilepsy. Acta Neuropathol. 2016;131(2):211–234.
- Ha M, Kim VN. Regulation of microRNA biogenesis. Nat Rev Mol Cell Biol. 2014;15(8):509–524.
- Larne O, Östling P, Haflidadóttir BS, et al. miR-183 in prostate cancer cells positively regulates synthesis and serum levels of prostate-specific antigen. Eur Urol. 2015;68(4):581–588.
- Ackermann S, Kocak H, Hero B, et al. FOXP1 inhibits cell growth and attenuates tumorigenicity of neuroblastoma. BMC Cancer. 2014;14:840.
- Gross V, Heinrich PC, Berg DV, et al. Circulatory life time and organ distribution of differently glycosylated forms (unglycosylated, high-mannose type, hybrid type, complex type) of rat alpha-1-acid glycoprotein. Prog Clin Biol Res. 1989;300:231–234.
- Grabenstatter HL, Del Angel YC, Carlsen J, et al. The effect of STAT3 inhibition on status epilepticus and subsequent spontaneous seizures in the pilocarpine model of acquired epilepsy. Neurobiol Dis. 2014;62:73–85.
- Gong L, Xu H, Chang H, et al. Knockdown of long non-coding RNA MEG3 protects H9c2 cells from hypoxia-induced injury by targeting microRNA-183. J Cell Biochem. 2018;119(2):1429–1440.
- Cui R, Guan Y, Sun C, et al. A tumor-suppressive microRNA, miR-504, inhibits cell proliferation and promotes apoptosis by targeting FOXP1 in human glioma. Cancer Lett. 2016;374(1):1–11.
- Bi DP, Yin C-H, Zhang X-Y, et al. MiR-183 functions as an oncogene by targeting ABCA1 in colon cancer. Oncol Rep. 2016;35(5):2873–2879.
- Wang B, Weidenfeld J, Lu MM, et al. Foxp1 regulates cardiac outflow tract, endocardial cushion morphogenesis and myocyte proliferation and maturation. Development. 2004;131(18):4477–4487.
- Ren LH, Chen W-X, Li S, et al. MicroRNA-183 promotes proliferation and invasion in oesophageal squamous cell carcinoma by targeting programmed cell death 4. Br J Cancer. 2014;111(10):2003–2013.
- Yang X, Wang L, Wang Q, et al. MiR-183 inhibits osteosarcoma cell growth and invasion by regulating LRP6-Wnt/beta-catenin signaling pathway. Biochem Biophys Res Commun. 2018;496(4):1197–1203.