
ABSTRACT
Retinoic acid inducible gene-I (Rig-I) has been well documented as a cytosolic pattern recognition receptor that can sense viral RNA ligands to initiate the interferon-mediated antiviral immunity. However, little is known about the biological behaviors of Rig-I devoid of viral infection. Herein, we investigated the roles of Rig-I in the regulation of cellular senescence. In comparison to wild-type counterparts, Rig-I-/- mice displayed the accelerated loss of hair, less responsiveness to gentle physical stimuli and shorten survival time. Likewise, Rig-I deficiency rendered mouse embryonic fibroblasts (MEFs) more susceptible to the serial passages-associated replicative senescence. By performing a transcriptome analysis, we identified integrins at the intersections of biological pathways affected by Rig-I. Among these, integrin β3 was negatively regulated by Rig-I, and significantly upregulated with the occurrence of senescence. Gene silencing of Itgb3 (encoding integrin β3) retarded the progression of cellular senescence in both WT and Rig-I-/- MEFs. Notably, this effect was more prominent in Rig-I-/- MEFs. Furthermore, p38 MAPK was a key downstream molecule for integrin β3-mediated senescence, and overactivated in senescent Rig-I-/- MEFs. Taken together, Rig-I deficiency contributes to cellular senescence through amplifying integrin β3/p38 MAPK signaling. Our findings provide the evidence that Rig-I is a key regulator of cellular senescence, which will be helpful in better understanding its function without viral infection.
Abbreviations: Rig-I: retinoic acid inducible gene-I; SASP: senescence-associated secretory phenotype; ECM: extracellular matrix; Itgb3: integrin beta 3; PRR: pattern recognition receptor; MEFs: mouse embryonic fibroblasts; Il-1β: interleukin-1 beta; Il-6: interleukin-6; Il-8: interleukin-8; Cxcl1: chemokine (C-X-C motif) ligand 1; Ccl2: chemokine (C-C motif) ligand 2; WT, wild type; BM: bone marrow; MAPK: mitogen-activated protein kinase; ERK: extracellular signal-regulated kinases; JNK: Jun N-terminal kinases; SA-β-gal: senescence-associated β-galactosidase; qPCR: quantitative reverse-transcription PCR; PBS: phosphate-buffered saline
Introduction
Cellular senescence represents a stable state of cell cycle arrest that cannot be reversed in response to mitogens [Citation1]. A variety of stimuli or stressors can drive cellular senescence through activating cell cycle inhibitors – RB/p16Ink4a and p53/p21Cip1, including telomere shortening, oxidative stress, DNA damage agents, oncogene action and tumor-suppressor gene loss [Citation2–Citation4]. Senescent cells are characterized by an enlarged and flattened cell morphology and the increased senescence-associated β-galactosidase (SA-β-gal) activity [Citation5]. Unlike apoptotic cells, senescent cells still remain metabolically and functionally active, and secrete a plethora of inflammatory proteins and matrix-degrading enzymes, collectively referred to as the senescence-associated secretory phenotype (SASP) [Citation6,Citation7]. The SASP recruits phagocytic immune cells and mediates the communication with their surrounding cells in a paracrine fashion [Citation8,Citation9]. Cellular senescence is an important hallmark of aging and age-related diseases, and its therapeutic intervention has emerged as a promising strategy for cancer, tissue repair and atrophic diseases.
Many extracellular matrix (ECM)-degrading enzymes are also markedly up-regulated in senescent cells, such as matrix metalloproteases (MMPs), tissue plasminogen activator (tPA) and plasminogen activator inhibitors (PAI), which result in the altered expression and organization of ECM components [Citation10]. Interestingly, the renewal with the ECM from young human fibroblasts was capable of restoring the senescent cells to a relatively youthful state [Citation11]. Integrins are the most common receptors that mediate the interactions between the cells and ECM [Citation12]. Ligand-bound integrins triggered cytoskeleton organization and multiple downstream signaling pathways, such as extracellular signal-regulated kinase, phosphatidylinositol 3-kinase, and MAPKs, to activate or cooperate with other cell signaling pathways [Citation13–Citation15]. CCN1, an ECM protein, can propel fibroblasts into senescence through binding to cell adhesion receptor – integrin α6β1 [Citation16]. In another study, ionizing radiation upregulated the phosphorylated levels of integrin β4, which subsequently activated the integrin α6β4-Src-AKT signaling pathway and induced cellular senescence in irradiated cancer cells [Citation17]. These studies suggest that the ECM-integrin interaction may play a critical role in regulating cellular senescence.
Retinoic acid inducible gene-I (Rig-I) was first identified in our laboratory in acute promyelocytic leukemia cells treated by all-trans-retinoic acid [Citation18]. Structurally, Rig-I primarily comprises two N-terminal caspase activation and recruitment domains (CARD), a DExD/H helicase core and a C-terminal regulatory domain (CTD) [Citation19]. Over the past two decades, most studies investigating Rig-I have focused on its antiviral function as a cytosolic pattern recognition receptor (PRR). Upon binding to viral RNAs, Rig-I unleashes the binding capacity of CARDs with IPS-1 to activate the IRF3/7 or NF-kB pathways [Citation20]. However, accumulating evidence suggested that Rig-I may also regulate multiple cellular behaviors, including proliferation, differentiation, apoptosis and stemness [Citation21–Citation26]. Some endogenous RNAs, such as various non-coding RNAs, can also be recognized by Rig-I, to facilitate therapy resistance and tumor cell proliferation [Citation21]. For another thing, RNA-unprimed Rig-I allows CARD and PxxP motif for the interaction with STAT1 or Src, by which restrains the tumorigenicity of host cells [Citation24,Citation26]. Briefly, Rig-I is a multifunctional protein beyond PRR although there are still a lot of additional works to be performed.
In this study, we observed that Rig-I deficiency lead to the premature aging phenotype in mice, and rendered mouse embryonic fibroblasts (MEFs) more susceptible to the serial passages-associated replicative senescence. We also identified integrin β3 as a key coordinator of cellular senescence. In detail, integrin β3 was negatively regulated by Rig-I, and Rig-I deficiency unfettered integrin β3/p38 MAPK signaling, which culminated in cell cycle inhibitors – p16Ink4a and p21Cip1 to accelerate the processes of senescence.
Results
Rig-I deficiency lead to the premature aging phenotype in mice
Using the previously established Rig-I-/- mouse model [Citation23,Citation27], some signs of aging were evaluated to investigate the roles of Rig-I in the aging processes. In comparison to wild type (WT) mice, Rig-I-/- mice showed the accelerated loss of hair (). Rig-I-/- mice were significantly less responsive to gentle physical stimuli than WT mice with the same age (). In addition, the survival time was markedly shortened in Rig-I-/- mice compared with that in WT mice (). Briefly, Rig-I deficiency lead to the premature aging phenotype in mice.
Figure 1. Rig-I deficiency lead to the premature aging phenotypes. (a) Representative image and summary data comparing the fur status of 52-week WT and Rig-I-/- mice. The mice were scored 0–4: 4 is fur seen in young WT mice, and 0 is most reduced. Left panels: representative images of 52-week WT and Rig-I-/- mice. Right panel: fur score in 52-week WT and Rig-I-/- mice (n = 8). (b) Summary data comparing the responsiveness to gentle physical stimuli in 52-week WT and Rig-I-/- mice (n = 8). The mice were scored 0–3: 3 is very active, and 0 is inactive. (c) Kaplan-Meier curves showing the cumulative survival rates of WT and Rig-I-/- mice (n = 16 and 18, respectively). (d–e) Representative dot plot and summary data comparing the percentage of Ki-67+ (d) or apoptotic (e) BM cells in WT and Rig-I-/- mice (n = 4). (f) Relative mRNA levels of Cdkn2a and Cdkn1a (encoding p16Ink4a and p21Cip1, respectively) by qPCR, and protein levels of p16Ink4a and p21Cip1 by Western blot in BM cells of 52-week WT and Rig-I-/- mice (n = 4). (g) Immunofluorescence staining for p16Ink4a in BM cells of 52-week WT and Rig-I-/- mice. (left panel: representative images for p16Ink4a staining; right panel: the percentage of p16Ink4a staining positive cells; Scale bars: 50 μm). (h) Relative mRNA levels of SASP (Il-1β, Il-6, Il-8, Ccl2 and Cxcl1) in BM cells of 52-week WT and Rig-I-/- mice (n = 4). (i) Relative mRNA levels of Cdkn2a and Cdkn1a (encoding p16Ink4a and p21Cip1, respectively) in the liver and kideny tissues of WT and Rig-I-/- mice (n = 4). *p < 0.05; **p < 0.01; ***p < 0.001
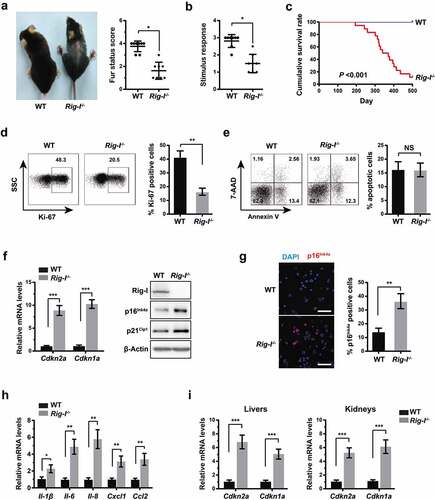
Aging are characterized by the increased accumulation of senescent cells [Citation28], and thus we further identified senescent cells in vivo. Rig-I-/- mice exhibited the decreased frequency of Ki-67+ bone marrow (BM) cells in comparison to WT mice, while the percentage of apoptotic cells was similar between them (). It is widely established that cell cycle inhibitors – p16Ink4a and p21Cip1 are two key factors that drive cell cycle arrest in senescent cells [Citation2]. Paralleled to the increased cell cycle arrest, the mRNA levels of Cdkn1a and Cdkn2a (encoding p16Ink4a and p21Cip1, respectively) by qPCR, and the protein levels of p16Ink4a and p21Cip1 by Western blot were also markedly upregulated in the BM cells of Rig-I-/- mice (). Immunofluorescence staining also denoted the increased proportion of p16Ink4a-expressing cells in the BM cells of Rig-I-/- mice (). Likewise, the upregulation of Cdkn1a and Cdkn2a mRNA was also observed in the liver and kidney tissues of Rig-I-/- mice (). Key elements of the SASP, including inflammatory cytokines – Il-1β and Il-6, and chemokines – Il-8, Cxcl1 and Ccl2 have been reported to enforce or exacerbate cellular senescence in an autocrine manner or through spreading to neighboring cells [Citation1]. In agreement with this, the mRNA levels of Il-1β, Il-6, Il-8, Cxcl1 and Ccl2 were significantly elevated in BM cells of Rig-I-/- mice compared with those in WT mice (). These results suggested the increased accumulation of senescent cells in Rig-I-/- mice.
Rig-I deficiency rendered MEFs more susceptible to the replicative senescence
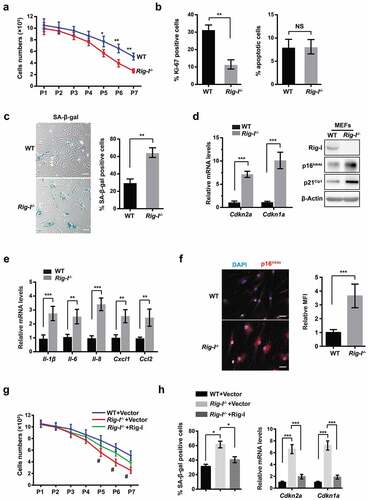
In order to assess the effects of Rig-I on aging-dependent proliferation, we established the replicative senescence models of WT and Rig-I-/- mouse embryonic fibroblasts (MEFs) after a limited number of passages. WT and Rig-I-/- MEFs were cultured in the same environment and passaged at 2 × 10⁵ cells in 3.5-cm dishes at 3‐day interval. Rig-I-/- MEFs proliferated similarly to WT MEFs at early passages (P1-4). Although WT MEFs still grew well, the growth rate of Rig-I-/- MEFs was gradually decreased from P5, and the cells almost ceased to proliferate at P7 (). Rig-I-/- MEFs had a significantly lower proportion of Ki-67+ cells than WT MEFs at P7, whereas the percentage of apoptotic cells was similar between them (), suggesting that the growth decline of Rig-I-/- MEFs should be attributed to the cell cycle arrest rather than apoptosis. Compared with WT MEFs, Rig-I-/- MEFs exhibited the more enlarged and flattened cell morphology, and the increased activity of senescence-associated β-galactosidase (SA-β-gal) (). With one accord, the mRNA levels of Cdkn1a and Cdkn2a by qPCR and the protein levels of p16Ink4a and p21Cip1 by Western blot were markedly upregulated in Rig-I-/- MEFs in comparison to those in WT MEFs (). Immunofluorescence staining also denoted the increased proportion of p16Ink4a-expressing cells in Rig-I-/- MEFs (). Moreover, the mRNA levels of SASP – Il-1β, Il-6, Il-8, Cxcl1 and Ccl2 were significantly elevated in Rig-I-/- MEFs (). To further investigate the roles of Rig-1 in cellular senescence, we transfected FLAG-Rig-I plasmid into Rig-I-/- MEFs. Rig-I re-expression significantly improved the growth rate of Rig-I-/- MEFs, accompanied by the reduction of SA-β-gal activity as well as Cdkn1a and Cdkn2a mRNA levels (,). Given this, Rig-I deficiency rendered MEFs more susceptible to the serial passages-associated replicative senescence.
Figure 2. Rig-I deficiency rendered MEFs more susceptible to the serial passages-associated replicative senescence. To assess the effects of Rig-I on aging-dependent proliferation, we established the replicative senescence models of WT and Rig-I-/- MEFs after a limited number of passages. (a) WT and Rig-I-/- MEFs were initially plated at 2 × 10⁵ cells and subcultured at 3‐day intervals, and the cell number counted at the same passages (from P1 to P7) (n = 4). (b) Percentage of Ki-67+ or apoptotic cells in WT and Rig-I-/- MEFs at P7 (n = 4). (c) Representative images and summary data comparing the activity of SA-β-Gal in WT and Rig-I-/- MEFs at P7 (n = 4, Scale bars: 50 μm). (d) Relative mRNA levels of Cdkn2a and Cdkn1a by qPCR, and protein levels of p16Ink4a and p21Cip1 by Western blot in BM cells of 52-week WT and Rig-I-/- mice (n = 4). (e) Relative mRNA levels of SASP – Il-6, Il-8, Il-1β, Ccl2 and Cxcl1 in WT and Rig-I-/- MEFs at P7 (n = 4). (f) Immunofluorescence staining for p16Ink4a in WT and Rig-I-/- MEFs at P7. (left panel: representative images for p16Ink4a staining; right panel: the percentage of p16Ink4a staining positive cells; Scale bars: 50 μm). (g) Growth curve of Rig-I-/- MEFs transduced with vector or Rig-I-expressing plasmid (n = 5). #p Rig-I-/- MEFs with vector versus Rig-I-/- MEFs with Rig-I-expressing plasmid. (h) Summary data comparing the percentage of SA‐β‐gal staining positive cells and the relative mRNA levels of Cdkn2a and Cdkn1a in Rig-I-/- MEFs transduced with vector or Rig-I-expressing plasmid (n = 4). *p < 0.05; **p < 0.01; ***p < 0.001
Integrin β3 was negatively regulated by Rig-I
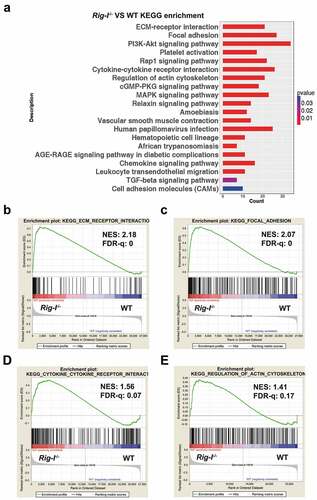
To acquire a comprehensive understanding of the signaling pathways that are affected by Rig-I, we undertook a transcriptome analysis in WT and Rig-I-/- bone marrow cells. Using the KEGG database, we found a significant enrichment of biological pathways related to the ECM-receptor interaction, focal adhesion, cytokine-cytokine receptor interaction and cytoskeleton regulation (). Broad Gene Set Enrichment Analysis (GSEA) and the Molecular Signatures Database revealed that Rig-I was negatively correlated with these pathways (–), and ).
Table 1. Top ranked gene sets enrichment analysis (GSEA) (False discovery rate (FDR) q-value <0.25)
Figure 3. Transcriptome analysis in the tissues of WT and Rig-I-/- mice. (a) KEGG analysis of 52-week WT and Rig-I-/- tissues showing the enrichment of signaling pathways affected by Rig-I. GSEA analysis for the differentially regulated pathways of Rig-I-/- versus WT BM cells, including ECM-receptor interaction (b), focal adhesion (c), cytokine-cytokine receptor interaction (d), actin cytoskeleton regulation (e). False discovery rate (FDR) q-value < 0.25
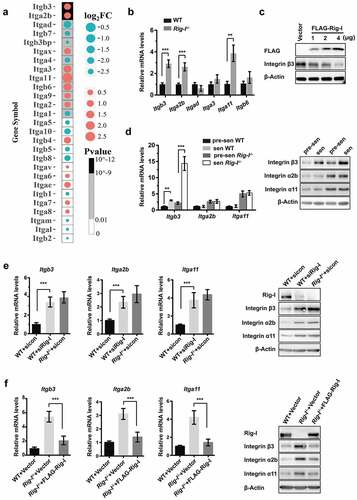
Integrins are at the intersections of biological pathways related to the ECM-receptor interaction, focal adhesion, cytoskeleton regulation and cell adhesion molecules. Hence, we analyzed the gene expression profile of integrins (). Among these, qPCR further demonstrated that the mRNA levels of Itgb3, Itga2b and Itga11 were significantly increased in the BM cells of Rig-I-/- mice (). Likewise, the mRNA and protein levels of Itgb3, Itga2b and Itga11 were obviously elevated in Rig-I-/- MEFs when compared with those in WT MEFs, irrespective of pre-senescent (P3) or senescent (P7) MEFs (). However, with the advent of senescence (from P3 to P7), only the expressions of Itgb3 were significantly upregulated in both WT and Rig-I-/- MEFs, suggesting that Itgb3 may be a potential regulator of cellular senescence. In order to demonstrate whether they can be regulated by Rig-I, we knocked down Rig-I in WT MEFs or re-overexpressed Rig-I in Rig-I-/- MEFs, respectively. Following Rig-I knockdown in WT MEFs by siRNA, the expressing levels of Itgb3, Itga2b and Itga11 were markedly upregulated (). In contrast, the transfection of Rig-I plasmids into Rig-I-/- MEFs inhibited the expressions of Itgb3, Itga2b and Itga11 again (). Notably, the protein levels of integrin β3 were negatively correlated with the concentrations of Rig-I plasmids into Rig-I-/- MEFs (). These results suggested that integrin β3 was negatively regulated by Rig-I.
Figure 4. Integrin β3 was negatively regulated by Rig-I. (a) Gene expression profile showing the differences of integrin subunits. Integrin subunits were ranked by the combination of fold change and P value. (b) Relative mRNA levels of Itgb3, Itga2b, Itgad, Itga3, Itga11 and Itgb6 in BM cells of 52-week WT and Rig-I-/- mice. (c) Western blot showing the protein levels of Itgb3 after transfecting FLAG-Rig-I plasmid into Rig-I-/- MEFs. (d) Relative mRNA levels and protein levels of Itgb3, Itga2b and Itgad in pre-senescent (P3) and senescent (P7) WT and Rig-I-/- MEFs. (e) Following Rig-I knockdown by siRNA in WT MEFs, qPCR and Western blot showing the expressing levels of Itgb3, Itga2b and Itga11. (f) Following Rig-I re-expression by transiently transfecting FLAG-Rig-I plasmid into Rig-I-/- MEFs, qPCR and Western blot showing the expressing levels of Itgb3, Itga2b and Itga11. *p < 0.05; **p < 0.01; ***p < 0.001
Rig-I deficiency accelerated the processes of senescence via integrin β3
With the occurrence of replicative senescence, Itgb3 expression was significantly upregulated, regardless of the presence or absence of Rig-I (). However, the expressing levels of Itgb3 were significantly higher in Rig-I-/- MEFs than those in WT MEFs at both P3 and P7. In order to determine its roles in the regulation of senescence, Itgb3 was knocked down by shRNA or overexpressed by transfecting Itgb3 lentiviral plasmid in WT and Rig-I-/- MEFs at P3, and the cells were further subcultured to P7 (,). Itgb3 mRNA ablation improved the growth rate of MEFs, which was more prominent in Rig-I-/- MEFs (). Gene silencing of Itgb3 significantly increased the proportion of Ki-67+ cells, but simultaneously restrained the accumulation of SA-β-gal staining positive cells (). In line with this, following Itgb3 mRNA silencing, the expressing levels of Cdkn1a and Cdkn2a were also obviously decreased in both WT and Rig-I-/- MEFs ().
Figure 5. Rig-I deficiency reinforced the integrin β3-mediated senescence. (a–c) WT and Rig-I-/- MEFs were transduced with vector or shRNA targeting Itgb3 (shItgb3) at P3, and then subcultured to P7. (a) Western blot showing the expressions of integrin β3 in WT and Rig-I-/- MEFs at P7. (b) Growth curve of WT and Rig-I-/- MEFs transduced with vector or shItgb3. *p WT MEFs + shItgb3 versus WT MEFs + Vector; #p Rig-I-/- MEFs + shItgb3 versus Rig-I-/- MEFs +Vector; n = 5. (c) Percentage of Ki-67+ and SA‐β‐gal staining positive cells, and relative mRNA levels of Cdkn2a and Cdkn1a in WT and Rig-I-/- MEFs at P7 (n = 4). (d–f) WT and Rig-I-/- MEFs were transduced with empty or Itgb3-expressing vector at P3, and then subcultured to P7. (d) Western blot showing the expressing levels of Itgb3 in WT and Rig-I-/- MEFs at P7. (e) Growth curve of WT and Rig-I-/- MEFs transduced with empty or Itgb3-expressing vector. *p WT MEFs + Itgb3 versus WT + Vector; #p Rig-I-/- MEFs +Itgb3 versus Rig-I-/- MEFs +Vector; n = 5. (f) Percentage of Ki-67+ and SA‐β‐gal staining positive cells, and relative mRNA levels of Cdkn2a and Cdkn1a in WT and Rig-I-/- MEFs at P7 (n = 4). *p < 0.05; **p < 0.01; ***p < 0.001
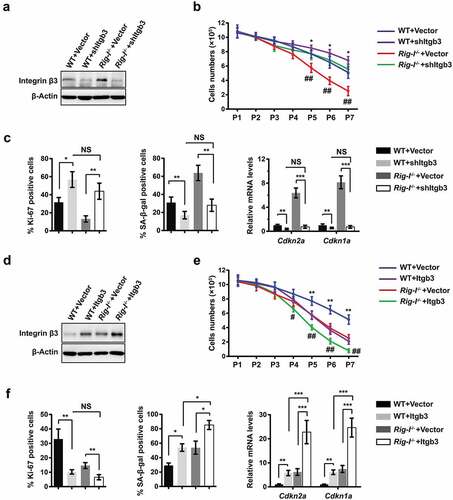
On the contrary, following Itgb3 overexpression, the growth rates were dramatically decreased in both WT and Rig-I-/- MEFs (). Itgb3 overexpression obviously decreased the proportion of Ki-67+ cells but increased the activity of SA-β-gal in both WT and Rig-I-/- MEFs (). Meanwhile, Itgb3 overexpression also lead to the upregulation of Cdkn1a and Cdkn2a mRNA. Our findings showed that Itgb3 was required for the induction of senescence, and Rig-I deficiency reinforced cellular senescence through unfettering integrin β3 signaling.
Rig-I deficiency reinforced senescence by activating the integrin β3/p38 MAPK signaling
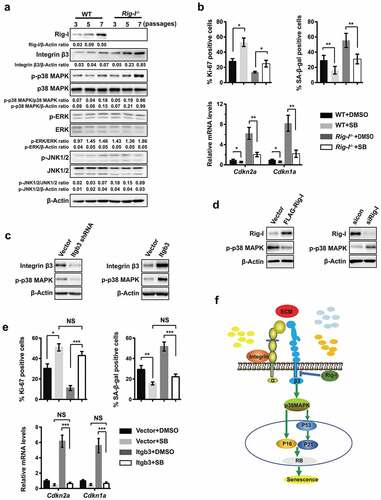
Mitogen-activated protein kinases (MAPKs) are shared by multiple cellular behaviors, including proliferation, senescence, differentiation, apoptosis and migration [Citation29]. MAPKs are also key coordinators of integrin β3-mediated signaling in the growth and metastasis of carcinoma [Citation30,Citation31]. The classical MAPKs include extracellular signal-regulated kinases (ERK), p38 MAPK and Jun N-terminal kinases (JNK) [Citation29]. Western blot was performed to identify which MAPK pathway was involved in the aging processes regulated by Rig-I. As cellular senescence occurred and progressed, p38 MAPK, but not ERK or JNK, was highly activated in both WT and Rig-I-/- MEFs (). Of note, the higher levels of phosphorylated-p38 MAPK were observed in senescent (P5 and P7) Rig-I-/- MEFs in comparison to WT MEFs. The treatment with p38 MAPK inhibitor – SB20190 improved the proliferative activity of WT and Rig-I-/- MEFs, as demonstrated by the upregulated Ki-67 expressions (). Meanwhile, the mRNA levels of Cdkn1a and Cdkn2a and SA-β-gal activity were obviously reduced in both WT and Rig-I-/- MEFs (). We further determined whether p38 MAPK was a downstream molecule for Rig-I or integrin β3. Following Itgb3 knockdown, the phosphorylated levels of p38 MAPK were obviously downregulated (). In contrast, Itgb3 overexpression resulted in the activation of p38 MAPK (). Moreover, gene silencing of Rig-I increased the phosphorylated levels of p38 MAPK in WT MEFs, whereas the re-expression of Rig-I inhibited the activation of p38 MAPK in Rig-I-/- MEFs (). We also overexpressed Itgb3 or inhibited the activation of p38 MAPK in WT MEFs to evaluate their synergistic effects on cellular senescence. Following p38 MAPK inhibition, the reduction of cell cycle inhibitors – Cdkn1a and Cdkn2a mRNA levels and SA-β-gal activity was observed in MEFs with or without Itgb3 overexpression (), suggesting the effects of Itgb3 overexpression could be reversed by p38 MAPK inhibitor. Together, p38 MAPK was crucial for the induction of senescence, and Rig-I deficiency amplified the p38 MAPK signaling via integrin β3 ().
Figure 6. p38 MAPK was crucial for the integrin β3-mediated senescence. (a) Lysates of WT and Rig-I-/- MEFs at the indicated passages (P3, P5 and P7) were analyzed for the expressions of Rig-I, integrin β3, and the activation of p38 MAPK, ERK1/2 (p42/p44) and JNK1/2 by Western blot. The signal intensity ratios are shown at the bottom of the relevant lanes. β-Actin was used as a loading control. (b) Following the treatment with DMSO or p38 MAPK inhibitor – SB202190 (SB, 10μM), summary data showing the percentage of Ki-67+ and SA‐β‐gal staining positive cells, and relative mRNA levels of Cdkn2a and Cdkn1a in WT and Rig-I-/- MEFs at P7 (n = 4). (c) Following Itgb3 knockdown (left) or overexpression (right) in WT MEFs, Western blot showing the protein levels of p-p38 MAPK. (d) Following Rig-I overexpression by transiently transfecting FLAG-Rig-I plasmid into Rig-I-/- MEFs (left) or Rig-I knockdown by siRNA in WT MEFs (right), Western blot showing the protein levels of p-p38 MAPK. (e) p38 MAPK inhibitor – SB20190 was added to WT MEFs transduced with empty or Itgb3-expressing vector. Summary data showing the percentage of Ki-67+ and SA‐β‐gal staining positive cells, and the relative mRNA levels of Cdkn2a and Cdkn1a in WT MEFs at P7 (n = 5). (f) A signaling pathway for the anti-senescence effects of Rig-I. Upon binding to ECM, integrin β3 triggers the phosphorylation of p38 MAPK, which further induces replicative senescence through activating cell cycle inhibitors – p16Ink4a and p21Cip1. In addition, integrin β3 is negatively regulated by Rig-I, and Rig-I deficiency unfetters integrin β3/p38 MAPK signaling to accelerate the processes of cellular senescence. *P < 0.05; **P < 0.01; ***P < 0.001
Discussion
Except for the innate immunity against viral infection, previous studies have revealed the crucial roles of Rig-I in promoting the differentiation of myeloid leukemia and normal hematopoietic cells, maintaining leukemic stemness, inducing therapy resistance and restricting the tumorigenesis of melanoma and hepatocellular carcinoma [Citation21–Citation26]. Our study also identified Rig-I as an important regulator of cellular senescence. Rig-I deficiency lead to the premature aging phenotype in mice, and rendered MEFs more susceptible to the replicative senescence. Importantly, Rig-I deficiency accelerated the aging processes through unfettering integrin β3/p38 MAPK signaling.
Rig-I has reported to be significantly downregulated in the tissues of acute myeloid leukemia and hepatocellular carcinoma [Citation26]. Mechanistically, Rig-I activation amplified the IFN-JAK-STAT pathway or fettered the AKT-mTOR signaling, thereby inhibiting the proliferation of tumor cells [Citation24,Citation26]. In our study, Rig-I deficiency resulted in the senescence of MEFs at the earlier passages and restrained the growth of MEFs. Therefore, Rig-I signaling may exert the dual effects on proliferation, which greatly depended on the contexts. Notably, Rig-I signaling can trigger the activation of NF-KB and caspase-1-dependent inflammasome, culminating in the secretion of various proinflammatory cytokines, such as IL-1β, IL-6 and IL-8 [Citation32]. Given this, the Rig-I-mediated inflammatory pathway may be exploited to promote the processes of cellular senescence, which could be suppressed by Klotho [Citation33]. Nevertheless, it is not contradictory to our results. Our previous studies also found that Rig-I was required for the differentiation of regulatory T and myeloid cells, and Rig-I deficiency would lead to the occurrence of spontaneous colitis, emphasizing the additional roles of Rig-I in maintaining the homeostasis of inflammation [Citation34]. Of note, Toll-like receptor signaling are also responsible for the production of IL-6 and IL-8 [Citation35], which may contribute to the SASP devoid of Rig-I.
Accumulating evidence suggested that the deregulation of integrin signaling was involved in fibrosis, senescence, and tumor development from initiation, invasion, metastasis, stemness, epithelial plasticity to therapeutic resistance [Citation36]. Our study showed that Itgb3 was significantly upregulated with the occurrence of senescence, and gene silencing of Itgb3 overcame the senescence caused by serial passages. Importantly, integrin β3 were negatively regulated by Rig-I, and Rig-I loss reinforced the integrin β3-mediated senescence. In line with this, integrin β3 was also upregulated in aging mice and CBX7 knockdown-induced cellular senescence, and integrin β3 silencing prevented human fibroblasts from senescence [Citation37]. However, Franovic et al. found that glioblastoma cells hijacked the integrin αvβ3/PAK4 signaling to escape senescence [Citation38]. In another study, vitronectin, a ligand for integrin avβ3, can counteract the pro-senescence effects of poorly degradable mutant collagen through the ECM-receptor interaction [Citation39]. The discrepant roles of integrin β3 may be attributed to the contexts during senescence activation, mirrored by pro- and anti-tumor effects of integrin signaling [Citation12].
The p38 MAPK pathway was initially identified as a mediator of inflammation and stress responses [Citation40]. Extensive studies highlighted the pivotal roles of the p38 MAPK pathway in mediating cellular senescence and tumor in a context-dependent manner [Citation41]. In detail, p38 MAPK was a common senescence-signaling pathway in response to telomere shortening, inappropriate culturing condition, oxidative stress and oncogene action [Citation42]. Furthermore, the p38 MAPK pathway was implicated in integrin β3 mediated-invasion and metastasis of breast cancer and colorectal carcinoma [Citation30,Citation31]. Herein, integrin β3 mediated cellular senescence via p38 MAPK, and Rig-I deficiency amplified the integrin β3/p38 MAPK signaling. It provided a supplementary to the study from Rapisarda et al [Citation37]., in which integrin β3 regulated senescence through releasing TGF-β in an autocrine fashion or activating TGF-β embedded in the ECM by matrix-degrading enzymes.
In summary, Rig-I deficiency reinforced cellular senescence through amplifying integrin β3/p38 MAPK signaling. Our findings identify Rig-I as a key regulator of cellular senescence, which will be helpful in better understanding its function devoid of viral infection.
Materials and methods
Animals
Rig-I-/- mice (C57BL/6) were generated as previously reported [Citation27]. Wild-type C57BL/6 mice were purchased from Vital River Laboratory Animal Technology Co., Ltd. (Beijing, China).
All mice were housed under specific pathogen–free conditions. All animal experiments were carried out in accordance with guidelines approved and provided by the Laboratory Animal Resource Center of Shanghai Jiao Tong University School of Medicine.
For fur status analysis, body hair was weighed with the same surface area. Fur density was ranged from 0–4 according to fur weight: 4 denotes normal, ≥90% mean value of young mice; 3 denotes mild fur loss, 70–90% mean value of young mice; 2 denotes moderate fur loss, 50–70% mean value of young mice; 1 denotes severe fur loss, 30–50% mean value of young mice; 0 denotes very patched, < 30% mean value of young mice. Physical stimulus evaluation was performed by a comprehensive analysis of touching sense/auditory sense/pain sense as previously described [Citation43]. The responsiveness was ranged from 0–3. 0 = very inactive; 1 = inactive; 2 = active; 3 = very active.
Cell culture
Mouse embryonic fibroblasts (MEFs) were isolated from WT and Rig-I-/- mouse embryos as previously described [Citation44]. The cells were cultured in Dulbecco’s modified Eagle’s medium with 10% fetal bovine serum and 1% antibiotic-antimycotic solution (Gibco, Invitrogen, USA).
SA-β-Gal staining
The SA-β-Gal staining of MEFs was performed using the commercial SA-β-Gal staining kit (C0602, Beyotime, Shanghai, China). Briefly, MEFs were fixed using the 4% paraformaldehyde for 15 mins and washed three times by phosphate-buffered saline (PBS). Then MEFs were incubated with freshly prepared SA-β-gal staining solution in 37°C CO2 free incubator overnight. Finally, the staining cells were observed under an Olympus microscope, and SA-β-Gal positive cells were stained blue (light or dark blue).
Immunofluorescence
The cells on glass coverslips were fixed with 4% paraformaldehyde, and then permeabilized using PBS containing 0.1% Triton X-100 (T-PBS). Subsequently, the cells were blocked for 30 mins with T-PBS containing 10% FCS and 1% HSA (IF-Buffer), and incubated overnight at 4°C with anti-p16 antibody (1:100 dilution, Sigma). After washing five times by T-PBS, secondary antibody – goat anti-rabbit Alexa Fluor 488 (1:100, Jackson ImmunoResearch) was added for 1 h at room temperature. Finally, DAPI (1 μg ml−1 Sigma-Aldrich) was used for counterstaining after washing five times by T-PBS. Staining evaluation was performed under a Leica TCS SP8 confocal microscope (Leica Microsystems, Wetzlar, Germany).
qRT-PCR and RNA-seq
Total RNA was extracted using the TRIzol reagent, and then reverse transcribed to cDNA. Quantitative reverse-transcription PCR (qRT-PCR) was performed on a real-time PCR system (Applied Biosystems 7500, USA) using SYBR® Premix Ex Taq kit (TakaraRR420A, Japan). The primers are listed in .
Table 2. Primer sequences
RNA-seq transcriptome library was prepared following TruSeqTM RNA sample preparation Kit from Illumina (San Diego, CA) using 1 μg of total RNA. For bioinformatics analysis, raw reads were filtered to obtain high-quality clean reads by removing sequencing adapters, short reads (length <35 bp) and low-quality reads using Cutadapt (v1.9.1) and Trimmomatic (v0.35). Then FastQC is used for ensure high reads quality. The clean reads were mapped to mouse genome (assembly Rnor_6.0) using the HISAT2 software. Differentially expressed genes were identified using R package DESeq2 (fold change ≥1.5, p < 0.05). SRA accession: PRJNA546095.
Western blot analysis
Western blotting assays were performed as previously described [Citation45]. Antibodies were used as follows: Rig-I (CST, #3743); p16 (abcam, #ab189034); p21 (abcam, #ab188224); p-ERK1/2 (CST, #9101); ERK1/2 (CST, #4695); p-p38MAPK (CST, #9216); p38MAPK (CST, #9212); p-JNK1/2 (CST, #9251; 1:1,000); JNK1/2 (CST, #9252); β-actin (Sigma, #A1978). Integrin-b3 (CST, # 4702).
Analysis of cell proliferation and apoptosis
The cells were washed twice by staining buffer. For cell proliferation assay, the cells were suspended and incubated with 1X fixation and permeabilization solution for 20 min on ice, washed three times with BD Perm/Wash™ Buffer, and stained with Ki-67 (BD, #565929) for 30 min on ice. Cell apoptosis was measured with an Annexin V-FITC Apoptosis Detection Kits (BD, #556547). Cells were resuspended with 1X binding buffer and stained with Annexin V and 7-Amino-Actinomycin D (7-AAD) (BD, #559925) for 15 min at room temperature in the dark. The stained cells were acquired on LSR II flow cytometer (Becton Dickinson, USA) and analyzed using FlowJo software (Treestar, Ashland, OR, USA).
RNA interference and retroviral transduction
For transient knockdown, the predesigned specific siRNA sequences (SANTA CRUZ, #sc-61481(siRig-I), and control siRNA) were used. The transfections of siRNAs were performed using Lipofectamine RNAiMAX Reagent (Invitrogen). For stable knockdown, Itgb3 shRNA was designed according to the online tools of Clonetech and cloned into a modified pLVX-shRNA plasmid (Clonetech, 632179). Then these retroviral vectors were packaged with Lenti-X 293T cells (Clonetech, 632180) for the transfection into MEFs. For stable overexpression, cDNA of Itgb3 was amplified by Pfu DNA Polymerase (Stratagene). MigR1 retroviral vector was obtained from Warren Pear (University of Pennsylvania, Philadelphia). For the preparation of retroviruses, the ecotropic packaging cells – Eco-Pack2–293 (Clontech) were transiently transfected with MigR1-Vector or MigR1-Itgb3 plasmid in the presence of Superfect Effectene Transfection Reagent (Sunmabio, China).
Reagents
SB202190 was purchased from Sigma-Aldrich (#S7067).
Statistical analysis
All data were analyzed with SPSS version 13.0 for Windows (IBM, New York, USA). Results are presented as the mean ± standard deviation (SD), and comparisons between two groups were performed using Student’s t tests for continuous variables or Mann-Whitney U test for ordinal variables. The cumulative survival rates of WT and Rig-I-/- mice were estimated using the Kaplan-Meier method and compared using the log-rank test. P < 0.05 was considered statistically significant.
Author contributions
Junmei Zhao and Xinyi Jiang performed the majority of experiments; Junmei Zhao analyzed the data and drafted this manuscript; Li Yan, Jian Lin, Hezhou Guo, Shanhe Yu and Baixin Ye performed a part of experiments; Jiang Zhu revised the manuscript for important intellectual content; Wu Zhang conceived and designed this study. All authors approved the final version of the manuscript.
Disclosure statement
No potential conflict of interest was reported by the authors.
Additional information
Funding
References
- Calcinotto A, Kohli J, Zagato E, et al. Cellular senescence: aging, cancer, and injury. Physiol Rev. 2019;99(2):1047–1078.
- Munoz-Espin D, Serrano M. Cellular senescence: from physiology to pathology. Nat Rev Mol Cell Biol. 2014;15(7):482–496.
- Serrano M, Lin AW, McCurrach ME, et al. Oncogenic ras provokes premature cell senescence associated with accumulation of p53 and p16INK4a. Cell. 1997;88(5):593–602.
- Passos JF, Saretzki G, von Zglinicki T. DNA damage in telomeres and mitochondria during cellular senescence: is there a connection? Nucleic Acids Res. 2007;35(22):7505–7513.
- Dimri GP, Lee X, Basile G, et al. A biomarker that identifies senescent human cells in culture and in aging skin in vivo. Proc Natl Acad Sci U S A. 1995;92(20):9363–9367.
- Coppe JP, Patil CK, Rodier F, et al. Senescence-associated secretory phenotypes reveal cell-nonautonomous functions of oncogenic RAS and the p53 tumor suppressor. PLoS Biol. 2008;6(12):2853–2868.
- Campisi J, d’Adda Di Fagagna F. Cellular senescence: when bad things happen to good cells. Nat Rev Mol Cell Biol. 2007;8(9):729–740.
- de Keizer PL. The fountain of youth by targeting senescent cells? Trends Mol Med. 2017;23(1):6–17.
- Young AR, Narita M. SASP reflects senescence. EMBO Rep. 2009;10(3):228–230.
- Mavrogonatou E, Pratsinis H, Papadopoulou A, et al. Extracellular matrix alterations in senescent cells and their significance in tissue homeostasis. Matrix Biol. 2019;75–76:27–42.
- Choi HR, Cho KA, Kang HT, et al. Restoration of senescent human diploid fibroblasts by modulation of the extracellular matrix. Aging Cell. 2011;10(1):148–157.
- Cooper J, Giancotti FG. Integrin signaling in cancer: mechanotransduction, stemness, epithelial plasticity, and therapeutic resistance. Cancer Cell. 2019;35(3):347–367.
- Su X, Esser AK, Amend SR, et al. Antagonizing Integrin beta3 Increases Immunosuppression in Cancer. Cancer Res. 2016;76(12):3484–3495.
- Wang R, Li ZQ, Han X, et al. Integrin beta3 and its ligand regulate the expression of uPA through p38 MAPK in breast cancer. APMIS. 2010;118(12):909–917.
- Cabodi S, Del Pilar Camacho-Leal M, Di Stefano P, et al. Integrin signalling adaptors: not only figurants in the cancer story. Nat Rev Cancer. 2010;10(12):858–870.
- Jun JI, Lau LF. The matricellular protein CCN1 induces fibroblast senescence and restricts fibrosis in cutaneous wound healing. Nat Cell Biol. 2010;12(7):676–685.
- Jung SH, Lee M, Park HA, et al. Integrin alpha6beta4-Src-AKT signaling induces cellular senescence by counteracting apoptosis in irradiated tumor cells and tissues. Cell Death Differ. 2019;26(2):245–259.
- Liu TX, Zhang JW, Tao J, et al. Gene expression networks underlying retinoic acid-induced differentiation of acute promyelocytic leukemia cells. Blood. 2000;96(4):1496–1504.
- Peisley A, Wu B, Xu H, et al. Structural basis for ubiquitin-mediated antiviral signal activation by RIG-I. Nature. 2014;509(7498):110–114.
- Yoneyama M, Kikuchi M, Natsukawa T, et al. The RNA helicase RIG-I has an essential function in double-stranded RNA-induced innate antiviral responses. Nat Immunol. 2004;5(7):730–737.
- Xu XX, Wan H, Nie L, et al. RIG-I: a multifunctional protein beyond a pattern recognition receptor. Protein Cell. 2018;9(3):246–253.
- Jiang LJ, Zhang NN, Ding F, et al. RA-inducible gene-I induction augments STAT1 activation to inhibit leukemia cell proliferation. Proc Natl Acad Sci U S A. 2011;108(5):1897–1902.
- Zhang NN, Shen SH, Jiang LJ, et al. RIG-I plays a critical role in negatively regulating granulocytic proliferation. Proc Natl Acad Sci U S A. 2008;105(30):10553–10558.
- Li XY, Jiang LJ, Chen L, et al. RIG-I modulates Src-mediated AKT activation to restrain leukemic stemness. Mol Cell. 2014;53(3):407–419.
- Szabo A, Fekete T, Koncz G, et al. RIG-I inhibits the MAPK-dependent proliferation of BRAF mutant melanoma cells via MKP-1. Cell Signal. 2016;28(5):335–347.
- Hou J, Zhou Y, Zheng Y, et al. Hepatic RIG-I predicts survival and interferon-alpha therapeutic response in hepatocellular carcinoma. Cancer Cell. 2014;25(1):49–63.
- Wang Y, Zhang HX, Sun YP, et al. Rig-I-/- mice develop colitis associated with downregulation of G alpha i2. Cell Res. 2007;17(10):858–868.
- Childs BG, Durik M, Baker DJ, et al. Cellular senescence in aging and age-related disease: from mechanisms to therapy. Nat Med. 2015;21(12):1424–1435.
- Sun Y, Liu WZ, Liu T, et al. Signaling pathway of MAPK/ERK in cell proliferation, differentiation, migration, senescence and apoptosis. J Recept Signal Transduct Res. 2015;35(6):600–604.
- Yang MH, Zhao L, Wang L, et al. Nuclear lncRNA HOXD-AS1 suppresses colorectal carcinoma growth and metastasis via inhibiting HOXD3-induced integrin beta3 transcriptional activating and MAPK/AKT signalling. Mol Cancer. 2019;18(1):31.
- Wen S, Hou Y, Fu L, et al. Cancer-associated fibroblast (CAF)-derived IL32 promotes breast cancer cell invasion and metastasis via integrin beta3-p38 MAPK signalling. Cancer Lett. 2019;442:320–332.
- Loo YM, Gale M Jr. Immune signaling by RIG-I-like receptors. Immunity. 2011;34(5):680–692.
- Liu F, Wu S, Ren H, et al. Klotho suppresses RIG-I-mediated senescence-associated inflammation. Nat Cell Biol. 2011;13(3):254–262.
- Yang H, Guo HZ, Li XY, et al. Viral RNA-unprimed Rig-I restrains Stat3 activation in the modulation of regulatory T Cell/Th17 cell balance. J Immunol (baltimore, Md: 1950). 2017;199(1):119–128.
- Kawasaki T, Kawai T. Toll-like receptor signaling pathways. Front Immunol. 2014;5:461.
- Legate KR, Wickstrom SA, Fassler R. Genetic and cell biological analysis of integrin outside-in signaling. Genes Dev. 2009;23(4):397–418.
- Rapisarda V, Borghesan M, Miguela V, et al. Integrin beta 3 regulates cellular senescence by activating the TGF-beta pathway. Cell Rep. 2017;18(10):2480–2493.
- Franovic A, Elliott KC, Seguin L, et al. Glioblastomas require integrin alphavbeta3/PAK4 signaling to escape senescence. Cancer Res. 2015;75(21):4466–4473.
- Vafaie F, Yin H, O’Neil C, et al. Collagenase-resistant collagen promotes mouse aging and vascular cell senescence. Aging Cell. 2014;13(1):121–130.
- Ono K, Han J. The p38 signal transduction pathway: activation and function. Cell Signal. 2000;12(1):1–13.
- Xu Y, Li N, Xiang R, et al. Emerging roles of the p38 MAPK and PI3K/AKT/mTOR pathways in oncogene-induced senescence. Trends Biochem Sci. 2014;39(6):268–276.
- Iwasa H, Han J, Ishikawa F. Mitogen-activated protein kinase p38 defines the common senescence-signalling pathway. Genes Cells. 2003;8(2):131–144.
- Baar MP, Brandt RMC, Putavet DA, et al. Targeted apoptosis of senescent cells restores tissue homeostasis in response to chemotoxicity and aging. Cell. 2017;169(1):132–147.e116.
- Xu J. Preparation, culture, and immortalization of mouse embryonic fibroblasts. Curr Protoc Mol Biol. 2005;70:28.1.1–28.1.8. Chapter 28(Unit 28.21).
- Zhang W, Zhao JM, Lin J, et al. Adaptive fibrogenic reprogramming of osteosarcoma stem cells promotes metastatic growth. Cell Rep. 2018;24(5):1266–1277.e1265.