
ABSTRACT
This study aimed to investigate the correlation of C-X-C chemokine receptor 2 (CXCR2) with clinicopathological characteristics and survival in non-small cell lung cancer (NSCLC) patients and further explore its effect on proliferation, apoptosis, invasion, stemness, chemosensitivity as well as JAK2/STAT3 pathway in NSCLC cells. The expression of CXCR2 in tumor tissues and adjacent tissues from 340 NSCLC patients received surgery was detected by immunohistochemistry. CXCR2 overexpression and knockdown were constructed through plasmid transfection and the effect of CXCR2 dysregulation on cell proliferation, apoptosis, invasion, stemness, chemosensitivity as well as its regulatory effect on JAK2/STAT signaling pathway was assessed in NCI-H1437 cells and NCI-H1299 cells. CXCR2 expression was higher in tumor tissues than that in paired adjacent tissues, and it was correlated with poor pathological differentiation, greater tumor size, lymph node metastasis, higher TNM stage and poor survival in NSCLC patients. In vitro, CXCR2 expression was increased in human NSCLC cell lines compared with human normal lung bronchus epithelial cells. CXCR2 promoted cell proliferation and invasion, while suppressed cell apoptosis in NCI-H1437/NCI-H1299 cells. Additionally, CXCR2 increased CD133+ cell rate and cell sphere-forming ability, while reduced chemosensitivity to cisplatin and gemcitabine in NCI-H1437/NCI-H1299 cells. Besides, CXCR2 activated the JAK2/STAT3 signaling pathway in NCI-H1437/NCI-H1299 cells. In conclusion, the clinical implication and the molecular function of CXCR2 discovered in our study reveal the potential of CXCR2 as a future target for disease monitoring and treatment of NSCLC.
1 Introduction
Non-small cell lung cancer (NSCLC) accounts for roughly 85% of lung cancer cases, which is the leading cause of cancer-related deaths [Citation1]. According to the histological classification, NSCLC includes lung adenocarcinoma, lung squamous cell carcinoma and large cell lung cancer subtypes [Citation2]. The therapeutic options for NSCLC patients have experienced a remarkable growth in the past decade with the advances in surgery, chemotherapy, targeted therapy, and radiotherapy. To note that the molecular targeting therapy has made great progress in personalized treatment [Citation3]. However, the prognosis of NSCLC patients is still poor with the 5-year survival rate of 30–50% [Citation4]. At early stage, lack of apparent symptom and late diagnosis contribute to the unfavorable survival, and for advanced NSCLC patients, resistance to drugs and high metastasis rate are the main causes of disease deterioration and treatment failure [Citation5]. Therefore, it is an urgent need to further investigate the novel molecular mechanism in the development and progression of NSCLC in order to discover new factors underlying the prognosis and potential treatment targets of NSCLC.
Chemokines are pro-inflammatory polypeptide cytokines that activate and attract certain cells under pathological conditions including inflammation, infection, allergy as well as malignancy [Citation6]. Specific expressions of chemokine receptors play pivotal roles in various aspects of carcinogenesis such as tumor cell growth, survival, migration, and angiogenesis [Citation7,Citation8]. For instance, C-X-C chemokine receptor (CXCR) 7 (CXCR7) contributes to the survival of KRAS-driven lung cancer cells and targeting CXCR7 along with epidermal growth factor receptor (EGFR) inhibited MAPK signaling pathway as well as cell growth [Citation9]. In addition, high-level CXCR4 expression correlates with brain metastasis of NSCLC after resection [Citation10]. As for CXCR2, a key member of chemokine receptors, it binds CXC chemokines with ELR+ motif that attracts leukocytes and lymphocytes to inflammatory sites or secondary lymphoid organs [Citation11]. In animal experiments, CXCR2 knockout mice injected with murine breast cancer cells present reduced tumor growth and osteolysis compared with the wild type control mice [Citation12]. Regarding clinical studies, CXCR2 is proven to be associated with advanced pathological grade, higher recurrence and poor survival in clear-cell renal cell carcinoma [Citation13]. In addition, the tumorigenic effect of CXCR2 is also implicated in hepatocellular carcinoma, papillary thyroid carcinoma, gastric carcinoma, etc. [Citation11,Citation13–Citation16].
As for NSCLC, the implication of CXCR2 is rarely reported, and only one study exhibits that CXCR2 is correlated with lymph node metastasis in NSCLC patients [Citation17]. Besides, our preliminary study discovered that CXCR2 was overexpressed in both tumor tissues and cell lines of NSCLC, which promotes NSCLC cell proliferation. Combining the known oncogenic effect of CXCR2 in other solid tumors, we hypothesized that CXCR2 might correlate with poor clinicopathological features and promote tumorigenesis in NSCLC as well. Therefore, this study aimed to investigate the correlation of CXCR2 with clinicopathological properties and survival profiles in NSCLC patients, and further explored its effect on proliferation, apoptosis, invasion, stemness, chemosensitivity as well as JAK2/STAT3 pathway in NSCLC cells.
2 Materials and methods
2.1 Clinical investigation
2.1.1 Patients
Three hundred and forty NSCLC patients who received surgical therapy in our hospital from January 2012 to December 2014 were analyzed in this study. The screening criteria included (i) clinically and histologically diagnosis of primary NSCLC; (ii) underwent surgical resection; (iii) no neoadjuvant or preoperative chemotherapy; (iv) resected specimens of tumor tissue and paired adjacent tissue were appropriately preserved and available for immunohistochemistry (IHC) assay; (v) clinical and follow-up data were complete; (vi) no other concurrent tumors; (vii) no infection with human immunodeficiency virus. This study was approved by the Institutional Review Board of our hospital, written informed consents or verbal informed consents with tape recording were collected from all patients or their guardians.
2.1.2 Data extraction and follow-up
Clinical data were extracted from electronic medical record system of our hospital, including age, gender, smoke, drink, pathological differentiation, tumor size, lymph node metastasis, Tumor-node-metastasis (TNM) stage, and carcinoembryonic antigen (CEA) level. TNM stage was assessed according to the Union for International Cancer Control (UICC) system (7th edition). After resection, based on the surgical margin status, clinical status and TNM stage, patients were treated with reresection or other adjuvant therapy including chemotherapy, radiation therapy, and chemoradiation according to the NSCLC guidelines. In addition, patients’ follow-up records were reviewed, and the disease-free survival (DFS) as well as overall survival (OS) were evaluated with the last follow-up date of 2019/3/21 (median follow-up duration was 48.0 months). DFS was calculated from the date of resection until the date of relapse or death, and patients not known to have relapsed or died at last follow-up were censored on the date of their last examination. OS was calculated from the date of resection to the date of death, and patients not known to have died at last follow-up were censored on the date they were last known to be alive.
2.1.3 CXCR2 expression by IHC assay
The specimens of tumor tissue and paired adjacent tissue were collected from Pathology Department of our hospital after approval, which were obtained from surgical resection and fixed in 10% formalin and embedded in paraffin wax. The expression of CXCR2 in the specimens was assessed by IHC. The rabbit polyclonal to CXCR2 (Abcam, UK) was used as primary antibody, and horseradish peroxidase-conjugated goat anti-rabbit immunoglobulin G antibody (Abcam, UK) was applied as the secondary antibody. Briefly, IHC was performed as follows: specimens were sliced into 4 µm sections, then were deparaffinized using xylene and rehydrated in graded ethanol. Next, antigen retrieval was performed with retrieval buffer, and the blocking of endogenous peroxidase activity was carried out using H2O2. Subsequently, the sections were incubated with 0.025% Triton X-100 (Sigma-Aldrich, USA) followed by 10% normal goat serum (Sigma-Aldrich, USA). Afterward, the sections were incubated overnight with primary antibody followed by the secondary antibody. Finally, the tissue sections were stained with diaminobenzidine (DAB) (Dako, USA), counterstained with hematoxylin (Sigma-Aldrich, USA), sealed with neutral resin (Sango Biotech, China) and observed on an optical microscope. The expression of CXCR2 in the specimens was evaluated using a semi-quantitative score according to the average intensity and density of positively stained tumor cells by IHC [Citation18]. The intensity of positively stained tumor cells was scored as follows: 0 = no staining, 1 = weak staining, 2 = moderate staining and 3 = strong staining; The density of positively stained tumor cells was scored as: 0, 0%; 1, <25%; 2, 26 ~ 50%; 3, 51 ~ 75%; 4, >75%. The total IHC semi-quantitative score was calculated by multiplying intensity score and density score. Total IHC semi-quantitative score >3 was defined as CXCR2 high expression, correspondingly, total IHC semi-quantitative score ≤3 was defined as CXCR2 low expression.
2.2 In vitro experiments
2.2.1 Cell culture
All cell lines including human NSCLC cell lines NCI-H650, NCI-H1299, NCI-H1437, A549 and human normal lung bronchus epithelial cell line BEAS-2B were purchased from American Typical Culture Collection (Manassas, Virginia). NCI-H650, NCI-H1299, NCI-H1437 cells were cultured in 90% Roswell Park Memorial Institute (RPMI) 1640 Medium (Gibco, USA) with 10% fetal bovine serum (FBS) (Gibco, USA). A549 cells were cultured in Ham’s F-12K (Kaighn’s) Medium (Gibco, USA) with 10% FBS (Gibco, USA). BEAS-2B cells were cultured in Bronchial Epithelial Cell Growth Basal Medium (Clonetics, Switzerland). All cells were maintained in a humidified atmosphere of 95% air and 5% CO2 at 37°C.
2.2.2 Detection of CXCR2 in cell lines
Reverse transcription-quantitative polymerase chain reaction (RT-qPCR) and western blot were carried out to assess the mRNA and protein expressions of CXCR2 in human NSCLC cell lines and BEAS-2B cell line (served as control).
2.2.3 Transfection and detection
The overexpression plasmid and the knockdown plasmid were constructed by Shanghai QeeJen Bio-Tech Co., Ltd (Shanghai, China). The overexpression plasmids (including control overexpression plasmid and CXCR2 overexpression plasmid) were constructed with the use of pCDNA 3.1, and the knockdown plasmids (including control knock-down plasmid and CXCR2 knockdown plasmid) were constructed with the use of pRNAT-U6.1/Neo vector. The constructed plasmids were transfected into NCI-H1437 and NCI-H1299 cells using HilyMax (Dojindo, Japan). The cells transfected with the control overexpression plasmid and the CXCR2 overexpression plasmid were named as OE-NC group and OE-CXCR2 group, respectively. And the cells transfected with control knockdown plasmid and CXCR2 knockdown plasmid were named as KD-NC group and KD-CXCR2 group, respectively. At 24 h after transfection, the mRNA and protein expressions of CXCR2 in cells were detected by RT-qPCR and western blot, and the cell invasive ability was detected by the transwell assay; at 48 h after transfection, the cell apoptosis rate was determined by the AV/PI assay and assessing the expressions of apoptotic markers (C-Caspase3 and Bcl-2) via western blot assay, and the expression of CD133, a cancer stem cells (CSCs) marker, was detected by the flow cytometry; at 0 h, 24 h, 48 h, and 72 h after transfection, the cell proliferation was determined by the CCK-8 assay. The detailed procedures of different assays were described below.
2.2.4 Sphere formation assay
At 24 h after transfection, cells in OE-NC group, OE-CXCR2 group, KD-NC group, and KD-CXCR2 group were cultured in sphere formation medium for 10 days. The DMEM/F12 Medium (Gibco, USA) was used as sphere formation medium, which contained 2% B27 (Gibco, USA), 20 ng/ml EGF (Sigma, USA), 20 ng/ml bFGF (Gibco, USA) and 4 μg/ml heparin (Sigma, USA). Spheres with diameter >50 μm were counted under microscope (Nikon, Japan). Sphere formation efficiency in four groups was calculated by number of >50 μm spheres dividing the total seeded cells*1000/1000.
2.2.5 Extreme limiting dilution analysis (ELDA) assay
At 24 h after transfection, different numbers (1000, 100, 10) of cells in OE-NC group, OE-CXCR2 group, KD-NC group, and KD-CXCR2 group were seeded into 24-well plate and cultured for 10 days. Every number of cells was plated 24 wells. After 10-day culture, the number of wells containing sphere with >50 μm diameter was counted in each group and analyzed with ELDA software (http://bioinf.wehi.edu.au/software/elda/).
2.2.6 Cisplatin and gemcitabine sensitivity detection
Cisplatin (Sigma, USA) was dissolved in phosphate buffer saline (PBS) to obtain final concentrations of 1 μM, 2 μM, 4 μM, 8 μM, 16 μM and 32 μM store solution. Gemcitabine (Sigma, USA) was dissolved in DMSO to obtain final concentrations of 2 μΜ, 4 μΜ, 8 μΜ, 16 μΜ, 32 μΜ, and 64 μΜ store solutions. Cisplatin and gemcitabine store solutions were freshly prepared before use. At 24 h after transfection, cells in OE-NC group, OE-CXCR2 group, KD-NC group, and KD-CXCR2 group were plated in 96-well and cultured with 1:1000 cisplatin or gemcitabine store solution for additional 24 h, respectively. After that, the cell viability was determined by CCK-8 assay, and the relative cell viability (%) was calculated by setting corresponding untreated controls (0 μM drug) as 100%. Then, 50% inhibitory concentration (IC50) of each drug in four groups was, respectively, calculated.
2.2.7 Pathway analysis
According to Kyoto Encyclopedia of Genes and Genomes (KEGG) PATHWAY Database (www.kegg.jp/kegg/pathway.html), JAK2/STAT3 pathway was regulated by CXCR2. Activation of the CXCLs/CXCR2 axis stimulated the JAK2/STAT3 pathway and regulated cell survival and migration [Citation19,Citation20]. Hence, at 24 h after transfection, JAK2 mRNA expression in OE-NC group, OE-CXCR2 group, KD-NC group, and KD-CXCR2 group was detected by the RT-qPCR, and the protein expressions of JAK2, STAT3 and phosphorylated STAT3 (P-STAT3) were determined by western blot.
2.2.8 Rt-qPCR
Total RNA was extracted by TRIzol reagent (Thermo, USA), and complementary DNA was synthesized by RT-PCR Quick Master Mix (Toyobo, Japan). SYBR® Green Realtime PCR Master Mix (Toyobo, Japan) was then used for qPCR and CXCR2 or JAK2 expression was calculated using 2−ΔΔCt method with GAPDH as internal reference. The primers used are listed in Supplementary Table 1.
2.2.9 Western blot
Total protein was extracted using RIPA Lysis Buffer (Sigma, USA) and quantified using Bicinchoninic Acid Kit for Protein Determination (Sigma, USA). Protein then underwent electrophoresis and was transferred to PVDF membrane (Millipore, Germany). Afterward, the PVDF membrane was incubated with primary antibodies overnight, and then secondary antibodies for 1 h. The antibodies used are listed in Supplementary Table 2. The protein bands were visualized usingaEasyBlot ECL kit (Beyotime, USA) and imaged by x-ray film (Kodak, USA). The gray value of western bolt bands was detected by Image J Software (NIH, USA). The protein relative expression was calculated by dividing the gray value of target protein by the gray value of GAPDH.
2.2.10 CCK-8 assay
Cells were treated with Cell Counting Kit-8 (Dojindo, Japan) following the manufacturer’s instruction and incubated in the mixture of 95% air and 5% CO2 at 37°C for 2 h. Cell proliferation ability was measured using microplate reader (BioTek, USA).
2.2.11 AV/PI assay
Cells were treated with Annexin V-FITC Apoptosis Detection Kit (R&D, USA) following the manufacturer’s instruction. Cell apoptosis was then analyzed by using CytoFLEX (Beckman, USA). Data were analyzed using Flowjo Software 7.6 (FlowJo-LLC, USA).
2.2.12. Transwell assay
The chamber (Costar, USA) with Matrigel basement membrane matrix (BD, USA) was firstly fully hydrated. 200 ul of serum-free medium with 4 × 10⁴ cells were then seeded to the upper chamber and 500 μl 10% FBS-containing medium was used to fill the lower chamber. After 24 h incubation, matrix in upper chamber was wiped and fixed with 4% formaldehyde, and then stained with crystal violet (Sigma, USA). Subsequently, microscope (Nikon, Japan) was used for observation and imaging.
2.2.13 CD133 detection by flow cytometry
At 24 h after transfection, cells in OE-NC group, OE-CXCR2 group, KD-NC group, and KD-CXCR2 group were harvested, counted and washed with incubated buffer. Then, cells were incubated with Alexa Fluor® 488 Conjugated mouse anti-CD133 antibody (CST, USA) in dark at 37℃ for 1 h. After washed with incubation buffer and re-suspended in PBS, cells were detected with a CytoFLEX (Beckman, USA) and analyzed with Flowjo Software 7.6 (FlowJo-LLC, USA).
2.3 Statistical analysis
SPSS 21.0 statistical software (IBM, USA) was used for data analysis, and the GraphPad Prism 7.02 software (GraphPad Software Inc., USA) was applied for graph construction. Quantitative data were expressed as mean and standard deviation (SD), and count data were displayed as count (percentage). Between independent samples, the comparison of quantitative data was determined by the independent sample’s t-test, and the comparison of count data was determined by Chi-square test or Wilcoxon rank-sum test; between paired-samples, the comparison of quantitative data was determined by the paired-sample’s t-test, and the comparison of count data was determined by McNemar test. The multiple comparisons of quantitative data between independent samples were examined by Dunnett’s t-test. The Kaplan–Meier curves were plotted to show the profiles of DFS and OS between subgroups, and the log-rank test was applied to determine the difference of DFS and OS between subgroups. Univariate and multivariate Cox’s proportional hazards regression analyses were used to assess the factors affecting DFS and OS. Besides, probit regression model was used to calculate the IC50. P value <0.05 was considered statistically significant.
3 Results
3.1 Baseline characteristics
NSCLC patients were with mean age of 61.9 ± 10.6 years and male/female ratio of 273 (80.3%)/67 (19.7%) (). The mean tumor size was 5.3 ± 2.1 cm. And the numbers of patients at TNM stage I, II and III were 117 (34.4%), 113 (33.2%) and 110 (32.4%) respectively. Other detailed characteristics are listed in .
Table 1. Baseline characteristics of NSCLC patients.
3.2 CXCR2 expression in NSCLC
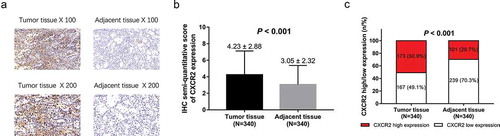
IHC staining examples of CXCR2 in tumor tissues and adjacent tissues of NSCLC patients were shown (). IHC semi-quantitative score of CXCR2 expression in NSCLC tumor tissue was higher compared with adjacent tissue (P < 0.001) (). In addition, there were 173 (50.9%) tumor tissues with CXCR2 high expression and 167 (49.1%) with CXCR2 low expression; 101 (29.7%) adjacent tissues with CXCR2 high expression and 239 (70.3%) with CXCR2 low expression, and further analysis exhibited that CXCR2 expression was higher in tumor tissues compared with adjacent tissues in NSCLC patients (P < 0.001) ().
Figure 1. CXCR2 expression in NSCLC tumor tissues and adjacent tissues.IHC staining examples of CXCR2 expression tumor tissues and adjacent tissues (A). IHC semi-quantitative score of CXCR2 expression in tumor tissues and adjacent tissues (B). Percentage of CXCR2 high expression and low expression in tumor tissues and adjacent tissues (C). Comparison of IHC semi-quantitative score of CXCR2 expression was done by paired-samples t-test, and comparison of CXCR2 high expression and low expression between tumor tissues and adjacent tissues was done by McNemar test. P < 0.05 was considered significant. CXCR2, C-X-C Chemokine Receptor Type 2; NSCLC, non-small cell lung cancer.
3.3 The correlation between CXCR2 and tumor characteristics
In order to evaluate the correlation of CXCR2 with tumor characteristics, patients were divided into different groups according to their tumor characteristics, and CXCR2 expression was compared between/among patients with different characteristics (). CXCR2 expression was correlated with poor pathological differentiation (P < 0.001), greater tumor size (P = 0.001), lymph node metastasis (P = 0.003) and higher TNM stage (P < 0.001) but not CEA level (P = 0.207) in NSCLC patients.
Table 2. Correlation of CXCR2 expression with tumor characteristics.
3.4 The correlation between CXCR2 and survival profiles
In addition, the correlation of CXCR2 with patients’ survival profiles was evaluated. Patients with CXCR2 high expression presented lower DFS (P < 0.001) () and OS (P < 0.001) () compared with those with CXCR2 low expression, suggesting that CXCR2 was correlated with unfavorable survival in NSCLC patients. In addition, patients were subdivided into TNM stage I, II and III subgroups, and correlation of CXCR2 with survival was evaluated in subgroup analysis. In patients with TNM stage I (P = 0.001) () and III (P = 0.019) () but not in patients with TNM stage II (P = 0.410) (), CXCR2 high expression was correlated with poor DFS. Similarly, in patients with TNM stage I (P = 0.002) () and III (P = 0.009) () but not in patients with TNM stage II (P = 0.331) (), CXCR2 high expression was correlated with shorter OS.
Figure 2. Comparison of survival between CXCR2 high expression and low expression patients. DFS (A) and OS (B) between CXCR2 high expression and low expression patients. The Kaplan–Meier curves were plotted to show the profiles of DFS and OS between the two groups, and the log-rank test was applied to determine the difference of DFS and OS between the two groups. P < 0.05 was considered significant. CXCR2, C-X-C Chemokine Receptor Type 2; DFS, disease-free survival; OS, overall survival.
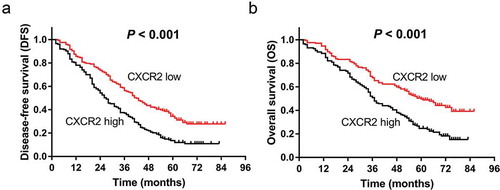
Figure 3. Comparison of survival between CXCR2 high expression and low expression patients in subgroups. DFS between CXCR2 high expression and low expression patients in patients with TNM stage I (A), II (B) and III (C). OS between CXCR2 high expression and low expression patients in patients with TNM stage I (D), II (E) and III (F). Kaplan–Meier curves were plotted to show the profiles of DFS and OS between the two groups, and the log-rank test was applied to determine the difference of DFS and OS between the two groups. P < 0.05 was considered significant. CXCR2, C-X-C Chemokine Receptor Type 2; DFS, disease-free survival; OS, overall survival.

3.5 Factors affecting DFS
Univariate Cox’s proportional hazards regression revealed that CXCR2 high expression (P < 0.001, HR = 1.814), poor pathological differentiation (P = 0.011, HR = 1.424), larger tumor size (P < 0.001, HR = 1.665), lymph node metastasis (P < 0.001, HR = 2.965), and high TNM stage (P < 0.001, HR = 2.118) were correlated with unfavorable DFS in NSCLC patients (). Further multivariate Cox’s proportional hazards regression displayed that CXCR2 high expression (P < 0.001, HR = 1.678) and lymph node metastasis (P < 0.001, HR = 2.834) were independent predictive factors for poor DFS in NSCLC patients.
Table 3. Analysis of factors affecting DFS by univariate and multivariate Cox’s proportional hazards regression model.
3.6 Factors affecting OS
Univariate Cox’s proportional hazards regression showed that CXCR2 high expression (P < 0.001, HR = 1.920), larger tumor size (P < 0.001, HR = 1.872), lymph node metastasis (P < 0.001, HR = 3.518), high TNM stage (P < 0.001, HR = 2.062) and abnormal CEA level (P = 0.024, HR = 1.362) were correlated with unfavorable OS in NSCLC patients (). Further multivariate Cox’s proportional hazards regression displayed that CXCR2 high expression (P < 0.001, HR = 1.887), lymph node metastasis (P < 0.001, HR = 3.602) and abnormal CEA level (P = 0.018, HR = 1.399) were independent predictive factors for poor OS in NSCLC patients.
Table 4. Analysis of factors affecting OS by univariate and multivariate Cox’s proportional hazards regression model.
3.7 Comparing CXCR2 expression between NSCLC cells and BEAS-2B cells
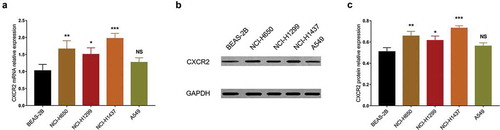
The previous analyses exhibited the clinical implication of CXCR2 in NSCLC. Furthermore, in vitro experiments were conducted to explore the underlying mechanism of CXCR2 in NSCLC cells.CXCR2 mRNA expression was increased in NCI-H650 (P < 0.01), NCI-H1299 (P < 0.05), NCI-H1437 (P < 0.001) cells but similar in A549 cells (P > 0.05) compared with human normal lung bronchus epithelial BEAS-2B cells (). Besides, Western blot analysis also showed that CXCR2 protein expression was higher in NCI-H650 (P < 0.01), NCI-H1299 (P < 0.05) and NCI-H1437 (P < 0.001) cells but unchanged in A549 cells (P > 0.05) compared with BEAS-2B cells (,).
Figure 4. CXCR2 mRNA and protein expression in different cell lines. The mRNA expression (A) and protein relative expression (B, C) of CXCR2 in NCI-H650, NCI-H1299, NCI-H1437, A549 cells compared with BEAS-2B cells. Comparison of CXCR2 mRNA and protein relative expression between cell lines was conducted by Dunnett’s t-test. P < 0.05 was considered significant. CXCR2, C-X-C Chemokine Receptor Type 2; mRNA, messenger RNA.
3.8 Effect of CXCR2 on cell proliferation and apoptosis
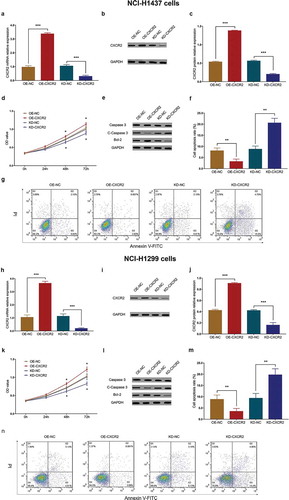
In NCI-H1437 cells, CXCR2 expression was increased in OE-CXCR2 group compared with OE-NC group (P < 0.001), and decreased in KD-CXCR2 group compared with KD-NC group (P < 0.001) after transfection (). The cell proliferation ability was higher in OE-CXCR2 group compared with OE-NC group (P < 0.05), and lower in KD-CXCR2 group compared with KD-NC group (P < 0.05) at 48 h and 72 h after transfection (). Besides, the cell apoptosis rate was reduced in OE-CXCR2 group compared with OE-NC group (P < 0.01), and improved in KD-CXCR2 group compared with KD-NC group (P < 0.01) (). Validation experiments in NCI-H1299 cells yielded similar results (). These data implied that CXCR2 promoted proliferation and suppressed apoptosis of NSCLC cells.
Figure 5. Effect of CXCR2 on cell proliferation and apoptosis. The effect of CXCR2 overexpression and knockdown on CXCR2 mRNA expression (A) and protein relative expression (B,C) in NCI-H1437 cells. The effect of CXCR2 overexpression and knockdown on cell proliferation (D) and apoptosis (E,F,G) in NCI-H1437 cells. The effect of CXCR2 overexpression and knockdown on CXCR2 mRNA expression (H) and protein relative expression (I,J) in NCI-H1299 cells. The effect of CXCR2 overexpression and knockdown on cell proliferation (K) and apoptosis (L,M,N) in NCI-H1299 cells. Comparison of cell proliferation and apoptosis between the two groups was conducted by independent sample’s t-test. P < 0.05 was considered significant. CXCR2, C-X-C Chemokine Receptor Type 2; mRNA, messenger RNA.
3.9 Effect of CXCR2 on cell invasiveness
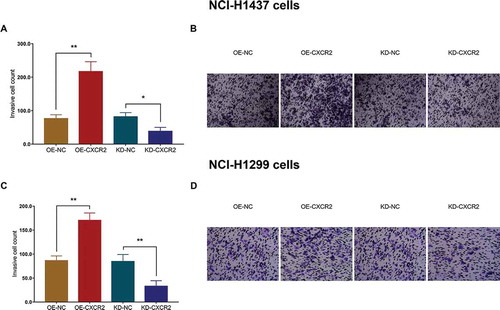
In NCI-H1437 cells, the invasive cell count was larger in OE-CXCR2 group compared with OE-NC group (P < 0.01), and smaller in KD-CXCR2 group compared with KD-NC group (P < 0.05) (,). Similarly, in NCI-H1299 cells, the invasive cell count was higher in OE-CXCR2 group compared with OE-NC group (P < 0.01), and lower in KD-CXCR2 group compared with KD-NC group (P < 0.01) (,). The above observations suggested that CXCR2 increased invasiveness of NSCLC cells.
Figure 6. Effect of CXCR2 on cell invasion. The effect of CXCR2 overexpression and knockdown on cell invasion in NCI-H1437 cells (A,B). The effect of CXCR2 overexpression and knockdown on cell invasion in NCI-H1299 cells (C,D). Comparison of invasive cell count between the two groups was conducted by independent sample’s t-test. P < 0.05 was considered significant. CXCR2, C-X-C Chemokine Receptor Type 2.
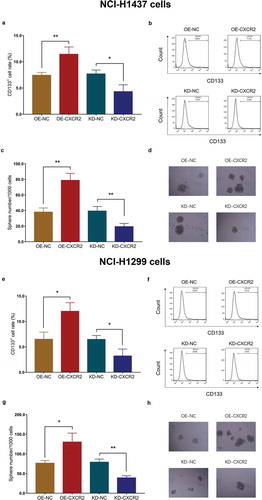
3.10 Effect of CXCR2 on cell stemness
In NCI-H1437 cells, the CD133+ cell rate was increased in OE-CXCR2 group compared with OE-NC group (P < 0.01), and decreased in KD-CXCR2 group compared with KD-NC group (P < 0.05) (,). And sphere number/1000 cells were elevated in OE-CXCR2 group compared with OE-NC group (P < 0.01), and reduced in KD-CXCR2 group compared with KD-NC group (P < 0.01) (,). Similar results were observed in NCI-H1299 cells as well (All P < 0.05) (). Besides, limiting dilution data presented that the estimated stem cell frequency was raised in OE-CXCR2 group (1 in 41.7 cells) compared with OE-NC group (1 in 112.1 cells) (P = 0.001), and lowered in KD-CXCR2 group (1 in 257 cells) compared with KD-NC group (1 in 101 cells) (P = 0.001) in NCI-H1437 cells (). As for in NCI-H1299 cells, the estimated stem cell frequency was increased in OE-CXCR2 group (1 in 117 cells) compared with OE-NC group (1 in 308 cells) (P = 0.001), and decreased in KD-CXCR2 group (1 in 543 cells) compared with KD-NC group (1 in 245 cells) (P = 0.006). These data implied that CXCR2 enhanced the stemness of NSCLC cells.
Table 5. Limiting dilution data.
Figure 7. Effect of CXCR2 on CD133+ cell rate and sphere formation efficiency. The effect of CXCR2 overexpression and knockdown on CD133+ cell rate (A,B) and sphere formation efficiency (C,D) in NCI-H1437 cells. The effect of CXCR2 overexpression and knockdown on CD133+ cell rate (E,F) and sphere formation efficiency (G,H) in NCI-H1299 cells. Comparison of CD133+ cell rate and sphere number/1000 cells between the two groups was conducted by independent sample’s t-test. P < 0.05 was considered significant. CXCR2, C-X-C Chemokine Receptor Type 2.
3.11 Effect of CXCR2 on cell chemosensitivity
The relative cell viability was detected in cisplatin or gemcitabine treated NSCLC cells. In cisplatin-treated NCI-H1437 cells, the relative cell viability was higher in OE-CXCR2 group compared with OE-NC group under 2 μM, 4 μM, 8 μM and 16 μM cisplatin, and lower in KD-CXCR2 group compared with KD-NC group under 2 μM, 4 μM, 8 μM, 16 μM and 32 μM cisplatin (All P < 0.05) (). In gemcitabine treated NCI-H1437 cells, the relative cell viability was higher in OE-CXCR2 group compared with OE-NC group under 4 μM, 8 μM, 16 μM and 32 μM gemcitabine, and lower in KD-CXCR2 group compared with KD-NC group under 4 μM, 8 μM and 16 μM gemcitabine (all P < 0.05) (). The further analysis showed that IC50 value of cisplatin was higher in OE-CXCR2 group compared with OE-NC group (P < 0.001), and lower in KD-CXCR2 group compared with KD-NC group (P < 0.001) in NCI-H1437 cells. Similarly, IC50 value of gemcitabine was higher in OE-CXCR2 group compared with OE-NC group (P < 0.001), and lower in KD-CXCR2 group compared with KD-NC group (P < 0. 01) in NCI-H1437 cells ().
Figure 8. Effect of CXCR2 on chemosensitivity. The effect of CXCR2 overexpression and knockdown on NCI-H1437 cells treated with cisplatin of different concentrations (A) and NCI-H1437 cells treated with gemcitabine of different concentration (B). The effect of CXCR2 overexpression and knockdown on IC50 value of cisplatin or gemcitabine in NCI-H1437 cells (C). The effect of CXCR2 overexpression and knockdown on NCI-H1299 cells treated with cisplatin of different concentrations (D) and NCI-H1299 cells treated with gemcitabine of different concentration (E). The effect of CXCR2 overexpression and knockout on IC50 value of cisplatin or gemcitabine in NCI-H1299 cells (F) Comparison of relative cell viability and IC50 value between the two groups was conducted by independent sample’s t-test. P < 0.05 was considered significant. CXCR2, C-X-C Chemokine Receptor Type 2.
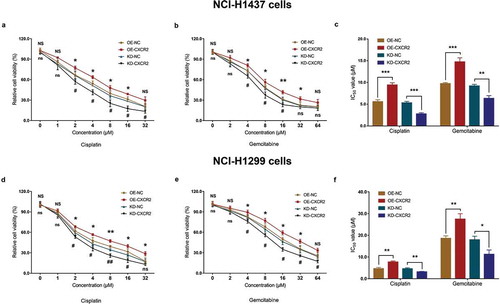
In cisplatin-treated NCI-H1299 cells, the relative cell viability was increased in OE-CXCR2 group compared with OE-NC group under 2 μM, 4 μM, 8 μM, 16 μM and 32 μM cisplatin, and decreased in KD-CXCR2 group compared with KD-NC group under 2 μM, 4 μM, 8 μM and 16 μM cisplatin (All P < 0.05) (). In gemcitabine treated NCI-H1299 cells, the relative cell viability was higher in OE-CXCR2 group compared with OE-NC group under 4 μM, 8 μM, 16 μM and 32 μM gemcitabine, and lower in KD-CXCR2 group compared with KD-NC group under 4 μM, 8 μM, 16 μM, 32 μM and 64 μM gemcitabine (All P < 0.05) (). Further analysis exhibited that IC50 value of cisplatin was elevated in OE-CXCR2 group compared with OE-NC group (P < 0.01), and lowered in KD-CXCR2 group compared with KD-NC group (P < 0.01) in NCI-H1299 cells. Similarly, IC50 value of gemcitabine was higher in OE-CXCR2 group compared with OE-NC group (P < 0.01), and lower in KD-CXCR2 group compared with KD-NC group (P < 0.05) in NCI-H1299 cells ().
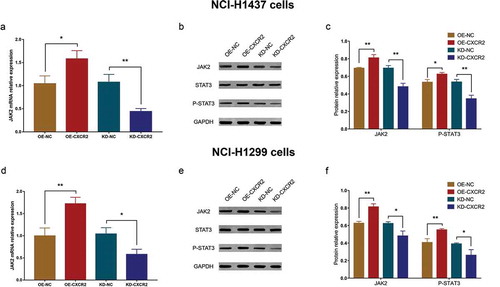
3.12 Effect of CXCR2 on JAK2/STAT3 pathway
In NCI-H1437 cells, the JAK2 mRNA expression was increased in OE-CXCR2 group compared with OE-NC group (P < 0.05) and decreased in KD-CXCR2 group compared with KD-NC group (P < 0.01) (). In addition, the protein relative expressions of JAK2 and P-STAT3 were promoted in OE-CXCR2 group compared with OE-NC group and reduced in KD-CXCR2 group compared with KD-NC group (All P < 0.05) (,). Similar results were observed in experiments conducted in NCI-H1299 cells (All P < 0.05) (), which implied that CXCR2 might regulate cellular functions via promoting JAK2/STAT3 pathway in NSCLC cells.
Figure 9. Effect of CXCR2 on JAK2/STAT3 pathway. The effect of CXCR2 overexpression and knockdown on JAK2 mRNA (A) as well as JAK2 and P-STAT3 protein expression (B,C) in NCI-H1437 cells. The effect of CXCR2 overexpression and knockdown on JAK2 mRNA (D) as well as JAK2 and P-STAT3 protein expression (E,F) in NCI-H1299 cells. Comparison of mRNA expression and protein relative expression between groups was conducted by independent sample’s t-test. P < 0.05 was considered significant. CXCR2, C-X-C Chemokine Receptor Type 2; JAK2, janus kinase 2; STAT3, signal transductor and activator of transcription 3.
4 Discussion
From this present study, we observed that: (1) CXCR2 was upregulated in tumor tissues compared with paired adjacent tissues, and it was correlated with poor pathological differentiation, greater tumor size, lymph node metastasis, higher TNM stage as well as unfavorable DFS and OS in NSCLC patients. (2) CXCR2 promoted NSCLC cell proliferation, invasion, stemness while suppressed cell apoptosis as well as chemosensitivity, and it facilitated JAK2/STAT3 signaling pathway in NSCLC.
Chemokines and their receptors are key regulators in cell signaling that participate in various biological processes including tumorigenesis, metastasis, angiogenesis and immune responses [Citation21]. In vivo, the expression of ELR+ chemokines on cancer cells is correlated with tumorigenesis and metastasis, and CXCR2 (a G-protein-coupled receptor binding the ELR+ motif) modulatesthedevelopment and progression of various solid tumors [Citation22]. For instance, the expression of CXCR2 in stromal cells is correlated with T invasion (T2-T4), lymph node metastasis, lymphatic infiltration, peritoneal cytology and peritoneal metastasis in gastric cancer patients [Citation16]. Also, high expression of CXCR2 was associated with Dukes stage, tumor invasion and liver metastasis in colorectal cancer patients [Citation21]. As for NSCLC, CXCR2 is highly expressed in primary tumors and metastatic lymph nodes of NSCLC, and the activation of CXCR2 promotes lymph node metastasis in NSCLC patients [Citation17]. In accordance with the previous evidences, we observed that CXCR2 expression was higher in tumor tissues compared with paired adjacent tissues of SCLC. Besides, high CXCR2 expression was correlated with poor pathological differentiation, greater tumor size, lymph node metastasis and higher TNM stage in NSCLC patients. This could be explained by that: CXCR2 activation might promote inflammation and angiogenesis, which contributed to tumor growth. Additionally, our subsequent in vitro experiments revealed that (1) CXCR2 promoted cell proliferation and suppressed cell apoptosis in NSCLC, which could facilitate tumor growth; (2) CXCR2 enhanced cell invasion, which induced lymph node metastasis; (3) CXCR2 promoted cell stemness, which might lead to higher pathological grade (poor differentiation) in NSCLC.
Other than the tumor characteristics, the influence of CXCR2 on cancer prognosis has been also studied previously in several cancers. For example, CXCR2, along with its ligand CXCL1, is a strong predictor for poor OS in hepatocellular carcinoma patients [Citation23]. In colorectal cancer, CXCR2 helps refine the individual risk stratification and is an independent predictive factor for poor DFS and OS [Citation21]. In addition, the negative correlation between CXCR2 and patients’ survival is also presented in renal cell carcinoma and gastric carcinoma [Citation16,Citation24]. Known that CXCR2 predicts poor survival in some solid tumors other than NSCLC, we were interested in whether similar results would be observed in NSCLC patients. Therefore, we compared the OS and DFS between CXCR2 high and low expression patients and further conducted multivariate Cox’s proportional hazards regression analysis. It turned out that OS and DFS were shorter in CXCR2 high expression patients compared with CXCR2 low expression patients, and CXCR2 independently predicted unfavorable OS and DFS in NSCLC patients. Herein, we proposed several explanations: (1) As previously shown, CXCR2 was correlated with poor pathological differentiation, greater tumor size, lymph node metastasis, and higher TNM stage, and these characteristics were known as risk factors for short survival in NSCLC patients. Thus, high CXCR2 expression would lead to poor OS and DFS in NSCLC patients. (2) From the following in vitro experiments, CXCR2 promoted the stemness of cancer cells, which might increase the tumor recurrence and induce drug resistance in NSCLC patients [Citation24–Citation26]. Besides, CXCR2 reduced the sensitivity to chemotherapy drugs in NSCLC cells, which attenuated the treatment efficacy and thereby resulted in poor prognosis in NSCLC patients.
In the present study, we exhibited the clinical relevance of CXCR2 in NSCLC patients, which might inform the disease monitoring. However, the underlying mechanism of CXCR2 in NSCLC still needed investigation. Therefore, the effect of CXCR2 on cell proliferation, apoptosis, invasiveness, stemness, and chemosensitivity was further explored in cellular experiments. We observed that in both NCI-H1437 and NCI-H1299 cells, CXCR2 promoted cell proliferation ability and invasiveness, but reduced cell apoptosis. And the CD133+ cell rate and cell sphere-forming ability were increased by CXCR2. Besides, the resistance to cisplatin and gemcitabine was also enhanced by CXCR2, which indicated that CXCR2 increased stemness and reduced chemosensitivity of NSCLC cells. These observations were consistent with the existing evidence that disclosed the molecular function of CXCR2 in other solid tumors. For example, CXCR2 promotes metastasis and chemoresistance via suppressing AKT1 and activating COX2 in breast cancer [Citation26]. The intracellular protein level of CXCR2 is significantly elevated in CPT-11 resistant LoVo colon cancer cells, and CXCL2/CXCR2 axis promotes cancer stem cell properties via regulating Gαi-2 and Gαq/11 in colon cancer [Citation25]. In addition, silencing of CXCR2 reduces cell migration, invasion, clonogenic ability and sphere-forming ability of renal cell carcinoma cells [Citation24]. These molecular functions of CXCR2 in NSCLC cells supported our clinical findings that CXCR2 was correlated with poor pathological differentiation, greater tumor size, lymph node metastasis, higher TNM stage, unfavorable DFS and OS in NSCLC patients.
Furthermore, the JAK2/STAT3 pathway was proposed as the signaling pathway of CXCR2 in NSCLC according to Kyoto Encyclopedia of Genes and Genomes (KEGG) PATHWAY Database. Thus, the effect of CXCR2 on JAK2/STAT3 pathway was investigated in the present study, which showed that JAK2 was increased and P-STAT3 was reduced by CXCR2. This implied that CXCR2 promoted JAK2/STAT3 pathway in NSCLC, and it might also explain the effect of CXCR2 on cell proliferation, apoptosis, invasiveness, stemness, and chemosensitivity. The reason was that JAK2/STAT3 pathway mediated cell growth, survival and differentiation in tumors via regulating multiple downstream genes such as c-MYC, VEGF, MMP2 [Citation27]. Combining the findings of our in vitro experiments and the existing evidences, CXCR2 might promote cell proliferation, invasion, stemness, reduce cell apoptosis and chemosensitivity through activating JAK2/STAT3 signaling pathwayofNSCLC.
This study disclosed that CXCR2 might help with clinical decision during disease diagnosis, monitoring, and prognosis in NSCLC, and further uncovered the underlying mechanism of CXCR2 in NSCLC progression, stemness and chemosensitivity regulation. However, several limitations still existed. Firstly, this study was a preliminary study with a relatively small sample size, and the sample selection might be subject to regional bias. Therefore, further cross-center study with larger sample size was needed to validate our findings. Secondly, although partially proven in the present study, the clinical application of CXCR2 as biomarker for NSCLC management was still a hypothesis, thus, a large amount of clinical trials was needed for realization.
In conclusion, CXCR2 correlates with advanced clinicopathological characteristics and predicts poor survival in NSCLC patients. And it facilitates cell proliferation, invasion, stemness but suppresses cell apoptosis and chemosensitivity via activating JAK2/STAT3 signaling pathway in NSCLC.
Supplemental Material
Download PDF (86.5 KB)Disclosure statement
No potential conflict of interest was reported by the authors.
Data availability statement
The datasets used and/or analyzed during the current study are available from the corresponding author on reasonable request.
Supplementary material
Supplemental data for this article can be accessed here
Related Research Data
References
- Group NM-aC. Preoperative chemotherapy for non-small-cell lung cancer: a systematic review and meta-analysis of individual participant data. Lancet. 2014;383:1561–1571.
- Pao W, Chmielecki J. Rational, biologically based treatment of EGFR-mutant non-small-cell lung cancer. Nat Rev Cancer. 2010;10:760–774.
- Herbst RS, Morgensztern D, Boshoff C. The biology and management of non-small cell lung cancer. Nature. 2018;553:446–454.
- David EA, Clark JM, Cooke DT, et al. The role of thoracic surgery in the therapeutic management of metastatic non-small cell lung cancer. J Thorac Oncol. 2017;12:1636–1645.
- Reck M, Rabe KF. Precision diagnosis and treatment for advanced non-small-cell lung cancer. N Engl J Med. 2017;377:849–861.
- Zlotnik A, Yoshie O. The chemokine superfamily revisited. Immunity. 2012;36:705–716.
- Wang JM, Deng X, Gong W, et al. Chemokines and their role in tumor growth and metastasis. J Immunol Methods. 1998;220:1–17.
- Balkwill F. Chemokine biology in cancer. Semin Immunol. 2003;15:49–55.
- R Setroikromo, et al. Cx chemokine receptor 7 contributes to survival of kras-mutant non-small cell lung cancer upon loss of epidermal growth factor receptor. Cancers (Basel). 2019 Mar 30;11(4). pii: E455. doi:10.3390/cancers11040455.
- Wang L, Wang Z, Liu X, et al. High-level C-X-C chemokine receptor type 4 expression correlates with brain-specific metastasis following complete resection of non-small cell lung cancer. Oncol Lett. 2014;7:1871–1876.
- Sueoka H, Hirano T, Uda Y, et al. Blockage of CXCR2 suppresses tumor growth of intrahepatic cholangiocellular carcinoma. Surgery. 2014;155:640–649.
- Sharma B, Nannuru KCSaxena S, et al. CXCR2: A novel mediator of mammary tumor bone metastasis. Int J Mol Sci. 2019 Mar 12;20(5). pii: E1237. doi:10.3390/ijms20051237
- An H, Xu L, Chang Y, et al. CXC chemokine receptor 2 is associated with postoperative recurrence and survival of patients with non-metastatic clear-cell renal cell carcinoma. Eur J Cancer. 2015;51:1953–1961.
- Li YM, Liu ZYWang JC, et al. Receptor-interacting protein kinase 3 deficiency recruits myeloid-derived suppressor cells to hepatocellular carcinoma through the chemokine (c-x-c motif) ligand 1-chemokine (c-x-c motif) receptor 2 axis. Hepatology. 2019 Nov;70(5):1564–1581. doi:10.1002/hep.30676.
- Cui D, Zhao Y, Xu J. Activated CXCL5-CXCR2 axis promotes the migration, invasion and EMT of papillary thyroid carcinoma cells via modulation of beta-catenin pathway. Biochimie. 2018;148:1–11.
- Kasashima H, Yashiro M, Nakamae H, et al. Clinicopathologic significance of the CXCL1-CXCR2 axis in the tumor microenvironment of gastric carcinoma. PLoS One. 2017;12:e0178635.
- Cong L, Qiu ZY, Zhao Y, et al. Loss of beta-arrestin-2 and activation of CXCR2 correlate with lymph node metastasis in non-small cell lung cancer. J Cancer. 2017;8:2785–2792.
- Hu Z, Gu X, Zhong R, et al. Tumor-infiltrating CD45RO(+) memory cells correlate with favorable prognosis in patients with lung adenocarcinoma. J Thorac Dis. 2018;10:2089–2099.
- Burger M, Hartmann T, Burger JA, et al. KSHV-GPCR and CXCR2 transforming capacity and angiogenic responses are mediated through a JAK2-STAT3-dependent pathway. Oncogene. 2005;24:2067–2075.
- Cheng Y, Ma XL, Wei YQ, et al. Potential roles and targeted therapy of the CXCLs/CXCR2 axis in cancer and inflammatory diseases. Biochim Biophys Acta Rev Cancer. 2019;1871:289–312.
- Zhao J, Ou B, Feng H, et al. Overexpression of CXCR2 predicts poor prognosis in patients with colorectal cancer. Oncotarget. 2017;8:28442–28454.
- Raghuwanshi SK, Nasser MW, Chen X, et al. Depletion of beta-arrestin-2 promotes tumor growth and angiogenesis in a murine model of lung cancer. J Immunol. 2008;180:5699–5706.
- Li L, Xu L, Yan J, et al. CXCR2-CXCL1 axis is correlated with neutrophil infiltration and predicts a poor prognosis in hepatocellular carcinoma. J Exp Clin Cancer Res. 2015;34:129.
- Sun KH, Sun GH, Wu YC, et al. TNF-alpha augments CXCR2 and CXCR3 to promote progression of renal cell carcinoma. J Cell Mol Med. 2016;20:2020–2028.
- Chen MC, Baskaran R, Lee NH, et al. CXCL2/CXCR2 axis induces cancer stem cell characteristics in CPT-11-resistant LoVo colon cancer cells via Galphai-2 and Galphaq/11. J Cell Physiol. 2019;234:11822–11834.
- Xu H, Lin F, Wang Z, et al. CXCR2 promotes breast cancer metastasis and chemoresistance via suppression of AKT1 and activation of COX2. Cancer Lett. 2018;412:69–80.
- Wang Y, Shen Y, Wang S, et al. The role of STAT3 in leading the crosstalk between human cancers and the immune system. Cancer Lett. 2018;415:117–128.