
ABSTRACT
The inhibition of enhancer of zeste homolog 2 (EZH2) has been suggested to be synthetic lethal with polybromo-1 (PBRM1) deficiency, rendering EZH2 to be an attractive target for the treatment of PBRM1 frequently mutated cancers. In the current study, we combined computational and biochemical approaches to establish an efficient system for the screening and validation of synthetic lethal inhibitors from a large pool of chemical compounds. Five putative EZH2 inhibitors were identified through structure-based virtual screening from 47,737 chemical compounds and analyzed with molecular dynamics. The efficacy of these compounds against EZH2 was tested using PBRM1 deficient and wide-type cell lines. The compound L501-1669 selectively inhibited the proliferation of PBRM1-deficient cells and down-regulated the tri-methylation of histone H3 at Lysine 27 (H3K27me3). Importantly, we also observed an increase in apoptotic activities in L501-1669 treated PBRM1-deficient cells. Taken together, our results demonstrate that L501-1669 is a selective EZH2 inhibitor with promising application in the targeted therapy of PBRM1-deficient cancers.
1. Introduction
Renal cancer represents approximately 4% of adult malignancies and was ranked as the sixth deadliest cancer worldwide in 2018 [Citation1,Citation2]. Clear cell renal cell carcinoma (ccRCC) is the most common subtype of renal cell carcinoma (RCC), accounting for 90% of all renal tumors [Citation3].
Synthetic lethality (SSL) is a phenomenon whereby individual genes in a pair can be knocked-out without affecting cell viability, while disruptions in both genes concurrently cause cell death [Citation4]. Thus, in principle, targeting synthetic lethal vulnerabilities in cancer should reduce the potential for side effects, since cells harboring the biomarker oncogenic lesion should have differential sensitivity to the perturbation than normal cells. A good example of this concept in cancer biology and therapeutics is that homologous-recombination deficient BRCA1 or BRCA2 mutant cancers demonstrate profound sensitivity to inhibition of poly-(ADP-ribose) polymerase (PARP) PARP inhibitors, which have subsequently shown therapeutic efficacy in BRCA1/2 mutant breast, ovarian and some pancreatic cancers [Citation5–Citation8].
PBRM1 (BAF180), the defining subunit of the polybromo BAF (PBAF) SWI/SNF chromatin remodeling complex, is mutated in 40–50% of the ccRCC patients [Citation9,Citation10]. It has been shown that mutations affecting the SWI-SNF tumor suppressor subunits, including PBRM1, ARID1A, and SMARCA4, are synthetic lethal with the histone methyltransferase EZH2 [Citation11].
Epigenetic regulators are emerging as a new class of drug targets, EZH2 is one of the hot targets. EZH2, a histone methyltransferase served as a catalytic subunit of PRC2, has been known to catalyze tri-methylation of histone H3 at Lysine 27, leading to the silencing of its target genes involved in cell cycle regulation, cell proliferation, cell differentiation, and cancer progression [Citation12]. EZH2 is aberrantly overexpressed in various malignant tumors, such as prostate cancer, breast cancer, and ovarian cancer, and is correlative with the poor prognosis in different human cancers, indicating the involvement of EZH2 in the development and progression of cancers.
In the current study, we combined computational and biochemical strategies involving structure-based virtual computer screening, molecular dynamics simulation, and functional analysis to identify leading compounds with high specificity to EZH2 activity. One of the compounds, L501-1669, demonstrated targeted therapeutic effects in PBRM1-deficient cells through inhibition of methyltransferase and induction of apoptosis. The information obtained from this study is valuable to our understanding to the mechanism of PBRM1-EZH2 synthetic lethality and facilitates the development of ccRCC targeted therapy.
2. Materials and methods
2.1 EZH2 and chemical compounds library preparation for docking
The crystal structure of EZH2 (PDB entry: 5WG6) in complex with GSK126 at a resolution of 3.9 Å was downloaded from the RCSB Protein Data Bank database. Chain A of EZH2 was prepared for docking using UCSF Chimera (version 1.11.2) [Citation13], in which the hydrogen atoms and standard charges were added. The structures of 47,737 commercially available chemical compounds (Targeted Diversity Library, ChemDiv) were converted to the mol2 format using the Openbabel software, and the Chimera software was used to minimize the energy of the 3D structure of the compounds.
2.2 Virtual screening for potential EZH2 inhibitors and molecular dynamics simulation
Virtual screening and molecular dynamics (MD) simulation were performed as described previously [Citation14]. Briefly, the docking site in EZH2 protein for virtual screening was determined in reference to that of GSK126. The conformations of the top 60 compounds with the lowest amber scores were chosen, and the 45 compounds of them which binding to target pocket were classified based on their structural characteristics. Furthermore, these 45 compounds were subjected to the Swiss ADMET online tool for the in silico ADME property analyses [Citation15]. The complete 3D structure of EZH2 protein used for MD simulation was obtained by homology modeling with SWISS-MODEL web server.
2.3 Structural analysis of MD trajectories
Per-residue root-mean-square fluctuation (RMSF) and root-mean-square deviation (RMSD) analysis were carried out by the g_rmsf and g_rmsd programs, respectively, in the GROMACS package (version 4.6.7) [Citation16]. The potential energy, kinetic energy, and total energy were calculated using the g_energy program of GROMACS. Attractive forces (hydrogen bonds and hydrophobic interactions) between key residues of EZH2 and chemical compounds were analyzed using the LIGPLOT+ software (version 1.4.5) [Citation17]. The 3D protein–ligand complexes generated during MD simulations were flattened into 2D diagrams using the LIGPLOT algorithm [Citation18].
2.4 Cell viability assay
Caki-1 and A704 cells were cultured in DMEM media supplemented with 10% FBS and 1% antibiotics (Gibco, Thermo Fisher Scientific). Cells were plated in 96-wells plates (2000 cells per well). After 24 h, cells were treated with either putative EZH2 inhibitors (ChemDiv) or GSK126 (Selleckchem, S7061). Cell viability was evaluated with CCK8 kit (7sea Biotechnology) according to the manufacture’s protocol.
2.5 Short hairpin RNA knockdown of PBRM1 in Caki-1 cells
The shRNA targeting sequence was: PBRM1 5ʹ-CCGGAGTCTTTGATCTACAAA-3ʹ and Scramble 5ʹ-CCTAAGGTTAAGTCGCCCTCG-3ʹ. Lentiviral particles were produced in HEK293T cells by transfecting the shRNA oligo containing pLKO.1 plasmids in combination with the packaging plasmids pMD2.G and psPAX2. Virus containing in the supernatant was harvested at 48 and 72 h after transfection. Lentivirus infected Caki-1 cells were selected with 2μg/ml of puromycin for 7 d. PBRM1 knockdown efficiency in the established cell line was analyzed by western blotting.
2.6 Western blotting
Cells were collected by scraping and lysed in RIPA buffer (50mM Tris (pH 7.4), 150mM NaCl, 1% Triton X-100, 1% sodium deoxycholate, 0.1%SDS, 0.1mM sodium orthovanadate, 1Mm sodium fluoride, and 1mM EDTA) supplemented with protease inhibitor cocktail (Beyotime, P0013B). Cell lysates were fractionated in 10% SDS-PAGE gel, and then transferred to PVDF membranes and blocked for 1 h with 10% fat-free milk in 1× TBST. Immunodetection was done with antibodies against PBRM1 (Abcam, ab245399, 1:1000); H3K27me3 (ZENBIO, 502363, 1:1000); EZH2 (Millipore, D2C9, 1:1000); Bcl-2 (ZENBIO, 230004, 1:1000); Bax (ZENBIO, 200958, 1:1000).
2.7 Colony formation assay
Cells were plated with 5000 cells per well in 6-well plates. After 24 h, the cells were treated with indicated concentrations of inhibitors, which were replaced by a fresh medium with inhibitors every 3 d. After 9 d, cells were fixed with 10% formalin for 30 min at room temperature and subsequently stained with 250μl per well of 0.1% crystal violet in 70% ethanol for 30 min at room temperature with constant shaking. To remove unbound crystal violet, cells were washed with deionized water three times for 5 min. For quantification, the colonies were analyzed using ImageJ software. Three reduplicate dishes were used from each condition.
2.8 RNAi
Cells were plated in 96-wells (2000 cells per well), after 24 h, siRNA oligos (5pmol/100μl) were transfected with Lipofectatime 2000 (Invitrogen, Thermo Fisher Scientific) for 6 h. Transfection mixture was replaced with fresh DMEM with 10% FBS and 1% antibiotics and cell viability was assessed after another 72 h. The sequences of the siRNA oligos were EZH2#1 5′-GUGCCCUUGUGUGAUAGCACAA-3′, EZH2#2 5′-GGCACUUUCAUUGAAGAACUAA-3′, siScramble 5ʹ-UUCUCCGAACGUGUCACGUTT-3ʹ.
2.9 Cell apoptosis assay
Cells treated with L501-1669 were digested with EDTA-free trypsin. The cells were centrifuged and washed once with PBS, and then stained by staining solution (Annexin V-APC and PI) for 15 min at room temperature. All samples were processed by flow cytometry (CytoFLEX, Backman). Results were analyzed by CytExpert.
2.10 Statistical analysis
All the results in were analyzed by using one-way ANOVA, Mantel–Cox test, Mutual Exclusivity Modules of the cBio Cancer Genomics Portal as appropriate. All results in – were from three independent experiments, analyzed by GraphPad Prism 5.0 and expressed as the mean ± SD. The differences were analyzed using the Student’s t-test or one-way ANOVA analysis as appropriate. P-values <0.05 were considered a statistically significant difference.
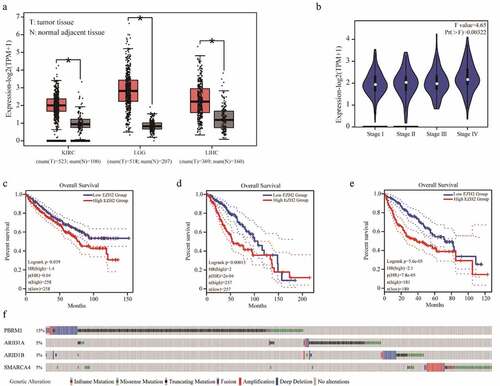
Figure 1. Bioinformatics analysis of EZH2 and PBRM1 in cancer. The expression of EZH2 in kidney renal clear cell carcinoma (KIRC), brain lower-grade glioma (LGG), and liver hepatocellular carcinoma (LIHC) are significantly higher than those of normal tissues. T means tumor tissue and N means normal adjacent tissue. (b) EZH2 expression in different stages of KIRC. (c–e) The overall survival of patients with KIRC, LGG, and LIHC in reference to EZH2 expression. (f) The overall mutation rates of PBRM1, ARID1A, ARID1B, or SMARCA4 in KIRC, LGG, and LIHC
3. Results
3.1 High EZH2 expression in various tumors associated with poor prognosis
We first analyzed the mRNA expression of EZH2 in various tumors and their corresponding normal adjacent tissues using the GEPIA online tool [Citation19]. The results showed that the expression of EZH2 in a series of tumor tissues, including kidney renal clear cell carcinoma (KIRC), brain lower-grade glioma (LGG), liver hepatocellular carcinoma (LIHC), was significantly higher than that of normal tissues (). In KIRC, the expression of EZH2 in the later stages is also significantly higher than that of the early stage (). More importantly, we analyzed the relationship between the expression of EZH2 and the overall survival of patients with KIRC, LGG, or LIHC. The results showed that the overall survival of patients with high EZH2 expression was significantly shorter than those patients with lower EZH2 expression (c–e). Previously articles have clearly stated that EZH2 overexpressed in renal cancer cells and tumor samples has a poor prognosis [Citation20–Citation22]. These results indicate that EZH2 is a valuable prognostic marker for these types of cancers [Citation23]. Several studies have reported that EZH2 inhibition leads to synthetic lethality with PBRM1, ARID1A, ARID1B, and SMARCA4 mutations, mainly in the context of kidney cancer [Citation23]. Simultaneously, high expression of EZH2 was correlated with poor prognosis in other cancer types have been reported [Citation24–Citation26]. We used the cBioPortal online tool to analyze mutations in PBRM1, ARID1A, ARID1B, and SMARCA4 in KIRC, LGG, and LIHC with data from TCGA PanCancer Atlas [Citation27]. The overall mutation rates of PBRM1, ARID1A, ARID1B, and SMARCA4 in these three cancers were 15%, 5%, 3%, and 5%, respectively (). Because of the high expression of EZH2 in various tumor tissues and the associated poor prognosis, as well as the synthetic lethality between EZH2 and PBRM1, ARID1A, ARID1B, or SMARCA4, the identification of novel EZH2-specific inhibitor for the treatment of related cancers is of great importance.
3.2 Identification of putative EZH2 inhibitors by virtual screening
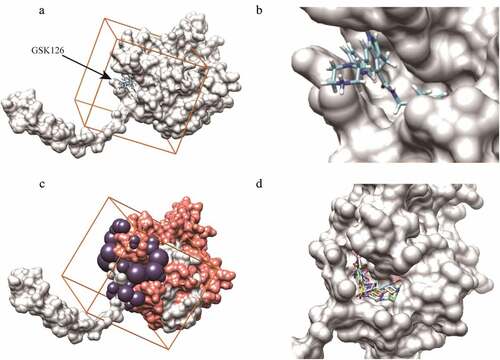
GSK126 is an EZH2 inhibitor that has entered the clinical trial stage. We set the parameters for virtual screening by referring to its interaction with EZH2. According to the binding mode of GSK126 to EZH2 (,), the GSK126-binding pocket was defined as the binding site for small molecules (), and selected sphere was within a root-mean-square deviation (RMSD) of 1.0 nm of every atom in the GSK126 structure of the ligand (). We screened a total of 47,737 compounds, which are intended for the design of high-quality libraries of drug-like compounds that have been focused against various biological, targets by a two-round scoring strategy. Compounds were filtered by two criterias: 1. Compounds are in the lowest amber score. 2. Compounds can dock into the binding pocket. The top 60 compounds with lowest amber scores were selected and 45 of them were successfully docked into the defined inhibitor binding pocket. The ADMET properties of these 45 compounds were predicted in Table S2. According to Table S2, C769-0015, E218-0093, L309-0080, L501-1669 and M022-1782 were determined as putative EZH2 inhibitors and further analyzed ( and ).
Table 1. Structures and docking scores of representative putative EZH2 inhibitors
Figure 2. Compounds screening in reference to GSK126-EZH2 interaction. (a, b) The binding mode of GSK126 to EZH2. (c) The purple spheres indicate the docking sites for virtual screening. Orange cube indicates the location and size of the grid to be calculated. Salmon spheres indicate the surface of amino acids 500–700 region. (d) The five putative EZH2 inhibitors were successfully docked into the defined binding pocket
3.3 The interactions between identified compounds and EZH2
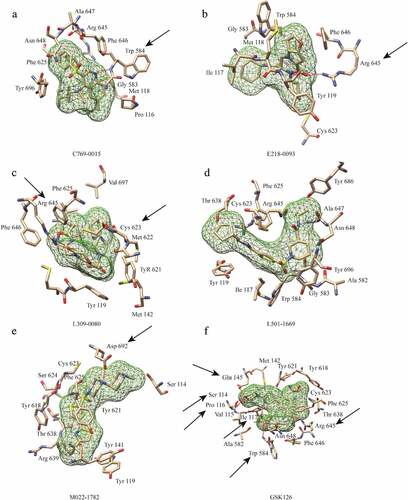
All of the five putative inhibitors were successfully docked into the pocket defined for virtual screening. The interactions between these compounds and EZH2 were primarily through the formation of hydrogen bonds and hydrophobic interactions. Except L501-1669, the other four compounds were predicted to form at least one hydrogen bond with the amino acid residues of EZH2. The key amino acid residues of five putative inhibitors in the pocket mainly form hydrophobic interactions (Figure S1). Although L501-1669 did not have a hydrogen bond interaction with the amino acid residues of the targeted pocket, the number of amino acids interacting with it approaches 13, which was the largest number in the 5 candidate compounds. The number of amino acid residues interacting with the other four compounds, C769-0015, E218-0093, L309-0080 and M022-1782, in the binding pocket was 11, 8, 11 and 11, respectively (). In the binding pocket, nine of the amino acids that form a hydrophobic interaction with L501-1669 were identical to those of GSK126, and the other four compounds had only 6, 2, 8, and 5 amino acids, respectively, which were identical to GSK126. These results indicated that L501-1669 was the most closely interacted with EZH2 among the five identified compounds.
Figure 3. Interactions between EZH2 and the five candidate inhibitors. (a) Binding of C769-0015. (b) Binding of E218-0093. (c) Binding of L309-0080. (d) Binding of L501-1669. (e)Binding of M022-1782. (f) Binding of GSK126. Five candidate inhibitors are displayed as mesh surfaces in greed. Hydrogen bonds are indicated by broken red lines. The amino acid residues of EZH2 involved in hydrogen bonding and hydrophobic interaction are presented as stick models. The black arrows highlight the key residues involved in hydrogen bonding, other amino acids are involved in hydrophobic interactions
3.4 Structural stability of EZH2 in molecular dynamics simulation
The backbone root-mean-square deviation (RMSD) values with respect to the X-ray structure was calculated to assess the stability of the five EZH2-ligand complexes during the MD simulation. As shown in , after the first 5 ns of fluctuations, the backbone of the EZH2-E218-0093 complex gradually stabilized with an average of 0.85 nm. The backbone RMSD values of the EZH2-C769-0015, EZH2-L309-0080, EZH2-M022-1782, EZH2-L501-1669 and EZH2-GSK126 complexes were stable after 10 ns of the simulation, with average values (15 ns) of 0.82 nm, 0.73 nm, 0.81 nm, 0.78 nm and 0.86 nm. This indicated that the protein receptor of the EZH2-ligands binding systems is stable, which providing a solid foundation for further analysis (). Then, we evaluate the fluctuation of the ligands. Although all the receptors of small molecules can maintain stability during the whole fluctuation period, but by calculating the difference between the maximum and minimum fluctuation value of each small molecule. We found that the difference in L501-1669 was the smallest (0.095 nm) (). It indicated that the small molecule L501-1669 was most stable in the EZH2 inhibitor binding pocket.
Figure 4. RMSD and RMSF analysis of EZH2-ligand complexes. (a) Backbone RMSD values (with respect to the X-ray structure) for EZH2-ligand complexes during 15 ns MD simulations. (b) Difference between the maximum and minimum fluctuation value of five putative inhibitors. (c) RMSFs of EZH2 in complex with five candidate inhibitors and GSK126 during the simulation. (d-i) The RMSF value of the amino acid that interacts with the inhibitors
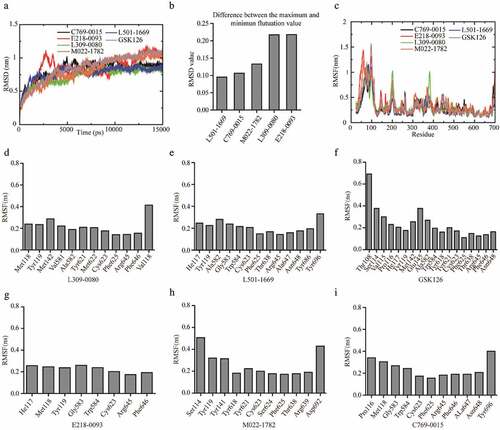
As observed from the RMSF value of the whole protein sequence of EZH2 (), the fluctuation of the C-terminal amino acids was the largest, and the fluctuation of the amino acids 500–700 was at the bottom, indicating that these amino acid residues were stable during the simulation. Most of the amino acids interacting with the five candidate small molecules were located in this region of EZH2 (), suggesting that the binding of small molecules to the pocket required the key amino acids to maintain a stable structure. We then calculated the fluctuations of the key amino acid residues in the binding pockets (-i). The average fluctuation of the L501-1669 interacting amino acids was 0.2104 nm, and the average RMSF values of the other four candidate compounds interacting amino acids were 0.2451 nm (C769-0015), 0.2259 nm (E218-0093), 0.2173 nm (L309-0080), 0.2634 nm (M022-1782). The average RMSF value of the amino acid residues interacting with GSK126 in the binding pocket was 0.2390 nm. Thus, the binding of L501-1669 to the key amino acids in the EZH2 binding pocket was the most stable.
The RMSF calculates the fluctuation of each amino acid relative to its average position, characterizes the average of the change in structure over time, and gives a representation of the flexibility of each region of the protein. RMSD indicates the degree of molecular structure change and is mainly used to determine the structural changes of the higher structure of the protein receptor. We have proved that L501-1669 can be stably combined in the binding pocket of EZH2 in both structure and region level.
3.5 GSK126 caused a synthetic lethal difference between Caki-1 and A704 cell lines
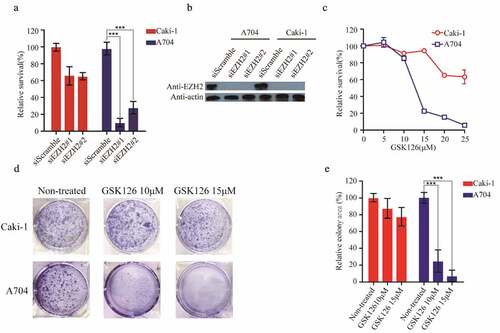
We chose A704 cell line, which lacks detectable endogenous PBRM1, and Caki-1, expressing wide-type PBRM1, to evaluate the efficacy of the putative EZH2 inhibitors [Citation27–Citation29]. Then, we first designed siRNAs targeting EZH2 and transfected into Caki-1 and A704 cell lines. The proliferation of A704 was almost completely inhibited, while Caki-1 was nearly unaffected, which preliminarily demonstrated the reliability of selected cell lines as a model for studying PBRM1-EZH2 synthetic lethality (,b). To further validate the efficacy of selected cell lines, we used the specific EZH2 inhibitor GSK126 to analyz whether there was a different sensitivity between the two cell lines. After treatment with GSK126 for 72 h, A704 showed a higher sensitivity than Caki-1 and the difference of relative survival rate between them reached 80% at 15 μM (). At 25 μM, the relative survival rate of A704 was nearly zero, while Caki-1 was still at 60% (). The IC50 values of Caki-1 and A704 in cell viability were 28,86 μM and 12.83 μM, respectively (). Similarly, after exposure to GSK126 for 9 d in clonogenic assay, it was clearly shown that the proliferation of A704 was severely inhibited, as low as 20% and 5% at 10 μM and 15 μM, respectively. While Caki-1 was hardly affected at the same concentrations (,e). These results indicated that A704 and Caki-1 are suitable for the validation of the five putative EZH2 inhibitors.
Figure 5. A704 and Caki-1demonstrated different sensitivities to EZH2-inhibition. (a) siRNAs transfection of Caki-1 and A704. The relative survival of transfected cell lines was accessed 72 h after transfection. Error bars represent the SDs (n = 3, *P < 0.05; **P < 0.01; ***P < 0.001). (b) EZH2 expression of cell lines after siEZH2s transfection (c) GSK126 treatment of Caki-1 and A704. (d) Clonogenic assay of cell lines with GSK126 treatment. Images of representative experiments were shown. Colonies were counted using image J software. (e) Quantification of clonogenic assay. The values were expressed in percentage relative to non-treated. Error bars represent the SDs (n = 3, *P < 0.05; **P < 0.01; ***P < 0.001)
3.6 L501-1669 inhibited the proliferation of A704 more effectively than Caki-1
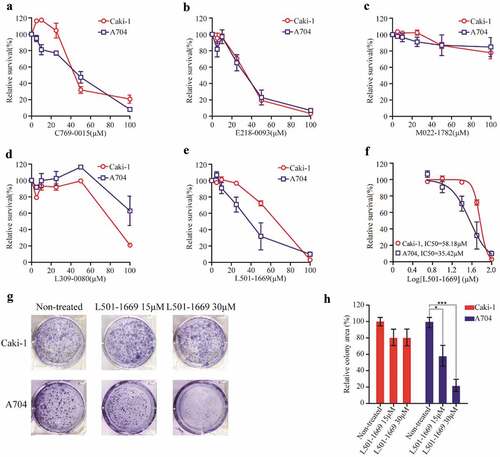
Then, we used A704 and Caki-1 to validate the efficacy of the five putative EZH2 inhibitors obtained from our computational study. There was no difference in the relative cell survival rate between A704 and Caki-1 after the treatment of C769-0015, E218-0093, and M022-1780, respectively (–). After treatment with L309-0080, PBRM1 wide-type cell line exhibited higher sensitivity (). Only after the treatment of L501-1669, the proliferation of A704 was dramatically suppressed and was more sensitive than Caki-1(). To further confirm its efficacy, we treated cell lines with indicated concentrations of L501-1699 for 9 d in our clonogenic assay. The result showed that the cell proliferation of A704 was significantly inhibited compared to that of Caki-1, and the cell viabilities at 15 μM and 30 μM were about 60% and 20%, respectively (,g).
Figure 6. Validation of putative EZH2 inhibitors with Caki-1 and A704 cell lines. Caki-1 and A704 cell lines were treated with indicated concentration of five compounds ((a) C769-0015 (b) E218-0093 (c) M022-1782 (d) L309-0080 (e) L501-1669) for 72 h and evaluated for survival. The IC50 values of Caki-1 and A704 after L501-1669 treatment were 58.18μM and 35.42μM, respectively. (f) The dose–response curve of the data in e. (g) Clonogenic assay of cell lines with L501-1669 treatment. Images of representative experiments were shown. Colonies were counted using image J software. (h) Quantification of clonogenic assay. The values were expressed in percentage relative to non-treated. Error bars represent the SDs (n = 3, *P < 0.05; **P < 0.01; ***P < 0.001)
3.7 L501-1669 demonstrated synthetic lethality in PBRM1 knockdown cell line
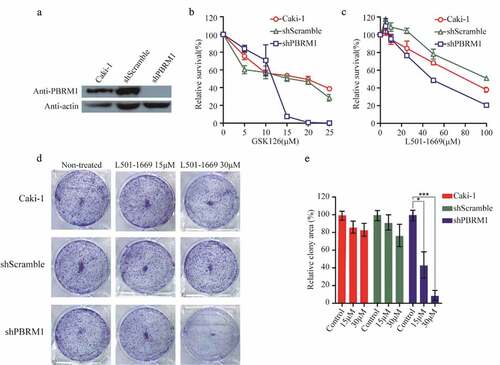
To minimize the impact of genetic background differences in Caki-1 and A704 cell lines, we designed shRNA targeting PBRM1 and transfected Caki-1 to generate a stable PBRM1 knockdown cell line. We used this cell line to verify the synthetic lethal effect of L501-1669 as observed in A704. We first evaluated the knockdown efficiency of PBRM1 in the cell lines. PBRM1 expression was barely detectable by western blotting in shPBRM1 cell line, whereas parental Caki-1 and shScrambled-transfected cells showed normal PBRM1 expression (). Parental Caki-1, shScrambled-transfected, and shPBRM1-transfected cells were then exposed to GSK126 for 5 d, PBRM1 knockdown cell line was more susceptible to the drug compared to Caki-1 and the negative control cell line (). Then, we treated these cell lines with L501-1669 and found that the PBRM1-deficient cell line was more sensitive, which was consistent with the result of GSK126 (). After long-term 9 d treatment of L501-1669 in our clonogenic assay with the indicated concentrations, the relative colony area was about 50% and 10% at 15 μM and 30 μM, respectively (,e). Altogether, these results indicated that L501-1669 is a promising leading compound for inhibition of the enzymatic activity of EZH2 in PBRM1-deficient tumor cells, which leads to synthetic lethality for targeted therapy.
Figure 7. Evaluation of L501-1669 efficacy in PBRM1 knockdown cell line. (a, b), (a) Confirmation of PBRM1 knockdown in Caki-1 by western blotting. (b) Cell lines were treated by indicated concentration GSK126 and evaluated for cell survival after 5 d. (c) Cell lines were treated by indicated concentration L501-1669 and evaluated for cell survival after 5 d. (d) Clonogenic assay of cell lines with L501-1669 treatment. Images of representative experiments were shown. Colonies were counted using image J software. (e) Quantification of clonogenic assay. The values were expressed in percentage relative to non-treated. Error bars represent the SDs (n = 3, *P < 0.05; **P < 0.01; ***P < 0.001)
3.8 H3K27me3 reduction and apoptosis were induced by L501-1669 treatment
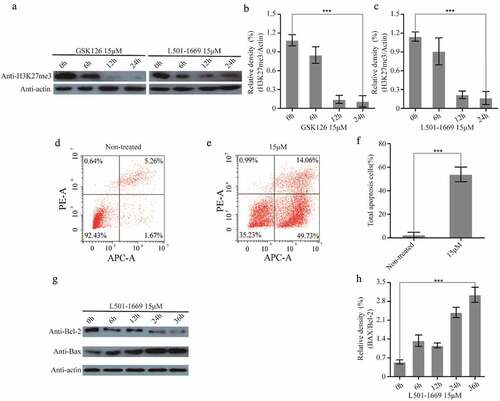
In previous study, GSK126 treatment has been shown to induce a loss of H3K27 tri-methylation [Citation30]. Because the docking site of virtual screening we defined in this study referred to that of GSK126, it is highly likely that L501-1669 induced synthetic lethality was also associated with the reduction of H3K27 trimethylation. In order to verify whether L501-1669 also suppresses H3K27 tri-methylation, we detected H3K27 tri-methylation status in A704 cell line after the treatment of GSK126 and L501-1669. Both GSK126 and L501-1669 resulted in significant decrease of H3K27 tri-methylation in 12 h and 24 h (–). Simultaneously, after a dose of L501-1669 treatment at 15 μM, the cell apoptosis of A704 significantly increased, reaching 49.73% (–f). Then, we had detected the expression of Bax increased while the Bcl-2 decreased, which are indicator proteins of apoptosis (c,f). These results indicated that L501-1669 treatment caused H3K27me3 decrease and apoptosis markers increase, which might suggest that H3K27me3 decrease induced silence of a series of genes and promoted apoptosis.
Figure 8. L501-1669 inhibited EZH2 methyltransferase activity and induced apoptosis. (a) H3K27me3 expression after different time points of GSK126 and L501-1669 treatment. (b, c) Relative density in a. The values were normalized against the non-treated sample. Error bars represent the SDs (n = 3, *P < 0.05; **P < 0.01; ***P < 0.001). (d, e) Cell apoptosis of A704 after different treatments. (f) Quantification of d and e. The values were the percentage of apoptosis cells. Error bars represent the SDs (n = 3, *P < 0.05; **P < 0.01; ***P < 0.001). (g) Bcl-2 and Bax expression after L501-1669 treatment. (h) Relative density in g. The values were normalized against the non-treated sample. Error bars represent the SDs (n = 3, *P < 0.05; **P < 0.01; ***P < 0.001)
4. Discussion
Recently, bulks of studies have shown that epigenetic modification is closely related to the occurrence and development of cancer. Epigenetic abnormalities have important effects on chromatin structure, gene expression and basic life activities of cells, and are key factors in inducing diseases such as cancer. Epigenetics therapy has been demonstrated to be a feasible strategy for the treatment of different malignancies, as supported by the approval of the DNMTs and HDACs inhibitors by US. Food and Drug Administration [Citation31].
EZH2 is the core subunit of PCR2 complex, regulating the expression of genes at the epigenetic level, and has become a hotspot of a tumor-targeted drug. The expression of EZH2 has been reported to be associated with the malignancy in the prostate, breast and endometrial cancers and can be utilized as an independent maker for diagnosis [Citation32]. Our bioinformatics analysis revealed the overexpression of EZH2 in KIRC, LGG, LIHC and its correlation with poor prognosis (). These results suggest that EZH2 serves as an attractive target for cancer diagnosis and treatment.
Structure-based drug discovery has long been performed to assist fast and cost-efficient lead discovery and optimization, which has been proven to be a beneficial supplement to the traditional way of drug discovery since it aims to understand the molecular basis of a key factor involved in disease development [Citation33]. In the current study, we performed high-throughput docking and molecular dynamics simulation to discover the leading compounds for targeted EZH2 inhibition. We screened a total of 47,737 drug-like compounds. Our two-round scoring strategy enabled us to identify five putative EZH2 inhibitors for further validation (). Among the five compounds, only L501-1669 showed a differential inhibitory effect in the proliferation of PBRM1 wild-type (Caki-1) and deficient (A704) ccRCC cell lines (). Even though we validated the reliability of Caki-1 and A704 cells with GSK126, an established EZH2 inhibitor (), we were still concerned about the impact of the difference in the genetic background of these cell lines. To reduce this impact, we established isogenic cell lines with short hairpin RNA interference knockdown and confirmed the effectiveness of L501-1669 ().
It has demonstrated that ARID1A-deficient tumors appeared to be addicted to EZH2 activity, and the pharmacological inhibition of EZH2 promoted the upregulation of PIK3IP1 and contributed to the synthetic lethality through the inhibition of the PI3K–AKT pathway [Citation34]. Like for other SWI/SNF subunits, a functional dependency on EZH2 catalytic activity has been described for PBRM1-mutant tumors [Citation11]. Morel et al. thought that whether alternative epigenetic antagonism or synthetic lethal relationships described with other SWI/SNF subunits could also apply to PBRM1 warrants further investigation [Citation35]. In our study, L501-1669 effectively inhibited the methyltransferase activity of EZH2 (). At the same time, after treatment with L501-1669, the PBRM1-mutant cell line showed an increase in apoptosis (). Studies have demonstrated that EZH2 can suppress apoptosis through different mechanisms, such as epigenetically modulation of Bim expression [Citation36], or by silencing the proapoptotic miR-31. Methyltransferase inhibition induces p53-dependent apoptosis [Citation37], probably, L501-1669 treatment caused H3K27me3 decrease to induc silence of a series of genes and promot apoptosis. However, whether the L501-1669 induced apoptosis observed in the current study is related to the inhibition of EZH2 methyltransferase activity still needs to be further investigated.
In conclusion, our study identified L501-1669 as a promising leading compound for EZH2 inhibition is applicable to ccRCC patients with PBRM1 mutations, and in other cancer patients who have gene mutations that have demonstrated to be synthetic lethal with EZH2. Simultaneously, the IC50 values of A704 after GSK126 treatment, which entered phase 1 clinical trial, were almost three times less than L501-1669 treatment, which further indicated L501-1669 is a promising inhibitor. Meanwhile, due to its relatively high IC50, this leading compound still needs to be chemically optimize its chemical structure to achieve a better therapeutic effect.
Competing interests
The authors declare that they have no competing interests.
Acknowledgments
We acknowledge and appreciate our colleagues for their valuable efforts and comments on this paper.
Disclosure statement
No potential conflict of interest was reported by the authors.
Additional information
Funding
References
- Siegel RL, Miller KD, Jemal A. Cancer statistics, 2019. CA Cancer J Clin. 2019;69(1):7–34.
- Bray F, Ferlay J, Soerjomataram I, et al. Global cancer statistics 2018: GLOBOCAN estimates of incidence and mortality worldwide for 36 cancers in 185 countries. CA Cancer J Clin. 2018;68(6):394–424.
- Hsieh JJ, et al. Renal cell carcinoma. Nat Rev Dis Primers. 2017;3:17009.
- Hartwell LH, et al. Integrating genetic approaches into the discovery of anticancer drugs. Science. 1997;278(5340):1064–1068.
- Bryant HE, Schultz N, Thomas HD, et al. Specific killing of BRCA2-deficient tumours with inhibitors of poly(ADP-ribose) polymerase. Nature. 2005;434(7035):913–917.
- Farmer H, McCabe N, Lord CJ, et al. Targeting the DNA repair defect in BRCA mutant cells as a therapeutic strategy. Nature. 2005;434(7035):917–921.
- McLornan DP, List A, Mufti GJ. Applying synthetic lethality for the selective targeting of cancer. N Engl J Med. 2014;371(18):1725–1735.
- Lord CJ, Ashworth A. PARP inhibitors: synthetic lethality in the clinic. Science. 2017;355(6330):1152–1158.
- Nargund AM, Pham CG, Dong Y, et al. The SWI/SNF protein PBRM1 restrains VHL-loss-driven clear cell renal cell carcinoma. Cell Rep. 2017;18(12):2893–2906.
- The Cancer Genome Atlas Research Network.Comprehensive molecular characterization of clear cell renal cell carcinoma. Nature. 2013;499(7456):43–49.
- Kim KH, Kim W, Howard TP, et al. SWI/SNF-mutant cancers depend on catalytic and non-catalytic activity of EZH2. Nat Med. 2015;21(12):1491–1496.
- Gall Troselj K, Novak Kujundzic R, Ugarkovic D. Polycomb repressive complex’s evolutionary conserved function: the role of EZH2 status and cellular background. Clin Epigenetics. 2016;8:55.
- Pettersen EF, Goddard TD, Huang CC, et al. UCSF Chimera? A visualization system for exploratory research and analysis. J Comput Chem. 2004;25(13):1605–1612.
- Li J, Yang Q, Zhang Y, et al. Compound F779-0434 causes synthetic lethality in BRCA2-deficient cancer cells by disrupting RAD52–ssDNA association. RSC Adv. 2018;8(34):18859–18869.
- Daina A, Michielin O, Zoete V. SwissADME: a free web tool to evaluate pharmacokinetics, drug-likeness and medicinal chemistry friendliness of small molecules. Sci Rep. 2017;7:42717.
- Pronk S, Páll S, Schulz R, et al. GROMACS 4.5: a high-throughput and highly parallel open source molecular simulation toolkit. Bioinformatics. 2013;29(7):845–854.
- Laskowski RA, Swindells MB. LigPlot+: multiple ligand-protein interaction diagrams for drug discovery. J Chem Inf Model. 2011;51(10):2778–2786.
- Wallace AC, Laskowski RA, Thornton JM. LIGPLOT: a program to generate schematic diagrams of protein-ligand interactions. Protein Eng. 1995;8(2):127–134.
- Tang Z, Li C, Kang B, et al. GEPIA: a web server for cancer and normal gene expression profiling and interactive analyses. Nucleic Acids Res. 2017;45:W98–w102.
- Sun C, Zhao C, Li S, et al. EZH2 Expression is increased in BAP1-mutant renal clear cell carcinoma and is related to poor prognosis. J Cancer. 2018;9(20):3787–3796.
- Lee HW, Choe M. Expression of EZH2 in renal cell carcinoma as a novel prognostic marker. Pathol Int. 2012;62(11):735–741.
- Wagener N, Holland D, Bulkescher J, et al. The enhancer of zeste homolog 2 gene contributes to cell proliferation and apoptosis resistance in renal cell carcinoma cells. Int J Cancer. 2008;123(7):1545–1550.
- Yamagishi M, Uchimaru K. Targeting EZH2 in cancer therapy. Curr Opin Oncol. 2017;29(5):375–381.
- Berezovska OP, et al. Essential role for activation of the Polycomb group (PcG) protein chromatin silencing pathway in metastatic prostate cancer. Cell Cycle. 2006;5(16):1886–1901.
- Chen Z, Yang P, Li W, et al. Expression of EZH2 is associated with poor outcome in colorectal cancer. Oncol Lett. 2018;15(3):2953–2961.
- Yi X, Guo J, Guo J, et al. EZH2-mediated epigenetic silencing of TIMP2 promotes ovarian cancer migration and invasion. Sci Rep. 2017;7(1):3568.
- Gao W, Li W, Xiao T, et al. Inactivation of the PBRM1 tumor suppressor gene amplifies the HIF-response in VHL−/−clear cell renal carcinoma. Proc Natl Acad Sci U S A. 2017;114(5):1027–1032.
- Sauvageau M, Sauvageau G. Polycomb group proteins: multi-faceted regulators of somatic stem cells and cancer. Cell Stem Cell. 2010;7(3):299–313.
- Chowdhury B, Porter EG, Stewart JC, et al. PBRM1 regulates the expression of genes involved in metabolism and cell adhesion in renal clear cell carcinoma. PLoS One. 2016;11(4):e0153718.
- McCabe MT, Ott HM, Ganji G, et al. EZH2 inhibition as a therapeutic strategy for lymphoma with EZH2-activating mutations. Nature. 2012;492(7427):108–112.
- Fardi M, Solali S, Farshdousti Hagh M. Epigenetic mechanisms as a new approach in cancer treatment: an updated review. Genes Dis. 2018;5(4):304–311.
- Bachmann IM, Halvorsen OJ, Collett K, et al. EZH2 expression is associated with high proliferation rate and aggressive tumor subgroups in cutaneous melanoma and cancers of the endometrium, prostate, and breast. J Clin Oncol. 2006;24(2):268–273.
- Lionta E, Spyrou G, Vassilatis D, et al. Structure-based virtual screening for drug discovery: principles, applications and recent advances. Curr Top Med Chem. 2014;14(16):1923–1938.
- Bitler BG, Aird KM, Garipov A, et al. Synthetic lethality by targeting EZH2 methyltransferase activity in ARID1A-mutated cancers. Nat Med. 2015;21(3):231–238.
- Morel D, Almouzni G, Soria J-C, et al. Targeting chromatin defects in selected solid tumors based on oncogene addiction, synthetic lethality and epigenetic antagonism. Ann Oncol. 2017;28(2):254–269.
- Wu ZL, Zheng SS, Li ZM, et al. Polycomb protein EZH2 regulates E2F1-dependent apoptosis through epigenetically modulating Bim expression. Cell Death Differ. 2010;17(5):801–810.
- Schwerk C, Schulze-Osthoff K. Methyltransferase inhibition induces p53-dependent apoptosis and a novel form of cell death. Oncogene. 2005;24(47):7002–7011.