
ABSTRACT
Hepatocellular carcinoma (HCC) is recognized for its high mortality rate worldwide. Based on intensive studies, long non-coding RNA (lncRNA) expression exerts significant effects on tumor suppression. Herein, we investigated the molecular mechanism of lymphoid enhancer-binding factor-1 antisense RNA 1 (LEF1-AS1) in HCC cells. Microarray-based gene expression analysis was adopted to predict and verify the differentially expressed genes in HCC, which predicted cell division cycle-associated 7 (CDCA7) and LEF1-AS1 to be highly expressed in HCC. The expression of LEF1-AS1, CDCA7, CCAAT/enhancer-binding protein beta (CEBPB) and enhancer of zeste homolog 2 (EZH2) was determined by means of reverse transcription quantitative polymerase chain reaction (RT-qPCR) and western blot analysis. LncMap was used to predict the lncRNA-transcription factor-gene interaction in HCC. ChIP, RIP assay and dual luciferase reporter gene assay were employed to verify the relationship between the transcription factor and gene. Silencing of LEF1-AS1 could downregulate CDCA7 expression through CEBPB. Overexpression of LEF1-AS1, EZH2 and CDCA7 promoted proliferation and invasion in HCC cells. LEF1-AS1 promoted CDCA7 expression to further upregulate EZH2. Tumor formation in nude mice was assessed to verify the experimental results. Silencing of LEF1-AS1 inhibited the growth of tumors in vivo. Collectively, silencing LEF1-AS1 inhibited the proliferation and invasion of HCC cells by down-regulating EZH2 through the CEBPB-CDCA7 signaling pathway, which provides scientific evidence for the treatment of HCC.
Abbreviations: HCC: Hepatocellular carcinoma; lncRNA: long non-coding RNA; LEF1-AS1: lymphoid enhancer-binding factor-1 antisense RNA 1; EZH2: enhancer of zeste homolog 2; CDCA7: cell division cycle-associated 7; GEO: Gene Expression Omnibus; NC: negative control; oe: overexpressed; RT-qPCR: reverse transcription quantitative polymerase chain reaction; PBS: phosphate buffered saline; HRP: horseradish peroxidase; OD: optical density; RIP: Radioimmunoprecipitation; ChIP: Chromatin immunoprecipitation; WT: wild type.
Introduction
Hepatocellular carcinoma (HCC) is categorized under heterogeneous diseases and its development is often caused by various etiologies, including hepatitis B virus, metabolic syndrome and chronic alcohol abuse [Citation1]. As one of the most prevalent cancers worldwide, HCC accounts for 5.6% of all clinically diagnosed cancer cases with high mortality [Citation2]. HCC can be triggered by aberrant proto-oncogene activation or tumor suppressor inactivation in liver cells, with implication of various abnormally regulated signaling pathways to facilitate hepatocarcinogenesis [Citation3].
Long non-coding RNAs (lncRNAs) have been implicated for their functionality in several biochemical and molecular mechanisms, including cis- and trans-regulation of gene expression [Citation4]. Increasing evidence suggests the association of lncRNAs with tumorigenicity of carcinomas, including proliferation, metastasis, and apoptosis in breast cancer, non-small cell lung cancer, and ovarian cancer [Citation5–Citation7]. Reports have flagged the involvement of different lncRNAs in HCC progression, such as DDX11 antisense RNA 1, a lncRNA associated with liver regeneration, and lncRNA-Dreh [Citation8–Citation10]. LncRNA lymphoid enhancer-binding factor 1 antisense RNA 1 (LEF1-AS1), located at chromosome 4q25, has been reported to serve as an oncogene of glioblastoma; and its downregulation inhibited the malignancy of glioblastoma cells by inducing proliferation and invasion, and by promoting cell apoptosis [Citation11]. The involvement of LEF1-AS1 has been evident in other different tumors, including lung cancer and prostatic cancer [Citation12,Citation13]. However, the role of LEF1-AS1 in HCC has not been extensively investigated.
In addition, cell division cycle-associated 7 (CDCA7), with its two somatic paralogs (CDCA7 and CDCA7L) and one highly conserved 4CXXC zinc finger domain, has emerged as a vital transcription factor under modulation of c-Myc [Citation14]. Existing studies have demonstrated the involvement of CDCA7 in Myc-mediated tumorigenesis, while Myc is involved in HCC progression [Citation15,Citation16]. However, the specific role of LEF1-AS1 and CDCA7 in HCC requires further investigation. Therefore, this study also aims to investigate the effect of LEF1-AS1 and CDCA7 on HCC cell proliferation and invasion, and the underlying interaction between LEF1-AS1 and CDCA7.
Materials and methods
Ethics statement
This study was approved by the Ethics Committee of the Second Affiliated Hospital of Nanchang University. Written informed consents were obtained from all patients. All the animal experiment protocols were approved by the Animal Care and Use Committee of the Second Affiliated Hospital of Nanchang University.
Microarray-based gene expression analysis
The underlying mechanism of lncRNA LEF1-AS1 and CDCA7 in tumors was comprehended by an extensive research on relevant literature in the National Center of Biotechnology Information database (https://www.ncbi.nlm.nih.gov/). The microarrays of HCC were obtained from the Gene Expression Omnibus (GEO) database (https://www.ncbi.nlm.nih.gov/geo/) for differential analysis using the “Limma” package of R language with the criteria of |log FoldChange| > 1.5 and p < 0.05. The expression of LEF1-AS1 and CDCA7 in HCC was detected using the Starbase database (http://starbase.sysu.edu.cn/), and the prognosis of CDCA7 in HCC and the expression of CDCA7 in other carcinomas were predicted using the UALCAN database (http://ualcan.path.uab.edu/analysis.html). The relationship between lncRNA LEF1-AS1 and CDCA7 was predicted using the LncMap databse (http://bio-bigdata.hrbmu.edu.cn/LncMAP/index.jsp). Then, the interaction of lncRNA-transcription factors-gene was obtained.
HCC samples
Eighty patients with clinically diagnosed HCC admitted to the hepatobiliary surgery department of the Second Affiliated Hospital of Nanchang University from January 2018 to March 2019 were selected to collect HCC tissues and adjacent normal tissues. The patient age varied from 21 to 74 years old. No patients received palliative resection, preoperative chemotherapy or radiotherapy. Pathological features of the patients were detected including age, gender, etiology, presence of cirrhosis, alpha-fetoprotein, tumor size, tumor differentiation, vascular invasion and tumor staging. The tumor classification was conducted in accordance with the pathological tumor-node-metastasis classification advocated by the League of Nations.
Cell culture and transfection
The human HCC cell line HepG2 and immortalized normal liver cell line HL7702 were purchased from the American Type Culture Collection (https://www.atcc.org/; Manassas, VA, USA). All cells were cultured using Dulbecco’s modified Eagle’s medium (DMEM; Thermo Fisher Scientific, Inc., Waltham, MA, USA) supplemented with 10% fetal bovine serum (FBS, 10100147, Gibco BRL, Invitrogen, CA, USA) in 5% CO2 at 37°C.
The lentivirus packaging system comprising of LV5-GFP (lentivirus gene overexpression vector) and pSIH1-H1-copGFP (lentivirus short-hairpin RNA [shRNA] fluorescent expression vector) was constructed. The shRNA (sh) against LEF1-AS1, CDCA7, CEBPB, enhancer of zeste homolog (EZH2), and negative control (NC) was synthesized by the Shanghai GenePharma (Shanghai, China). The packaging virus and the target vector were co-transfected into HEK293T cells. After 48 h of cell culture, the supernatant was isolated. Virus particles were filtered and centrifuged in order to detect the viral titer. The virus was treated with different vectors including sh-NC, overexpressed (oe)-NC, sh-LEF1-AS1, sh-CDCA7, oe-CDCA7, sh-CEBPB, oe-CEBPB, oe-EZH2, sh-MALAT1, sh-LEF1-AS1 + sh-CEBPB, sh-LEF1-AS1 + oe-CEBPB, sh-LEF1-AS1 + sh-CDCA7, sh-LEF1-AS1 + oe-CDCA7, sh-CDCA7 + sh-EZH2, or sh-CDCA7 + oe-EZH2. Cells in the logarithmic phase were treated with trypsin and triturated to attain the necessitated concentration of the cell suspension (5 × 10⁴ cells/mL). The cell suspension was then seeded in a 6-well plate with 2 mL per well, and subjected to overnight incubation at 37°C. After 48 h of transfection, the expression of related genes in each group was determined by conducting reverse transcription quantitative polymerase chain reaction (RT-qPCR).
In situ hybridization
In situ hybridization was conducted in accordance with the procedures as reported previously [Citation17]. Paraffin-embedded sections of HCC tissues were deparaffinized and rehydrated using an ethanol series. Endogenous peroxidase activity was terminated by the addition of 3% H2O2 for 30 min. Following the detachment using proteinase K for 5 min, slides were fixed using 4% paraformaldehyde and rinsed in phosphate buffered saline (PBS). Slides were incubated in hybridization buffer at 60°C for 2 h, and incubated with the LEF1-AS1 or scrambled LEF1-AS1 control probes (50 nM; digoxigenin-labeled LNA probes, Exiqon, Vedbaek, Denmark) at 60°C overnight. The slides were rinsed with 50% formamide in 2 × saline sodium citrate and PBS in combination with Tween-20. Nitroblue tetrazolium/5-bromo-4-chloro-3-indolyl- phosphate was added to facilitate the alkaline phosphate reaction, and the slides were mounted in an aqueous mounting medium and observed under the Olympus BX-60 microscope (Olympus Optical Co., Ltd., Tokyo, Japan).
Immunohistochemistry
HCC tissues were fixed using 4% formaldehyde solution for 12 h, followed by conventional xylene dewaxing and gradient alcohol dehydration. For antigen retrieval, the sections were subjected to pretreatment with 0.01 M citric acid buffer solution for 15–20 min. The sections were blocked using the normal goat serum solution for 20 min at room temperature. Next, the sections were hybridized using 50 μL primary antibodies to CDCA7 (ab238744, 1:500, Abcam Inc., Cambridge, UK) and EZH2 (ab191080, 1:250, Abcam Inc., Cambridge, UK) for 1 h and with 50 μL of goat-anti-rabbit secondary antibody (ab6728, 1:1000, Abcam Inc., Cambridge, UK) for 1 h at room temperature. Then, streptavidin-horseradish peroxidase (HRP) was added to the sections for a reaction at 37°C for 30 min, and developed using diaminobenzidine for 5–10 min. The stained sections were counterstained using hematoxylin for 2 min, dehydrated, cleared, mounted and observed under an optical microscope.
RNA isolation and quantitation
Total RNA was extracted from the HCC tissues and cells using Trizol (Invitrogen Inc., Carlsbad, CA, USA). The quality and concentration of RNA were determined by conducting ultraviolet-visible spectrophotometry (ND-1000, Nanodrop Technologies, Wilmington, USA). A PrimeScript RT Reagent Kit (Takara Company, Dalian, Liaoning, China) was utilized for reverse transcription. Then the PCR was performed using the cDNA as a template following the provided instructions of the SYBR Premix Ex Taq II (Tli RNaseH Plus) kit (Takara Company, Shiga, Japan). The reaction was conducted with the amplifier “Thermal Cycler Dice Real Time System” (TP800, Takara, Shiga, Japan). Primers were synthesized by Guangzhou RiboBio Co., Ltd. (Guangzhou, Guangdong, China) (). Glyceraldehyde-3-phosphate dehydrogenase (GAPDH) served as an internal reference. Relative expression of the target gene was calculated based on the 2−ΔΔCT method.
Table 1. Primer sequence for real-time quantitative polymerase chain reaction
Western blot analysis
HCC tissues or cells were lysed using the cell lysis buffer (C0481, Sigma-Aldrich, St Louis, MO, USA) at 4°C for 30 min. The cell lysate was transferred into multiple 1.5 mL eppendorf tubes and centrifuged at 12,000 g at 4°C for 15 min. The protein concentration was determined using a bicinchoninic acid protein assay kit (Beyotime Biotechnology, Shanghai, China). With 10% sodium dodecyl sulfate-polyacrylamide gel electrophoresis, 20 mg protein sample was transferred onto a polyvinylidene fluoride membrane (Millipore, Billerica, MA, USA). Membrane was blocked using 5% skimmed milk powder for 1 h, and incubated overnight with Tris-buffered saline in combination with Tween20-diluted rabbit antibodies to CDCA7-1 (ab246958, 1:1000), CEBPB-1 (ab53138, 1:1000) and EZH2-1 (ab191080, 1:250) (Abcam Inc., Cambridge, UK). After a regimen of incubation with the HRP-labeled secondary antibody (goat anti-rat or goat anti-rabbit, TransGen Biotech, Beijing, China) at room temperature for 1 h, the reactive bands were visualized by chemiluminescence (Shanghai BaomanBio Co., Ltd., Shanghai, China). The intensities of the bands were quantified using the gel image analysis software Image J with the rabbit antibody to GADPH (ab37168, 1:1000, Abcam Inc., Cambridge, UK) as internal reference.
3-(4,5-dimethylthiazol-2-Yl)-2,5-diphenyltetrazolium bromide (MTT) assay
A cell proliferation kit (C0009, Beyotime, Shanghai, China) was employed to detect cell viability. The HCC cells were collected 24 h after transfection and treated using trypsin. The cells were diluted and seeded into 96-well plates at a density of 4 × 10³ cells/well (200 μL complete culture medium), and supplemented with 20 μL 5 mg/mL MTT solution. The optical density (OD) value of cells was measured at an excitation wavelength of 570 nm with a microplate reader (US6111636, Thermo Fisher Scientific Inc., Waltham, MA, USA) after culturing for 4 h at 37°C with 5% CO2. The 3 parallel cells were set for each group.
Colony formation assay
HCC cells were counted after treatment with trypsin. Cells were cultured in 6-well plates for 7–10 d at a density of 1.0 × 10³ cells/chamber. Colonies were imaged using crystal violet staining and observed under a microscope.
Transwell assay
HCC cells were trypsinized and seeded at a concentration of 2.5 × 10⁵ cells per mL in FBS-free DMEM. Next, a total of 0.2 mL suspension was added to the apical chamber coated with Matrigel (E1270-1ML, Sigma-Aldrich, St Louis MO, USA), and 700 mL precooled DMEM containing 10% FBS was added to the basolateral chamber. The chamber was subjected to incubation in a saturated humidity incubator at 37°C with 5% CO2. After 24 h, cells on the upper side of the filter were extracted with a cotton swab. Cells with penetrance to the lower membrane surface were fixed with methanol for 30 min, stained using 0.1% crystal violet for 20 min, rinsed under running water, and air-dried. Cells were counted under an inverted microscope (×200) from 5 randomly selected fields per well.
Radioimmunoprecipitation (RIP) assay
The binding capacity of LEF1-AS1 to the transcription factor CEBPB was determined using a RIP kit (Millipore Corp., Bedford, MA, USA). The cells were lysed over ice for 5 min. The supernatants were obtained after centrifugation at 4°C for 10 min at 14,000 g. Cell extraction was co-precipitated with the antibody. The detailed procedures were as follows: each co-precipitation reaction system was rinsed with 50 μL magnetic beads and then resuspended using 100 μL RIP wash buffer. According to the experimental group, 1 μg antibody was added to facilitate incubation for binding. After rinsing, the magnetic beads-antibody complex was resuspended using 900 μL RIP wash buffer, and incubated overnight with 100 μL cell extracts at 4°C. Samples were placed on magnetic pedestals to isolate the beads-protein complexes and detached using protease K, and RNA was extracted for subsequent PCR detection. The antibodies for RIP were rabbit antibodies against CEBPB (ab53138, 1:1000, Abcam Inc., Cambridge, UK) and IgG (ab6728, 1:1000, Abcam Inc., Cambridge, UK).
Chromatin immunoprecipitation (ChIP) assays
Cells were fixed using formaldehyde for 10 min at room temperature and lysed in 200 μL SDS. Cross-linking was performed for 10 min, and the DNA was fragmented into pieces of 200–1000 bp in length by sonication. Soluble chromatin was co-immunoprecipitated with the anti-mouse antibody to CEBPB (ab15050, 1:100, Abcam, UK) or anti-rabbit antibody to IgG (ab171870, 1:100, Abcam) at 4°C overnight. The de-crosslinked DNA samples were subjected to PCR for an assessment of the enrichment of CEBPB and CDCA7, with the forward primer of CDCA7 (TTTCACCACCCACCGATAGC) and the reverse primer (CTGTGGTAACGGCCAGACAT).
Dual luciferase reporter gene assay
PmirGLO-CDCA7-wild type (WT) and PMirGLO-CDCA7-mutant (MUT) were constructed. Reporter plasmids sh-CEBPB, oe-CEBPB and NC plasmids were co-transfected into HEK293T cells respectively. After 24 h of transfection, the lysed cells were centrifuged at 12,000 rpm for 1 min to collect the supernatant. Luciferase activity was determined using a Dual-Luciferase Reporter Assay System (E1910, Promega, Madison, WI, USA). The relative firefly luciferase activities were normalized to renilla luciferase.
In vivo tumor growth assay
A total of 30 BALA/c nude mice (4 weeks old, weighing 18–25 g, no limitation with gender) were purchased from the Hunan SJA Laboratory Animal Co., Ltd. (Changsha, Hunan, China). The mice were housed under specific-pathogen-free grade environment. LEF1-AS1 silenced cancer cells or empty vector control cells (5 × 10³ cells/mice) were subcutaneously injected into the flank region of the mice (15 mice/group). The calculated volume was measured on the 7th day after inoculation, and the nude mice were euthanatized using carbon dioxide asphyxiation after the experiment. The curve of average volume at each time point was plotted.
Statistical analysis
All data were analyzed using the SPSS 21.0 software (IBM Corp. Armonk, NY, USA). Measurement data were expressed as mean ± standard deviation. A value of p < 0.05 was indicative of statistically significant difference. Paired t-test was adopted for comparing the data of two paired designs with normal distribution and homogeneous variance. Unpaired t-test was adopted for comparing the data of two groups of non-paired designs with normal distribution and homogeneous variance. Two-way analysis of variance was adopted for comparing the data at different time points among multiple groups.
Results
CDCA7 and LEF1-AS1 are highly expressed in HCC samples
Firstly, the Starbase database was used to analyze the expression of lncRNA LEF1-AS1 in HCC, and LEF1-AS1 was found with high expression in HCC ()). Using the GEO database, the microarray GSE45267 was retrieved, which comprised of 17 normal samples and 15 HCC samples. The difference in the gene expression between tumor samples and the normal samples was analyzed. Our result confirmed that CDCA7 gene was significantly overexpressed in HCC ()). Through the Starbase database, the CDCA7 gene was evidently expressed in HCC ()). Additionally, the prognosis of CDCA7 in HCC was analyzed using the UALCAN database, which highlighted the potential of CDCA7 to predict the survival of patients with HCC (). Furthermore, a highly-expressed CDCA7 was observable in other tumors ()). Therefore, according to our results of the microarray-based gene expression analysis, CDCA7 and LEF1-AS1 were all predicted with high expression in HCC. Hence, we suspected LEF1-AS1 and CDCA7 to stimulate the progression of HCC.
Figure 1. HCC tissues show higher expression of CDCA7 and LEF1-AS1, which might be involved in the HCC progression. (a) Expression of lncRNA LEF1-AS1 in HCC in Starbase database. The X axis represents the gene expression, and the Y axis represents grouping information. (b) Expression of CDCA7 in HCC microarray GSE45267. (c) Expression of CDCA7 in HCC in Starbase database. The X axis represents the gene expression, and the Y axis represents grouping information. (d) the Kaplan Meier survival analysis of CDCA7 gene for the difference of survival rate between high expression group and low expression group. The X axis represents the observation time, and the Y axis represents the survival rate. (e) The expression of the CDCA7 gene in various solid tumors; blue indicates the gene expression in the normal tissue and red indicates the gene expression in the tumor tissue. (f) Expression of LEF1-AS1 and CDCA7 as determined by RT-qPCR in liver samples in comparison to the adjacent normal tissues of 80 patients with HCC. (g) LEF1-AS1 expression in HCC determined by in situ hybridization (400 ×). (h), CDCA7 expression in HCC determined by immunohistochemistry (400 ×). The data were analyzed by means of the paired t test. *p < 0.05.
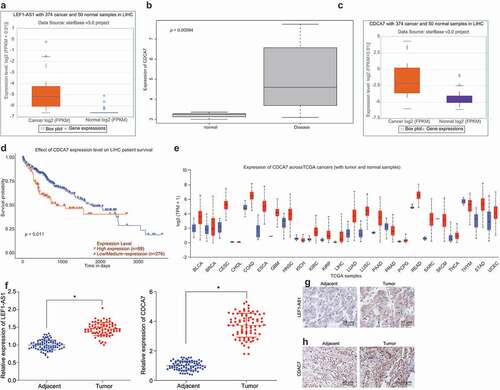
Next, in order to verify our hypothesis, we firstly detected the expression of LEF1-AS1 and CDCA7 in HCC samples and adjacent normal tissues of 80 patients with HCC by means of RT-qPCR. The results showed significantly higher expression of LEF1-AS1 and CDCA7 in HCC tissues in comparison to the adjacent normal tissues ()). The in situ hybridization was exhibitive of a significantly higher expression of LEF1-AS1 in HCC than the adjacent normal tissues ()). In addition, immunohistochemistry revealed a significantly higher expression of CDCA7 in HCC than the adjacent normal tissues ()). Altogether, these results suggested that LEF1-AS1 and CDCA7 are highly expressed in HCC with involvement in facilitating the occurrence of HCC.
The upregulated LEF1-AS1 and CDCA7 in HepG2 cells promote cell proliferation and invasion
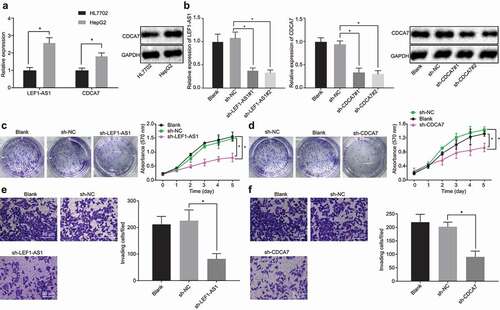
To further investigate the expression of LEF1-AS1 and CDCA7 in HCC cells, initially, we detected the expression of LEF1-AS1 and CDCA7 in HepG2 cell lines versus HL7702 normal hepatocyte lines by RT-qPCR and Western blot analysis. The RT-qPCR results showed that the expression of LEF1-AS1 and CDCA7 in HepG2 cells was significantly higher than that observed in HL7702 cells. The protein expression of CDCA7 determined by Western blot analysis was consistent with the mRNA expression results determined by RT-qPCR ()). Further, we silenced LEF1-AS1 and CDCA7 in HepG2 cells using two pairs of shRNA. The results of RT-qPCR and Western blot analysis showed that after silencing LEF1-AS1 and CDCA7 respectively, the LEF1-AS1 expression and the mRNA expression of CDCA7 decreased significantly, and the protein expression of CDCA7 decreased significantly ()). MTT and colony formation assays which were performed with the shRNA demonstrated higher silencing efficiency toward the decreased cell viability and colony formation after silencing LEF1-AS1 and CDCA7 respectively ( and )). Transwell assay showed a significant decrease in the invasive ability of HCC cells after silencing LEF1-AS1 and CDCA7 respectively ( and )). Conjointly, these results indicate that the highly expressed LEF1-AS1 and CDCA7 in HCC cells could stimulate the proliferation and invasion of HCC cells.
Figure 2. LEF1-AS1 and CDCA7 are highly expressed in HCC cells and promote cell proliferation and invasion. (a) LEF1-AS1 and CDCA7 expression in HepG2 cells as determined by RT-qPCR and Western blot analysis, normalized to GAPDH. (b) Knockdown effect of LEF1-AS1 and CDCA7 determined by RT-qPCR and Western blot analysis respectively, normalized to GAPDH. (c and d) Cell proliferation and colony formation assays after silencing LEF1-AS1 and CDCA7, respectively. (e and f) Cell invasion ability determined by Transwell assay after silencing LEF1-AS1 and CDCA7, respectively (200 ×). *p < 0.05. The t-test was adopted for data analysis between the two groups, one-way ANOVA was adopted for data analysis among multiple groups, and two-way ANOVA was adopted for data analysis at different time points. The experiment was repeated three times independently.
LEF1-AS1 promotes the expression of CDCA7 by recruiting transcription factor CEBPB into the promoter region of CDCA7
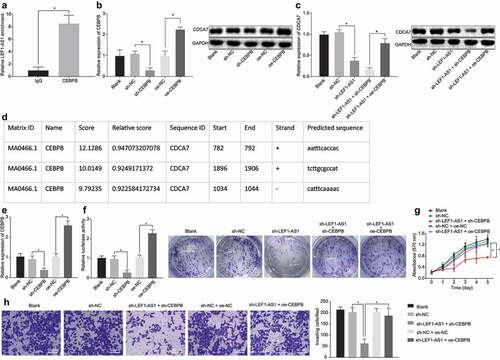
Prediction of the lncRNA-transcription factor-gene triplets of lncRNA LEF1-AS1 and CDCA7 genes in the LncMap database showed that LEF1-AS1 could regulate the expression of CDCA7 via the transcription factor CEBPB. In order to verify the regulatory mechanism predicted by microarray-based gene expression analysis, RIP assay was conducted so as to validate whether LEF1-AS1 could bind to CEBPB. In comparison with the IgG treatment as control, the enrichment of LEF1-AS1 increased significantly by CEBPB, indicating the potential of CEBPB to specifically bind to LEF1-AS1 ()). Then, we delivered sh-CEBPB or oe-CEBPB into the HCC cells, and the results of RT-qPCR and Western blot analysis were demonstrative of successful delivery ()). In order to further study the regulatory effects of LEF1-AS1 and CEBPB on CDCA7, RT-qPCR and Western blot analysis were conducted. The results showed that silencing LEF1-AS1 could inhibit the expression of CDCA7, and silencing both LEF1-AS1 and CEBPB in cells could further impede the expression of CDCA7; while overexpression of CEBPB and silencing LEF1-AS1 in cells simultaneously reinstated the expression of CDCA7 ()). Further analysis of the UCSC and JASPAR websites revealed the presence of multiple binding sites in CEBPB and CDCA7 ()). The ChIP assays showed that the enrichment of CEBPB in the CDCA7 promoter was enhanced after CEBPB overexpression but reduced after CEBPB knockdown ()). Consistently, the luciferase activity of CDCA7-wt was significantly higher in the cells with overexpressed CEBPB compared to the cells with silenced CEBPB ()). MTT and colony formation assays provided evidence supporting that simultaneous silencing of CEBPB and LEF1-AS1 significantly inhibited cell proliferation, while overexpression of CEBPB in cells with silenced LEF1-AS1 significantly restored cell proliferation ()). Transwell assay showed consistent results with the proliferation detected using MTT ()). These findings sustained our hypothesis that LEF1-AS1 promotes the proliferation and invasion of HCC cells by recruiting CEBPB to promote the expression of CDCA7.
Figure 3. LEF1-AS1 recruits CEBPB to upregulate CDCA7 expression and HCC cell proliferation and invasion. (a) The enrichment of LEF1-AS1 by CEBPB or IgG verified by RIP assay. (b) the transfection efficiency of CEBPB determined by RT-qPCR and Western blot analysis, normalized to GAPDH. HCC cells were treated with sh-CEBPB or oe-CEBPB in the presence of sh-LEF1-AS1. (c) The mRNA and protein expression levels of CDCA7 determined by RT-qPCR and Western blot analysis, normalized to GAPDH. (d) Prediction of the binding sites between CEBPB and CDCA7 through microarray-based gene expression analysis. (e) CEBPB enrichment in the CDCA7 promoter region as determined by ChIP assay. (f) The fluorescence intensity of CEBPB in the CDCA7 promoter region as determined by dual luciferase reporter gene assay. (g) The cell proliferation determined by MTT and colony formation assays. (h) Cell invasion determined by Transwell assay (200 ×). *p < 0.05. The t-test was adopted for data analysis between the two groups, one-way ANOVA was adopted for data analysis among multiple groups, and two-way ANOVA was adopted for data analysis at different time points. The experiment was repeated three times independently.
Silencing LEF1-AS1 inhibits cell proliferation and invasion in HCC through downregulating EZH2 to mediate the CEBPB-CDCA7 signaling pathway
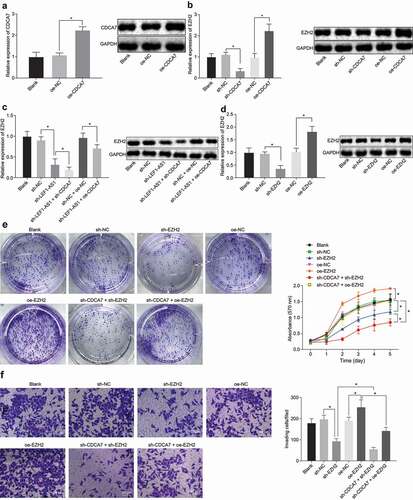
To investigate the specific mechanism of CDCA7 in the regulation of EZH2 in HCC progression, oe-CDCA7 or sh-CDCA7 was injected into the cells. The CDCA7 expression was significantly elevated following the overexpression of CDCA7, as demonstrated by both RT-qPCR and Western blot analysis ()). While silencing CDCA7 significantly inhibited the expression of EZH2, the overexpression of CDCA7 significantly promoted the expression of EZH2 ()). The aforementioned experiments prove that LEF1-AS1 upregulated the expression of CDCA7 in HCC cells via the regulation of CEBPB. We further examined whether LEF1-AS1 regulated the expression of EZH2 through CDCA7. Our results displayed that silencing LEF1-AS1 significantly inhibited the expression of EZH2. Furthermore, silencing CDCA7 further inhibited the expression of EZH2 in cells with silenced LEF1-AS1; overexpression of CDCA7 in cells with silenced LEF1-AS1 reinstated the expression of EZH2 ()). Moreover, we investigated whether LEF1-AS1 regulated the biological functions of HCC cells by upregulating the EZH2 expression through CDCA7. Firstly, we silenced or overexpressed EZH2 in HCC cells. HCC cells treated with EZH2 overexpression showed a significantly up-regulated EZH2 expression, which could be significantly down-regulated upon treatment with sh-EZH2 ()). MTT and colony formation assays showed that overexpression of EZH2 promoted cell proliferation, while silencing EZH2 inhibited cell proliferation. Interestingly, silencing of both EZH2 and CDCA7 inhibited cell proliferation, and overexpression of EZH2 restored cell proliferation in cells upon treatment with sh-CDCA7 ()). In addition, Transwell assay revealed similar results ()). These results suggest that LEF1-AS1 upregulates the EZH2 expression through mediation of CDCA7, thus potentiating HCC cell proliferation and invasion.
Figure 4. LEF1-AS1 silencing blocks cell proliferation and invasion by down-regulating EZH2 through the CEBPB-CDCA7 signaling pathway. (a) CDCA7 expression in cells after overexpression of CDCA7 by RT-qPCR and Western blot analysis. (b) EZH2 expression in cells with silenced and overexpressed CDCA7 as determined by RT-qPCR and Western blot analysis. HCC cells were treated with sh-CDCA7 or oe-CDCA7 in the presence of sh-LEF1-AS1. (c) EZH2 expression in cells determined by RT-PCR and Western blot analysis. (d) EZH2 expression in cells with silenced or overexpressed EZH2 determined by RT-qPCR and Western blot analysis. (e) The cell proliferation determined by MTT and colony formation assays. (f) Cell invasion determined by Transwell assay (200 ×). *p < 0.05. Relative expression of CDCA7 and EZH2 was normalized to GAPDH. One-way ANOVA was adopted for data analysis among multiple groups, and two-way ANOVA was adopted for data analysis at different time points. The experiment was repeated three times independently.
Silencing LEF1-AS1 inhibits the tumor growths by inhibiting expression of CDCA7 and EZH2
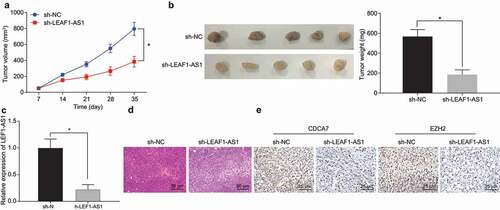
To further explore the mechanism of LEF1-AS1 in respect to regulating the growth of HCC cells in vivo, we injected the HCC cells with sh-LEF1-AS1 or sh-NC transfection into the nude mice and detected the growth of tumors by subcutaneous tumorigenesis. Silencing of LEF1-AS1 significantly inhibited the volume ()) and weight ()) of preexisting tumors. The results of RT-qPCR showed that the expression of LEF1-AS1 in nude mice with silenced LEF1-AS1 was significantly lower than that in nude mice with sh-NC ()). HE staining results showed that the pathological condition of the mice transplanted with silenced LEF1-AS1 was significantly better than the condition in control mice ()). Immunohistochemistry showed that silencing LEF1-AS1 extensively suppressed the protein expression of CDCA7 and EZH2 in vivo ()). These results suggest that silencing LEF1-AS1 in vivo could potentially inhibit the growth of HCC cells by inhibiting the expression of CDCA7 and EZH2.
Figure 5. Tumorigenesis of human HCC cells is inhibited by LEF1-AS1 silencing through mediation of the CEBPB/CDCA7/EZH2 axis. (a) Growth curve of tumors that developed in nude mice injected subcutaneously with HepG2 cells bearing sh-NC or sh-LEF1-AS1. (b) Representative micrographs and tumor weight. (c) Relative expression of LEF1-AS1 determined by RT-qPCR. (d) HE staining of the pathological changes of tumors (200 ×). (e) Immunohistochemistry of CDCA7 and EZH2 expression in tumors (400 ×). *p < 0.05. In panel a, two-way ANOVA was adopted for data analysis. In panel b and c, unpaired t test was adopted for data analysis. The cell experiment was conducted 3 times independently.
Discussion
Despite the advancements made in the treatment and prognosis of HCC, it still among the most recurrent and foremost causes of cancer associated mortality worldwide [Citation18]. With the discovery of several novel lncRNAs for therapeutic significance, lncRNAs have emerged as vital biomarkers of multiple cancer phenotypes, including HCC [Citation19]. Therefore, the identification of HCC-associated lncRNAs, investigation of their clinical significance and biological functions may provide an insight for the development of new therapeutic targets for malignancy. In this study, our findings demonstrated that LEF1-AS1 and CDCA7 were highly expressed in HCC tissues and cells, where silencing LEF1-AS1 could impede HCC progression via downregulation of EZH2 to further mediate the CEBPB-CDCA7 signaling pathway.
Benefits of the fast development of sequencing technique and bioinformatics in the past decades and genome-wide cancer mutation analyzes are widely used in detecting an extensive landscape of functional mutations within noncoding RNAs’ genome, which are with profound effects on the expression of lncRNAs in multiple cancer phenotypes [Citation20]. In this study, a high expression of CDCA7 in HCC was identified from the results of microarray-based gene expression analysis. CDCA7 and LEF1-AS1 were highly expressed in HCC using the Starbase database. Using the UALCAN database, CDCA7 has been considered as a promising marker to predict the survival of patients with HCC. Hence, the specifically high expression of LEF1-AS1 and CDCA7 in clinical samples of patients with HCC is significant for promoting a cancer manifestation. Existing literature has shown the potential of overexpressed LEF1-AS1 in lung cancer to facilitate cell proliferation and invasion [Citation12]. Liu et al. reported the presence of an overexpressed LEF1-AS1 in prostate cancer, the silencing of which could hinder EMT progression [Citation13]. Meanwhile, another study has revealed the overexpressed LEF1-AS1 in glioblastoma, which promotes cell proliferation [Citation11]. The aforementioned evidences suggest the potential of LEF1-AS1 as an inducer for cancer development. Although the biological roles and the molecular mechanism of CDCA7 in HCC have not yet been evidently investigated, an increased expression of CDCA7 was detected in the lymphoma cell lines [Citation21]. Moreover, CDCA7, as the target gene of Myc, is often over-expressed in human cancer and promotes the transformation of cancer cells [Citation15,Citation22].
The functions of lncRNAs as novel modulators can initiative complex mechanisms in many important cancer phenotypes via interactions with other cellular macromolecules, including the epigenetic regulation of protein-coding genes and exploration of dysregulated lncRNAs [Citation23]. In the current study, we found that LEF1-AS1 upregulates the expression of CDCA7 by binding to CEBPB. Regulating CEBPB has been proposed as a new modality against cancer epigenetics, which may provide optimal therapeutic alternatives in treating ovarian cancer [Citation24]. In addition, the CEBPB were also considered to be among the markers capable of determining the triple-negative breast cancer [Citation25]. The findings from our study illustrated that LEF1-AS1 could upregulate EZH2 through overexpressing CDCA7. Interestingly, numerous studies support our finding exhibiting the strong correlation between EZH2 and HCC progression [Citation17,Citation26]. CDCA7 has been reported to facilitate the occurrence and development of breast cancer cells by up-regulating EZH2 in triple-negative breast cancer [Citation27]. EZH2-regulated loss of miR-622 was evidently associated with CXCR4 overexpression and unfavorable prognosis in HCC patients [Citation17]. Furthermore, EZH2 expression could be inhibited by miR-98 via regulation of the Wnt/β-catenin signaling pathway, which proposed the potential of a promising therapeutic target for HCC patients [Citation26].
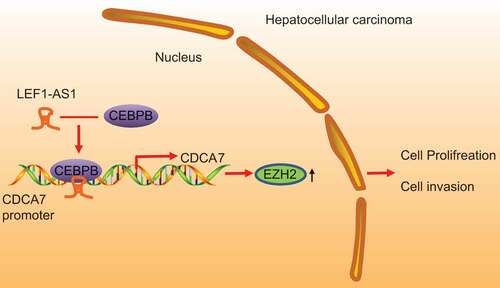
In summary, the present study demonstrated that LEF1-AS1 and CDCA7 are highly expressed in HCC, which could facilitate cell proliferation and invasion of HCC by recruiting CEBPB to elevate the expression of EZH2 (). Our findings provide an insight on a novel therapeutic target for HCC. However, further studies with larger sample sizes were significantly needed to validate our findings for the development of new therapeutic interventions.
Figure 6. A schematic diagram depicting the regulatory mechanism underlying LEF1-AS1 as an oncogene in HCC. LEF1-AS1 and CDCA7 in HCC are highly expressed. LEF1-AS1 can promote the expression of CDCA7 by recruiting CEBPB, and increase the expression of EZH2 to facilitate cell proliferation and invasion, and ultimately facilitate the progression of HCC.
Authors’ contributions
Jun Gao and Chao Dai designed the study. Xin Yu and Xiang-Bao Yin collated the data, carried out data analyses and produced the initial draft of the manuscript. Jun Gao, Chao Dai and Fan Zhou contributed to drafting the manuscript. All authors have read and approved the final submitted manuscript.
Ethics approval and consent to participate
This study was approved by the Ethics Committee of the Second Affiliated Hospital of Nanchang University. Written informed consents were obtained from all patients. All the animal experiment protocols were approved by the Animal Care and Use Committee of the Second Affiliated Hospital of Nanchang University.
Consent for publication
Written informed consents were obtained from all patients.
Availability of data and material
The datasets generated and/or analysed during the current study are available.
Acknowledgments
We give our sincere gratitude to the reviewers for their valuable suggestions.
Disclosure statement
The author declares no competing interest exists.
Additional information
Funding
References
- Schulze K, Imbeaud S, Letouze E, et al. Exome sequencing of hepatocellular carcinomas identifies new mutational signatures and potential therapeutic targets. Nat Genet. 2015 May;47(5):505–511. PubMed PMID: 25822088.
- Sherman M. Hepatocellular carcinoma: epidemiology, surveillance, and diagnosis. Semin Liver Dis. 2010 Feb;30(1):3–16. PubMed PMID: 20175029.
- Zimonjic DB, Popescu NC. Role of DLC1 tumor suppressor gene and MYC oncogene in pathogenesis of human hepatocellular carcinoma: potential prospects for combined targeted therapeutics (review). Int J Oncol. 2012 Aug;41(2):393–406. PubMed PMID: 22580498.
- Zhang R, Xia LQ, Lu WW, et al. LncRNAs and cancer. Oncol Lett. 2016 Aug;12(2):1233–1239. PubMed PMID: 27446422.
- Liu H, Li J, Koirala P, et al. Long non-coding RNAs as prognostic markers in human breast cancer. Oncotarget. 2016 Apr 12;7(15):20584–20596. PubMed PMID: 26942882.
- Ricciuti B, Mencaroni C, Paglialunga L, et al. Long noncoding RNAs: new insights into non-small cell lung cancer biology, diagnosis and therapy. Med Oncol. 2016 Feb;33(2):18. PubMed PMID: 26786153.
- Zhan L, Li J, Wei B. Long non-coding RNAs in ovarian cancer. J Exp Clin Cancer Res. 2018 Jun 19;37(1):120. PubMed PMID: 29921308.
- Liao HT, Huang JW, Lan T, et al. Identification of the aberrantly expressed LncRNAs in hepatocellular carcinoma: a bioinformatics analysis based on RNA-sequencing. Sci Rep. 2018 Mar 29;8(1):5395. PubMed PMID: 29599483.
- Xu D, Yang F, Yuan JH, et al. Long noncoding RNAs associated with liver regeneration 1 accelerates hepatocyte proliferation during liver regeneration by activating Wnt/beta-catenin signaling. Hepatology. 2013 Aug;58(2):739–751. PubMed PMID: 23483581.
- Huang JF, Guo YJ, Zhao CX, et al. Hepatitis B virus X protein (HBx)-related long noncoding RNA (lncRNA) down-regulated expression by HBx (Dreh) inhibits hepatocellular carcinoma metastasis by targeting the intermediate filament protein vimentin. Hepatology. 2013 May;57(5):1882–1892. PubMed PMID: 23239537.
- Wang J, Liu X, Yan C, et al. LEF1-AS1, a long-noncoding RNA, promotes malignancy in glioblastoma. Onco Targets Ther. 2017;10:4251–4260. PubMed PMID: 28894380.
- Wang A, Zhao C, Gao Y, et al. LEF1-AS1 contributes to proliferation and invasion through regulating miR-544a/FOXP1 axis in lung cancer. Invest New Drugs. 2019 Feb 8; 37(6): 1127–1134. PubMed PMID: 30734202.
- Liu DC, Song LL, Liang Q, et al. Long noncoding RNA LEF1-AS1 silencing suppresses the initiation and development of prostate cancer by acting as a molecular sponge of miR-330-5p via LEF1 repression. J Cell Physiol. 2019 Aug;234(8):12727–12744. PubMed PMID: 30613973.
- Jenness C, Giunta S, Muller MM, et al. HELLS and CDCA7 comprise a bipartite nucleosome remodeling complex defective in ICF syndrome. Proc Natl Acad Sci U S A. 2018 Jan 30;115(5):E876–E885. PubMed PMID: 29339483.
- Osthus RC, Karim B, Prescott JE, et al. The Myc target gene JPO1/CDCA7 is frequently overexpressed in human tumors and has limited transforming activity in vivo. Cancer Res. 2005 Jul 1;65(13):5620–5627. PubMed PMID: 15994934.
- Dhanasekaran R, Gabay-Ryan M, Baylot V, et al. Anti-miR-17 therapy delays tumorigenesis in MYC-driven hepatocellular carcinoma (HCC). Oncotarget. 2018 Jan 19;9(5):5517–5528. PubMed PMID: 29464015.
- Liu H, Liu Y, Liu W, et al. EZH2-mediated loss of miR-622 determines CXCR4 activation in hepatocellular carcinoma. Nat Commun. 2015 Sep 25;6:8494. PubMed PMID: 26404566.
- Seror O, N’Kontchou G, Ganne N, et al. A randomized trial comparing radiofrequency ablation and surgical resection for HCC conforming to the milan criteria. Ann Surg. 2011 Nov;254(5):837; author reply 837–838. PubMed PMID: 21997808.
- Li C, Chen J, Zhang K, et al. Progress and prospects of long noncoding RNAs (lncRNAs) in hepatocellular carcinoma. Cell Physiol Biochem. 2015;36(2):423–434. PubMed PMID: 25968300.
- Chen Y, Yu X, Xu Y, et al. Identification of dysregulated lncRNAs profiling and metastasis-associated lncRNAs in colorectal cancer by genome-wide analysis. Cancer Med. 2017 Oct;6(10):2321–2330. PubMed PMID: 28857495.
- Jimenez PR, Martin-Cortazar C, Kourani O, et al. CDCA7 is a critical mediator of lymphomagenesis that selectively regulates anchorage-independent growth. Haematologica. 2018 Oct;103(10):1669–1678. PubMed PMID: 29880607.
- Gill RM, Gabor TV, Couzens AL, et al. The MYC-associated protein CDCA7 is phosphorylated by AKT to regulate MYC-dependent apoptosis and transformation. Mol Cell Biol. 2013 Feb;33(3):498–513. PubMed PMID: 23166294.
- Schmitt AM, Chang HY. Long noncoding RNAs in cancer pathways. Cancer Cell. 2016 Apr 11;29(4):452–463. PubMed PMID: 27070700.
- Liu D, Zhang XX, Li MC, et al. C/EBPbeta enhances platinum resistance of ovarian cancer cells by reprogramming H3K79 methylation. Nat Commun. 2018 Apr 30;9(1):1739. PubMed PMID: 29712898.
- Jinesh GG, Flores ER, Brohl AS. Chromosome 19 miRNA cluster and CEBPB expression specifically mark and potentially drive triple negative breast cancers. PLoS One. 2018;13(10): e0206008. PubMed PMID: 30335837.
- Zhang JJ, Chen JT, Hua L, et al. miR-98 inhibits hepatocellular carcinoma cell proliferation via targeting EZH2 and suppressing Wnt/beta-catenin signaling pathway. Biomed Pharmacother. 2017 Jan;85:472–478. PubMed PMID: 27890434.
- Ye L, Li F, Song Y, et al. Overexpression of CDCA7 predicts poor prognosis and induces EZH2-mediated progression of triple-negative breast cancer. Int J Cancer. 2018 Nov 15;143(10):2602–2613. PubMed PMID: 30151890.