
ABSTRACT
Nasopharyngeal carcinoma (NPC) mainly appears in southeastern Asian countries, including China. Adriamycin (ADM), a type of antitumor drug, is widely applied in treatments against various cancers. Nevertheless, cancer cells will eventually develop drug resistance to ADM. The present study aims to explore the potential role of reticulocalbin-1 (RCN1) in NPC cells resistance to ADM. Microarray-based analysis was used to screen NPC-related genes, with RCN1 acquired for this current study. RCN1 expression in NPC tissues and cells was determined. The biological function of RCN1 on NPC cell apoptosis was evaluated via gain- and loss-of-function experiments in 5–8 F/ADM and 5–8 F cells by delivering si-RCN1 and RCN1-vector. The function of endoplasmic reticulum (ER) stress on cell apoptosis was measured with the involvement of the PERK-CHOP signaling pathway. Furthermore, tumor formation in nude mice was performed to evaluate the survival condition and RCN1 effects in vivo. RCN1 was highly expressed in NPC tissues and cell lines. The increased expression of ER-related proteins ATF4, CHOP, and the extents of IRE1 and PERK phosphorylation were observed. RCN1 knockdown was found to reduce resistance of NPC cells/tissues to ADM while activating ER stress through the activated PERK-CHOP signaling pathway, which further promoted NPC cell apoptosis. These in vitro findings were detected in vivo on tumor formation in nude mice. In conclusion, the present study provides evidence that RCN1 knockdown stimulates ADM sensitivity in NPC by promoting ER stress-induced cell apoptosis, highlighting a theoretical basis for NPC treatment.
Introduction
Nasopharyngeal carcinoma (NPC) is a generic term for a series of malignant epithelial tumors with multiple etiopathogenesis and various histopathological appearances [Citation1]. In 2018, statistics have reported about 129,079 new cases and 72,987 deaths of NPC, which constituted about 0.7% to 0.8% of 36 type of cancers [Citation2]. Previous evidence suggested that older people (over 60 years old) and those with lymphomas were more likely to suffer from NPC [Citation3]. The current first-line treatments for NPC are mainly chemotherapy, re-irradiation, targeted therapy, salvage surgery, and immunotherapy. However, these treatment approaches hold disadvantages [Citation4]. Furthermore, the active curative effect on NPC chemotherapy following drug combination of doxorubicin (also called Adriamycin [ADM]) and ifosfamide has been noted [Citation5]. However, the effectiveness of drug is limited due to the drug resistance in cancer. Besides, ADM resistance has been proven to be an important challenge in cancer chemotherapy [Citation6]. Therefore, despite the fact that current studies have propelled the treatment of NPC significantly, more in-depth studies are required to allow further advancement in the existing therapeutic methods [Citation7].
Reticulocalbin-1 (RCN1) is a form of Ca2+-binding protein that has a strict control of expression in endoplasmic reticulum (ER) [Citation8]. A previous study shed light on the fact that ER stress could result from unfolded protein accumulation in the lumen of ER, or significant damages of ER which has the potential to affect the normal ER function [Citation9]. The capability of cell reaction to ER stress-mediated dysregulation is of great importance for the cell survival, because chronic or unresolved ER stress may lead to apoptosis [Citation10]. Abnormal expression of RCN1 protein is shown to participate in multifarious diseases, including cancers, and the highly expressed RCN1 has been proved to be situated in multiple types of cancers, such as breast cancer, liver cancer, kidney cancer, as well as colorectal cancer [Citation11]. Intriguingly, RCN1 knockdown has demonstrated to promote apoptosis and necroptosis in prostate cancer cells [Citation12]. RCN1 has also indicated to be involved in the treatment of uterine cancer, where resistance to ADM was also observed [Citation13]. However, the role of RCN1 in NPC awaits investigation specifically from the perspective of ADM sensitivity. Hence, the function of RCN1 in NPC was discussed, and regulatory relationship of RCN1 and ER stress in NPC was investigated.
Materials and methods
Ethics statement
The protocols of this study were approved by the Ethics Committee of The Second Hospital of Shanxi Medical University and strictly followed the ethical principles for medical research involving human subjects of the Helsinki Declaration. Written informed consents were obtained from all participants prior to the study. The protocol of animal experiments was approved by the Institutional Animal Care and Use Committee of The Second Hospital of Shanxi Medical University.
Bioinformatics analysis
NPC-related gene expression datasets (GSE12452, GSE64634, GSE34573 and GSE53819) were from Gene Expression Omnibus database (https://www.ncbi.nlm.nih.gov/geo/). The limma package of R language (http://master.bioconductor.org/packages/release/bioc/html/limma.html) was utilized to perform standardized pre-processing and differentially expressed gene screening, and then the pheatmap package (https://cran.r-project.org/web/packages/pheatmap/index.html) was used to generate a heatmap depicting the differentially expressed genes.
Sample collection
From March 2017 to September 2018, 17 freshly frozen NPC and 11 normal nasopharyngeal epithelial tissue specimens were acquired from the cancer center of The Second Hospital of Shanxi Medical University. All of these samples obtained were verified by histological examination. All patients with NPC and chronic nasopharyngeal mucosal inflammation (as a normal control of NPC tissues) were initially diagnosed and confirmed by pathology without any other tumors. The patients with NPC did not undergo chemotherapy or radiotherapy before the collection of their specimens. Tumor staging was carried out by two experienced senior pathologists in strict accordance with the general guidelines of the 7th edition of American Joint Committee on Cancer for tumor staging.
Cell culture
Moreover, NPC cell lines 5–8 F, CNE1, CNE2, C666-1 and 6-10B, and immortalized non-cancerous human nasopharyngeal epithelial cell line NP69 were maintained in the Laboratory of The Second Hospital of Shanxi Medical University. The NPC cell lines were cultured in Roswell Park Memorial Institute (RPMI)-1640 medium (Thermo Fisher Scientific Inc., Waltham, MA, USA) supplemented with 10% fetal bovine serum (FBS; Gibco Company, Grand Island, NY, USA). Normal human nasopharyngeal epithelial cells (NP69) were cultured in Keratinocyte Serum Free Medium (Invitrogen, Carlsbad, CA, USA) supplemented with bovine pituitary extract (BD Biosciences, San Jose, CA, USA). ADM (BCP02082, Shanghai Hanxiang Biotechnology, Shanghai, China)-resistant cell line 5–8 F/ADM was derived from 5–8 F cells through stepwise increasing the ADM concentrations (0.1 μM, 0.5 μM, 1.0 μM, 1.5 μM, 2.0 μM) in medium. Consequently, the cells were cultured in the same medium containing 1.0 μM ADM. All cells were incubated at 37°C in a humidified atmosphere containing 5% CO2. Once the cell confluence reached 70%, cells were detached using trypsin containing ethylenediaminetetraacetic acid (Bioss Biotech, Beijing, China) and passaged every 3 days [Citation14].
Plasmid delivery
The siRNA against RCN1 was synthesized by Invitrogen (Carlsbad, CA, USA), and the different targeting sequences are displayed in . A similar GC sequence that did not match the known human coding sequence was applied in the plasmid delivery as the negative control (NC). RCN1-vector and its controls were purchased from Invitrogen (Carlsbad, CA, USA) and then applied for the transfection process using Lipofectamine RNAiMAX (Invitrogen, Carlsbad, CA, USA). The cells were transfected for 4 hours in serum-free medium containing 30 nM RCN1 siRNA/RCN1-vector or the corresponding control (pGCsi-control) and Lipofectamine RNAiMAX, and then cultured in medium containing 10% FBS for about 24 hours. The transfection efficiency was detected through immunoblotting [Citation13]. si-CHOP, sh-RCN1 and their controls were purchased from GenePharma Co., Ltd. (Shanghai, China). The sh-RCN1 was delivered into 5–8 F/ADM cells, and the stably transfected cells were chosen for tumor formation in nude mice.
Table 1. siRNA targeting sequences.
RNA isolation and quantitation
The total RNA was extracted from cells with the use of a TRIzol kit (Invitrogen, Carlsbad, CA, USA). The total RNA (5 μg) was reversely transcribed into cDNA in accordance to the manufacturer’s instructions of a cDNA kit (K1622; Fermentas Inc., Ontario, CA, USA). Quantitative real-time PCR was performed with PrimeScript RT-PCR kits (Takara Bio Inc., Otsu, Shiga, Japan) and iQ5 qPCR System (Bio-Rad, Richmond, CA, USA) in order to determine the expression of RCN1, Herp, ERdj4, activating transcription factor 4 (ATF4), ER-degradation-enhancing alpha-mannosidase-like 1 (EDEM1), GRP78 and C/EBP-homologous protein (CHOP). Glyceraldehyde-3-phosphate dehydrogenase (GAPDH) was considered to be an internal reference. The list of primer sequences (Guangzhou RiboBio Co., Ltd., Guangzhou, Guangdong, China) is illustrated in . The ratio of the target gene expression in the experimental group to that in the control group was expressed with the formula of 2−ΔΔCt.
Table 2. RT-qPCR primer sequences.
Western blot analysis
Cellular proteins were collected, and then the protein concentration was measured using a Bradford Protein Assay Kit (Beyotime Biotechnology, Nanjing, Jiangsu, China). The protein sample (30 μg) was separated with a 10% – 15% sodium dodecyl sulfate-polyacrylamide gel electrophoresis gel and transferred onto a 0.45 mm polyvinylidene fluoride membrane (Millipore Inc., Bedford, MA, USA). Furthermore, the membrane was blocked with 5% evaporated skim milk for approximately 2 hours, incubated with the primary antibody overnight at a temperature of 4°C, and incubated with the secondary antibody for 1.5 hours at room temperature. Afterward, the membrane was developed with enhanced chemiluminescence (Millipore Inc., Bedford, MA, USA) and visualized by the means of a gel image system (UVItec Co., Ltd., Cambridge, MA, USA). The intensity of each band on the western blot was detected using an ImageJ software. The primary antibodies used were as followed: rabbit antibodies against RCN1 (1: 2000, ab184441), c-poly (ADP-ribose) polymerase (c-PARP) (1: 1000, ab32064), c-caspase3 (1: 1000, ab2302), c-caspase9 (1: 1000, ab2324), ATF4 (1: 1000, ab184909), CHOP (1: 250, ab10444), phosphorylated IRE1 (1: 1000, ab48187), phosphorylated PKR-like endoplasmic reticulum kinase (PERK) (#3179) and PERK (#5683). All of the aforementioned antibodies were purchased from Abcam Inc. (Cambridge, UK) except phosphorylated PERK and PERK (both from Cell Signaling Technology, Danvers, MA, USA). A similar method was applicable to expression determination of RCN1 in tissues.
3-(4, 5-dimethylthiazol-2-yl)-2, 5-diphenyltetrazolium bromide (MTT) assay
The 5–8 F and 5–8 F/ADM cells were seeded in a 96-well plate at a seeding density of 1.0 × 10⁴ cells/well. After the cells were treated with different concentrations of ADM (Zhejiang Hisun Pharmaceutical Co., Ltd., Taizhou, Zhejiang, China) for 6, 12, 24, 36, or 48 hour, 20 μL MTT solution (Dojindo Laboratories, Kumamoto, Japan) was added to each well. Following another 4 hours of culturing, the optical density (OD) value of cells in each well was measured at 490 nm using a microplate reader (Bio-Rad Laboratories, Hercules, CA) [Citation14,Citation15].
Flow cytometry
Initially, cells were cultured in a 6-well plate (15 × 104 cells in 2 mL medium per well) for 12 h and treated with ADM for 24 hours or 48 hours. Then, the cells were stained with Annexin V-fluorescein isothiocyanate (FITC) and propidium iodide (PI) for 15 minutes according to the manufacturer’s instructions (Invitrogen, Carlsbad, CA, USA; Thermo Fisher Scientific Inc., Waltham, MA, USA), and finally analyzed using a flow cytometer (FACScan; Becton Dickinson, Franklin Lakes, NJ, USA) [Citation15]. The time point of ADM addition was regarded as 0 hour and served as a control in the flow cytometry.
Tumor formation assay in nude mice
The male BALB/c nude mice between the age of 3–4 weeks were from Beijing Laboratory Animal Research Center (Beijing, China) and housed in a specific-pathogen-free environment. The 5–8 F cells (1 × 10⁷) were stably transfected with si-RCN1 or its control, and resuspended in 200 μL serum-free medium. When the nude mice matured to 6–7 weeks, the cell suspension was injected subcutaneously into the right ankles of each nude mice. The tumor volume was measured using a caliper and calculated with the formula of V = a2 × b × 0.4 (a = the smallest diameter, b = the vertical diameter). On the 24th day post-inoculation, all mice were euthanized with an intraperitoneal injection of 200 mg/kg pentobarbital, and the tumor weight was measured. The expression of c-caspase3 and CHOP was determined with immunohistochemistry. Cell apoptosis in tumor tissues was detected using the DeadEnd Colorimetric Apoptosis TUNEL System (Promega, Madison, WI, USA).
The survival conditions of the nude mice were evaluated. As previously described, 1 × 10⁷ cells were injected subcutaneously into the right ankles of mice. The day after implantation, the nude mice were intraperitoneally injected with 2.5 mg/kg ADM (3 times per day, 7 days), or with 0.9% NaCl of equal volume for NC or untreated (blank control). At each time point, the survival rate of nude mice following different treatments was statistically recorded and observed.
Immunohistochemistry
The transplanted tumor tissues in each group were exposed to 10% formalin fixation and paraffin embedding. The paraffin sections were dewaxed by xylene and then dehydrated with gradient concentrations of alcohol (100% I, 100% II, 95%, 85% and 75%, each for 3 min). Subsequently, the antigen retrieval process was performed at a relatively high temperature of 97°C for 5 minutes after 3 washes with PBS (8 mM Na2HPO4, 136 mM NaCl, 2 mM KH2PO4, and 2.6 mM KCl). Next, the sections were immersed in 3% H2O2 deionized water for 20 minutes and sealed with goat serum for 15 minutes. Following this, the sections were incubated with primary rabbit antibodies against c-caspase3 (1: 500, ab2302), phosphorylated PERK (1: 100, ab192591) and CHOP (1: 100, ab179823) at 37°C for 2 hours, and then incubated with goat anti-rabbit antibody against immunoglobulin G (IgG; 1: 1000, ab6721) for 30 minutes. All antibodies mentioned above were obtained from Abcam Inc., (Cambridge, UK). Next, the sections were incubated with horseradish peroxidase-labeled streptavidin for 30 min followed by diaminobenzidine development and microscopic observation. The nuclei were counterstained with hematoxylin, cleared using xylene and sealed with neutral gum. Image Pro Plus 6.0 was used for analysis.
Statistical analysis
Data were analyzed with the use of SPSS 19.0 software (IBM Corp., Chicago, IL, USA) and GraphPad Prism 5.0 (GraphPad Software, Inc., La Jolla, CA, USA). Measurement data were expressed as mean ± standard deviation. Independent sample t-test was used for the comparison between two groups, while one-way analysis of variance (ANOVA) was used for comparison among multiple groups followed by Tukey’s post hoc test. Kaplan-Meier analysis was used for survival analysis. Two-way ANOVA was used for data comparisons at different concentrations or time points, while repeated measures ANOVA for comparison of volume data of nude mice at different time points, followed by Bonferroni post hoc test. Statistical significance was assumed when p < 0.05.
Results
RCN1 is highly expressed in NPC, and RCN1 knockdown induces the sensitivity of NPC cells to ADM
R language was used to perform the differential analysis of NPC-related gene expression datasets. Through this process, the highly expressed genes were screened out. The heatmaps of the top 20 highly expressed genes in GSE12452 and GSE64634 datasets were generated, as illustrated in ,). It was detected that RCN1 expression in NPC tissues was higher than that in the normal tissues in both datasets, which was in line with results of GSE34573 () and GSE53819 () datasets. The expression of RCN1 in NPC tissues and normal nasopharyngeal epithelial tissues was evaluated through RT-qPCR and Western blot analysis. The expression of RCN1 in NPC tissues was significantly elevated in comparison with normal nasopharyngeal epithelial tissues ()). Initially, the expression of RCN1 in NPC cell lines was detected by Western blot analysis. When compared with NP69 cell line, NPC cell lines exhibited higher expression of RCN1, with the highest RCN1 expression in 5–8 F cell line. In addition, at present, many studies have selected the 5–8 F cell line for drug resistance research [Citation16,Citation17]. Therefore, the 5–8 F cell line was selected for subsequent experiments ()). In order to prove the effect RCN1 has on the resistance of NPC cells, it was important to first determine the expression of RCN1 in 5–8 F/ADM cells (ADM-resistant cell line) and 5–8 F cells (cell line without ADM-resistance induction) using RT-qPCR and Western blot analysis. The expression of RCN1 was up-regulated in 5–8 F/ADM cells (). The RCN1 expression in 5–8 F/ADM cells then was knocked down. Moreover, the results of Western blot analysis revealed that the expression of RCN1 in 5–8 F/ADM cells treated with si-RCN1 was significantly decreased when compared with the 5–8 F/ADM cells treated with si-NC ()), indicating the success of RCN1 knockdown. si-RCN1#1, established to have the best knockdown efficiency, was therefore selected for future experiments.
Figure 1. RCN1 knockdown elevates NPC cell sensitivity to ADM. A, Heatmap of the top 20 highly expressed genes in the GSE12452 dataset. B, Heatmap of the top 20 highly expressed genes in the GSE64634 dataset. The abscissa in panel A and B indicates the sample number, the ordinate indicates the differentially expressed gene, the histogram at the upper right represents the color gradation, and each rectangle corresponds to one sample expression value. C, RCN1 expression in the GSE34573 dataset. D, RCN1 expression in the GSE53819 dataset. E, RCN1 mRNA expression in NPC tissues and normal nasopharyngeal epithelial tissues determined by RT-qPCR, * p < 0.05 vs. the normal nasopharyngeal epithelial tissues. F, RCN1 protein expression in NPC tissues (n = 5) and normal nasopharyngeal epithelial tissues (n = 5) determined by Western blot analysis, * p < 0.05 vs. the normal nasopharyngeal epithelial tissues. G, RCN1 protein expression in NPC cell lines (5–8 F, CNE1, CNE2, C666-1 and 6-10B) detected by Western blot analysis. * p < 0.05 vs. the NP69 cells. H, RCN1 mRNA expression in 5–8 F/ADM cells and 5–8 F cells determined by RT-qPCR, * p < 0.05 vs. the 5–8 F cells. I, RCN1 protein expression in 5–8 F/ADM cells and 5–8 F cells determined by Western blot analysis, * p < 0.05 vs. the 5–8 F cells. J, RCN1 protein expression in 5–8 F/ADM cells after RCN1 knockdown determined by Western blot analysis, * p < 0.05 vs. the si-NC group (5–8 F/ADM cells treated with si-NC). K, the viability of 5–8 F cells following the treatment of different concentrations of ADM (the top figure) and the survival rate of 5–8 F cells following the treatment of 1.0 μM ADM at different time points (the bottom figure) detected by MTT assay, * p < 0.05 vs. the si-NC group (5–8 F/ADM cells treated with si-NC). L, RCN1 protein expression in 5–8 F cells after RCN1 overexpression determined by Western blot analysis, * p < 0.05 vs. the vector-NC group (5–8 F cells treated with vector-NC). M, the viability of 5–8 F cells following the treatment of different concentrations of ADM (the top figure) and the survival rate of 5–8 F cells following the treatment of 1.0 μM ADM at different time points (the bottom figure) detected by MTT assay, * p < 0.05 vs. the vector-NC group (5–8 F cells treated with vector-NC). Data were expressed as mean ± standard deviation. Independent sample t-test was used for comparison between two groups, and one-way ANOVA was used for comparison between groups, followed by Tukey’s post hoc test. Repeated measures ANOVA were used for data comparisons at different concentrations or time points, followed by Bonferroni post hoc test. The experiment was repeated 3 times.
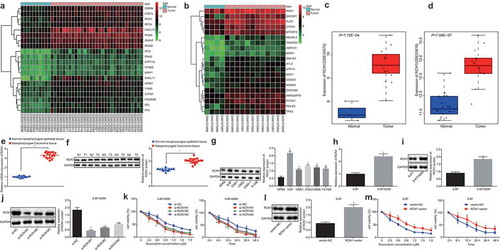
Then, MTT displayed that viability of cells gradually decreased with the increase of ADM concentration and treatment time. 5–8 F/ADM cells treated with si-RCN1 appeared to be less resistant to ADM when compared with 5–8 F/ADM cells that were treated with si-NC ()). In order to further examine the effect RCN1 has on sensitivity of NPC cells to ADM, RCN1 was overexpressed in 5–8 F cells. Western blot analysis exhibited that RCN1 expression was up-regulated in 5–8 F cells treated with overexpressed RCN1 ()). The viability of the cells following treatment with different concentrations of ADM at different time points was detected by MTT assay. The viability of the cells decreased as the concentration and treatment time of ADM increased, but resistance to ADM of 5–8 F cells treated with overexpressed RCN1 was enhanced (). These results implied that the knocking down of the RCN1 gene sensitized NPC cells to ADM.
RCN1 inhibits ADM-induced apoptosis in NPC cells
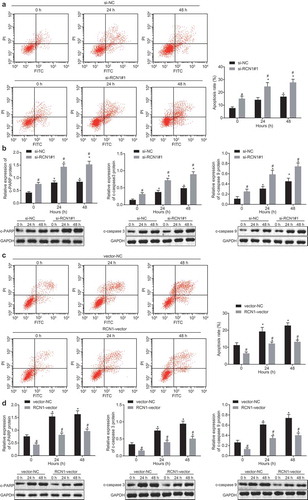
The apoptosis of NPC cells treated with ADM was assessed with the use of flow cytometry. Results illustrated that apoptosis rate was increased significantly when 5–8 F cells were treated with ADM (3 μM) at 24th hour and 48th hour, and the increase at 48th hour was much greater than that at 24th hour. Furthermore, the apoptosis rate of the 5–8 F/ADM cells treated with si-RCN1 was higher when compared with cells treated with si-NC ()). The expression of apoptosis-related proteins c-PARP and c-caspase3\9 was evaluated through Western blot analysis. The results displayed that the expression of c-PARP and c-caspase3\9 in the 5–8 F cells treated with ADM increased significantly at the 24th and 48th hour when compared with the 0th hour, but the increase at 24th hour was relatively higher than at 48th hour. In comparison with 5–8 F/ADM cells treated with si-NC, the expression of c-PARP and c-caspase 3/9 in the 5–8 F/ADM cells treated with si-RCN1 was significantly increased ()). Flow cytometry was applied in order to detect the apoptosis of 5–8 F cells treated with ADM (0.2 μM) at the 24th hour and 48th hour. The apoptosis rate of cells was significantly increased at 48th hour, but the apoptosis rate of the 5–8 F cells treated with overexpressed RCN1 was significantly decreased when compared with cells treated with vector-NC ()). The results of Western blot analysis illustrated that the expression of c-PARP and c-caspase 3/9 in the 5–8 F cells treated with ADM increased significantly at the 24th and 48th hour when compared with 0 hour, but the increase at 24th hour was much greater than that at 48th hour. When compared with cells treated with vector-NC, the expression of c-PARP and c-caspase 3/9 in the 5–8 F cells treated with overexpressed RCN1 was significantly decreased ()). With this all taken together, the knockdown of RCN1 enhanced the promotive effect of ADM on NPC cell apoptosis.
Figure 2. Knockdown of RCN1 induces apoptosis of NPC cells after ADM treatment. The 5–8 F/ADM cells were initially treated with si-RCN1#1 or si-NC. A, apoptosis of 5–8 F/ADM cells treated with ADM at different time points detected by flow cytometry. B, expression of apoptosis-related proteins in 5–8 F/ADM cells treated with ADM at different time points, * p < 0.05 vs. 0 h, # p < 0.05 vs. the si-NC group (5–8 F/ADM cells treated with si-NC). The 5–8 F/ADM cells were initially treated with RCN1-vector or vector-NC. C, apoptosis of 5–8 F cells treated with ADM at different time points detected by flow cytometry. D, expression of apoptosis-related proteins in 5–8 F cells treated with ADM at different time points, * p < 0.05 vs. 0 h, # p < 0.05 vs. the vector-NC group (5–8 F cells treated with vector-NC). Data were expressed as mean ± standard deviation, repeated measures ANOVA were used for data comparisons at different concentrations or time points, and Bonferroni was used for post hoc test. The experiment was repeated 3 times.
Knockdown of RCN1 potentiates ADM-induced apoptosis via the ER stress pathway
In order to verify the correlation between RCN1-induced apoptosis and ER stress pathway, RT-qPCR was conducted to determine the expression of unfolded protein response (UPR)-related genes in 5–8 F/ADM cells treated with ADM. The expression of CHOP and GRP78 was significantly higher in 5–8 F/ADM cells treated with si-RCN1 compared with cells treated with si-NC ()). The expression of UPR target genes (Herp, ERdj4, ATF4, and EDEM1) was later determined by RT-qPCR. The results exhibited that the mRNA expression of Herp, ERdj4, ATF4, and EDEM1 in cells treated with si-RCN1 was also significantly increased when compared with cells treated with si-NC ()). Simultaneously, we examined the expression of UPR-related genes in 5–8 F cells treated with ADM. The expression of GRP78 and CHOP in 5–8 F cells treated with RCN1-vector diminished significantly when compared with cells treated with vector-NC ()), and the mRNA expression of the Herp, ERdj4, ATF4, and EDEM1 was decreased ()). In conclusion, the knockdown of RCN1 promoted ADM-induced apoptosis through the ER stress pathway.
Figure 3. Knockdown of RCN1 promotes ADM-induced apoptosis via ER stress pathway. The 5–8 F/ADM cells were initially treated with si-RCN1#1 or si-NC. A, the mRNA expression of UPR-related genes (GRP78 and CHOP) in 5–8 F/ADM cells treated with ADM at 24th hour determined by RT-qPCR. B, the mRNA expression of UPR target genes (Herp, ERdj4, ATF4 and EDEM1) in 5–8 F/ADM cells at 24th hour determined by RT-qPCR. The 5–8 F/ADM cells were initially treated with RCN1-vector or vector-NC. C, the mRNA expression of UPR-related genes (GRP78 and CHOP) in 5–8 F cells treated with ADM at 24th hour determined by RT-qPCR. D, the mRNA expression of UPR target genes (Herp, ERdj4, ATF4 and EDEM1) in 5–8 F cells treated with ADM at 24th hour determined by RT-qPCR. * p < 0.05 vs. the si-NC group (5–8 F/ADM cells treated with si-NC) or the vector-NC group (5–8 F cells treated vector-NC). Data were expressed as mean ± standard deviation and independent sample t-test was used for comparison between the two groups. The experiment was repeated 3 times.
RCN1 knockdown enhances ER stress-induced apoptosis via the PERK-CHOP signaling pathway
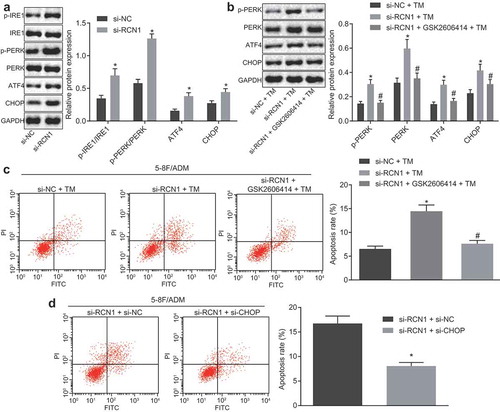
The PERK-CHOP signaling pathway was involved in cell apoptosis [Citation18], and the above results suggested that RCN1 knockdown promoted ER stress-induced apoptosis. Western blot analysis was carried out to evaluate the protein expression in the ER stress-related signaling pathway. Results showed that when compared with 5–8 F/ADM cells treated with si-NC, the expression of ATF4 and CHOP and the extent of PERK phosphorylation were significantly increased in the 5–8 F/ADM cells treated with si-RCN1, while the extent of IRE1 phosphorylation was only slightly higher ()). These results suggested that RCN1 may inhibit ER stress through the PERK-CHOP signaling pathway. For further verification purpose, 5–8 F/ADM cells were treated with 2 μM GSK2606414 (a PREK inhibitor) for 1 hour, and ER stress was induced in 5–8 F/ADM cells using 8 μM tunicamycin (TM, Sigma-Aldrich, St Louis, MO, USA) for 36 hours. Western blot analysis revealed that GSK2606414 successfully blocked CHOP induction caused by RCN1 knockdown after TM treatment ()). Flow cytometry showed that apoptosis rate of 5–8 F/ADM cells treated with si-RCN1 + TM was increased when compared with 5–8 F/ADM cells treated with si-NC + TM, while the apoptosis rate of the 5–8 F/ADM cells treated with si-RCN1 + GSK2606414 + TM was lower in comparison with 5–8 F/ADM cells treated with si-RCN1 + TM ()). Subsequently, 5–8 F/ADM cells were co-transfected with si-RCN1 and si-CHOP, and then induced by 8 μM TM for 48 hours. The results of flow cytometry showed that the apoptosis rate of the 5–8 F/ADM cells treated with si-RCN1 + si-CHOP was significantly decreased when compared with 5–8 F/ADM cells treated with si-RCN1 + si-NC ()). To conclude, the RCN1 knockdown promoted ER stress-induced apoptosis in NPC cells through the activation of the PERK-CHOP signaling pathway.
Figure 4. RCN1 knockdown induces ER stress-induced apoptosis via the PERK-CHOP signaling pathway. A, protein expression of PERK, ATF4, CHOP, IRE1 and the extents of PERK and IRE1 phosphorylation in 5–8 F/ADM cells treated with ADM at 24th hour measured by Western blot analysis, * p < 0.05 vs. the si-NC group (5–8 F/ADM cells treated with si-NC). The 5–8 F/ADM cells were treated with si-RCN1 in the presence of TM alone or with GSK2606414. B, protein expression of PERK, ATF4 and CHOP and the extent of PERK phosphorylation in 5–8 F/ADM cells determined by Western blot analysis, * p < 0.05 vs. the si-NC + TM group (5–8 F/ADM cells treated with si-NC + TM), # p < 0.05 vs. the si-RCN1 + TM group (5–8 F/ADM cells treated with si-RCN1 + TM). C, the apoptosis in 5–8 F/ADM cells detected by flow cytometry, p < 0.05 vs. the si-NC + TM group (5–8 F/ADM cells treated with si-NC + TM), # p < 0.05 vs. the si-RCN1 + TM group (5–8 F/ADM cells treated with si-RCN1 + TM). The 5–8 F/ADM cells were treated with si-RCN1 in the presence of si-NC or si-CHOP (si-CHOP targeting sequence was 5ʹ-GGACUUUACUAUUAUGUAACC-3ʹ). d, the apoptosis of 5–8 F/ADM cells detected by flow cytometry. * p < 0.05 vs. the si-RCN1 + si-NC group (5–8 F/ADM cells treated with si-RCN1 + si-NC). Data were expressed as mean ± standard deviation. Independent sample t-test was used for the comparison between the two groups, and one-way analysis of variance was used for the comparison between two groups, followed by Tukey’s post hoc test. The experiment was repeated 3 times.
Knockdown of RCN1 increases the survival rate of nude mice bearing established NPC by promoting ER stress and sensitivity to ADM
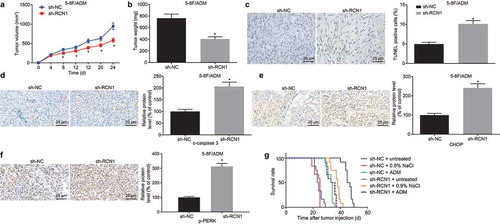
In order to verify the in vivo function of RCN1 in NPC, 5–8 F/ADM cells stably expressing sh-RCN1 were screened and injected into nude mice. The results displayed that the tumor growth in mice that intraperitoneally injected with cells transfected with sh-RCN1 was inhibited significantly in vivo in comparison with the mice intraperitoneally injected with cells transfected with sh-NC (). The apoptosis of tumor tissues was detected by the TUNEL assay. The results presented that the number of apoptotic cells in mice intraperitoneally injected with cell transfected with sh-RCN1 was significantly higher when compared with mice intraperitoneally injected with cells transfected with sh-NC ()). Immunohistochemistry demonstrated that in comparison to the mice intraperitoneally injected with cells transfected with sh-NC, increased expression of c-caspase-3 in tumor tissue suggested that intraperitoneally injected with cells transfected with sh-RCN1 induced cell apoptosis in vivo (). In addition, the immunohistochemistry revealed an increase of CHOP expression in mice intraperitoneally injected with cells transfected with sh-RCN1 in comparison to mice intraperitoneally injected with cells transfected with sh-NC. This confirmed that the knockdown of RCN1 has the potential to activate ER stress in vivo () and increase the extent of PERK phosphorylation ()). In order to investigate the effect of RCN1 on ADM resistance in vivo, 5–8 F/ADM cells were transplanted into nude mice for 1 day, and then treated with ADM or 0.9% NaCl, while the control mice remained untreated. The survival analysis of nude mice disclosed that in comparison to the untreated mice, the survival rate of the mice treated with 0.9% NaCl had no significant difference, while the survival rate in mice treated with ADM and sh-RCN1 was significantly higher when compared to control mice. When compared with the mice treated with ADM, the survival rate of mice treated with sh-RCN1 was significantly increased ()). Taken together, the knockdown of RCN1 could activate ER stress in vivo to promote survival in nude mice.
Figure 5. Knockdown of RCN1 activates ER stress in vivo to promote survival in nude mice. A, tumor volume in nude mice measured by tumor formation assay. B, tumor weight in the nude mice measured on the 24th day. C, the number of TUNEL-positive cells in the transplanted tumor detected by TUNEL assay (× 400). D, c-caspase3 expression in transplanted tumors detected by Immunohistochemistry (× 400). E, CHOP expression in transplanted tumors detected by Immunohistochemistry (× 400). F, extent of PERK phosphorylation detected by immunochemistry (× 400). G, survival analysis of mice in each group. N = 12. * p < 0.05 vs. the sh-NC group (mice treated with sh-NC). Data were expressed as mean ± standard deviation, and independent sample t-test was used for the comparison between the two groups. Kaplan-Meier analysis was used for survival analysis. Repeated measures ANOVA were used for data comparisons at different concentrations or time points, and Bonferroni was used for post hoc test.
Discussion
A prior study has proved that ADM has the ability to suppress the growth of NPC cells, and the importance of ADM in the treatment of NPC was noted [Citation15]. One interesting finding was that the effects of clinical treatment for many cancers were not desirable due to the drug resistance, including in the setting of NPC [Citation19]. This study explored the role of RCN1 in cell apoptosis of NPC and sensitivity of NPC cells to ADM. RCN1 knockdown stimulated NPC cell apoptosis and potentiated the sensitivity of NPC cells to ADM through the activation of ER stress.
Preliminary findings from this study exhibited that RCN1 was up-regulated in NPC, while RCN1 knockdown increased the ADM sensitivity in NPC cells. RCN, which localized in the ER, was proven to be involved in the regulation of normal behavior and function of cells, and the RCN up-regulation may also participate in tumorigenesis, tumor invasion, and drug resistance [Citation20]. A purposeful study confirmed that the up-regulated RCN1 was correlated with the poor prognosis and progression of non-small cell lung cancer [Citation11]. ADM appears to be an effective and highly sensitive drug against NPC cells [Citation21]. Likewise, RCN1 was showed to be involved in the treatment of uterine cancer resistant to ADM [Citation13]. Furthermore, it was noted that the apoptosis was elevated after the NPC cells were treated with ADM. Moreover, the RCN1 knockdown promoted the apoptosis as evidenced by increased expression of c-PARP and c-caspase 3\9. ADM has been established as an important drug for cancer therapy [Citation22]. Combination of cinobufacini and ADM resulted in the promotion of hepatocellular carcinoma cells apoptosis through the Fas- and mitochondria-mediated pathways [Citation23]. c-PARP has proved to hold a positive correlation with apoptosis [Citation24]. Caspase 3\9 can be induced by cordycepin in order to activate MA-10 cell apoptosis [Citation25]. In addition, low expression of RCN1 has been demonstrated to promote apoptosis and necroptosis in human prostate cancer cells [Citation12].
Another finding from our research illustrated that the down-regulation of RCN1-induced cell apoptosis was associated with the ER stress due to the increased expression of ER stress-related proteins GRP78, CHOP, Herp, ERdj4, ATF4, and EDEM1. Moreover, the RCN1 knockdown has promoted ER stress-induced cell apoptosis through the PERK-CHOP signaling pathway in NPC which was supported by the elevated expression of ER stress-related proteins ATF4, CHOP, and the extents of PERK and IRE1 phosphorylation. A previous study has demonstrated that ER-associated protein GRP78 was increased by bufalin which was proven to induce NPC cell apoptosis [Citation26]. To continue, another preceding study has also verified that the silencing of GRP78 decreases the drug resistance to cisplatin-based treatments as well as promotes ER stress-induced cell apoptosis [Citation27]. CHOP is a proapoptotic transcription factor, which was known to play a role in apoptotic process of cells [Citation28]. Herp represents a type of ER protein that was mainly induced by the environment changes, and its depletion could suppress cell apoptosis [Citation29]. ER stress protein ATF4 has revealed to be involved in radiation-induced cell apoptosis [Citation30]. The ER BiP co-factor ERdj4 was positively correlated with ER stress in relation to ER-associated degradation of multiple unfolded secretory proteins [Citation31]. A prior study has demonstrated that PERK and IRE1 were both involved in the ER stress-induced cell apoptosis [Citation32]. These previous findings seem to be in line with this current study, where RCN1 was demonstrated to inhibit ER stress-induced apoptosis through the PERK-CHOP signaling pathway [Citation18]. A previous study described that RCN1 inhibits ER stress-induced apoptosis through calcium homeostasis and the PERK-CHOP signaling pathway [Citation18]. However, this literature is about breast cancer and did not explain the role of RCN1 in ADM resistance. Our research on the function of RCN1 is precisely the same as that of PERK-CHOP signaling pathway. In addition, the tumor formation assay in nude mice further established that the RCN1 knockdown has enhanced nude mice survival through the activation of ER stress in vivo.
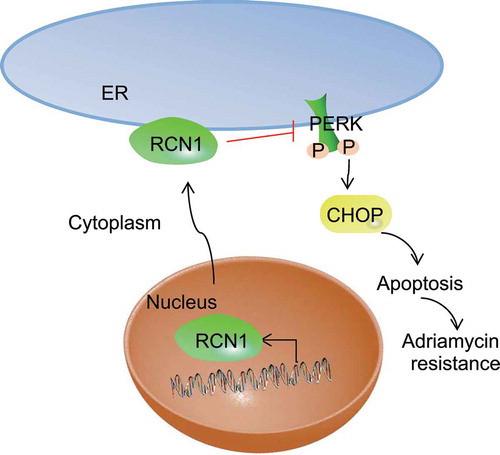
In summary, our findings have demonstrated the role of RCN1 in NPC. To elaborate, RCN1 was highly expressed in drug-resistant strains. The transcription and translation of RCN1 in the nucleus led to an increase in RCN1 expression. RCN1 entered the cytoplasm and developed. The overexpression of RCN1 gene inhibited ER stress, while the activation of PERK-CHOP signaling pathway induced ER stress and stimulated apoptosis. In addition, after the deletion of RCN1, some protein markers associated with ER stress were increased significantly. This demonstrated that the silencing of RCN1 promoted ER stress-induced cell apoptosis and ADM sensitivity of NPC cells (). As for the research on the experiments on of 6-10B cell line, we encountered some difficulties in fulfilling this requirement under the current limited scientific research funds, but it is guaranteed that further research will be performed under the conditions in the future. However, we are still in the very early stages of understanding the exact role that RCN1 plays in NPC cell sensitivity to ADM in the verification of its role as a potential therapeutic target and biomarker for NPC treatment. Therefore, future studies are expected to validate its applicable value in clinical practice.
Figure 6. RCN1 knockdown induces ER stress and activates the PERK-CHOP signaling pathway, leading to NPC cell apoptosis, which enhances the sensitivity of NPC cells to ADM. The transcription and translation of RCN1 in the nucleus lead to the increase of RCN1 expression. RCN1 enters the cytoplasm and further functions. The RCN1 overexpression reduces ER stress, while the activation of PERK-CHOP signaling pathway induces ER stress, thus leading to cell apoptosis. Thus, the sensitivity of NPC cells to ADM is affected.
Author contributions
Ze-Hao Huang, Jun Qiao and Yi-Yang Feng designed the study. Meng-Ting Qiu, Ting Cheng, Jia Wang and Chao-Feng Zheng collected the data, carried out data analyses and produced the initial draft of the manuscript. Zhi-Qin Lv and Cai-Hong Wang contributed to drafting the manuscript. All authors have read and approved the final submitted manuscript.
Acknowledgments
We acknowledge and appreciate our colleagues for their valuable efforts and comments on this paper.
Disclosure statement
No potential conflict of interest was reported by the authors.
References
- Petersson F. Nasopharyngeal carcinoma: a review. Semin Diagn Pathol. 2015;32:54–73.
- Bray F, Ferlay J, Soerjomataram I, et al. Global cancer statistics 2018: GLOBOCAN estimates of incidence and mortality worldwide for 36 cancers in 185 countries. CA Cancer J Clin. 2018;68:394–424.
- Anghel I, Anghel AG, Dumitru M, et al. Nasopharyngeal carcinoma – analysis of risk factors and immunological markers. Chirurgia (Bucur). 2012;107:640–645.
- Perri F, Della Vittoria Scarpati G, Caponigro F, et al. Management of recurrent nasopharyngeal carcinoma: current perspectives. Onco Targets Ther. 2019;12:1583–1591.
- Dede DS, Aksoy S, Cengiz M, et al. Ifosfamide and doxorubicin combination chemotherapy for recurrent nasopharyngeal carcinoma patients. Asian Pac J Cancer Prev. 2012;13:2225–2228.
- Khan FM, Saleh E, Alawadhi H, et al. Inhibition of exosome release by ketotifen enhances sensitivity of cancer cells to doxorubicin. Cancer Biol Ther. 2018;19:25–33.
- Lam WKJ, Chan JYK. Recent advances in the management of nasopharyngeal carcinoma. F1000Res. 2018;7. pii: F1000 Faculty Rev-1829.
- Ding Y, Caberoy NB, Guo F, et al. Reticulocalbin-1 facilitates microglial phagocytosis. PLoS One. 2015;10:e0126993.
- Mohamed E, Cao Y, Rodriguez PC. Endoplasmic reticulum stress regulates tumor growth and anti-tumor immunity: a promising opportunity for cancer immunotherapy. Cancer Immunol Immunother. 2017;66:1069–1078.
- Tabas I, Ron D. Integrating the mechanisms of apoptosis induced by endoplasmic reticulum stress. Nat Cell Biol. 2011;13:184–190.
- Chen X, Shao W, Huang H, et al. Overexpression of RCN1 correlates with poor prognosis and progression in non-small cell lung cancer. Hum Pathol. 2019;83:140–148.
- Liu X, Zhang N, Wang D, et al. Downregulation of reticulocalbin-1 differentially facilitates apoptosis and necroptosis in human prostate cancer cells. Cancer Sci. 2018;109:1147–1157.
- May EW, Lin ST, Lin CC, et al. Identification of up- and down-regulated proteins in doxorubicin-resistant uterine cancer cells: reticulocalbin-1 plays a key role in the development of doxorubicin-associated resistance. Pharmacol Res. 2014;90:1–17.
- Tan GX, Wang XN, Tang YY, et al. PP-22 promotes autophagy and apoptosis in the nasopharyngeal carcinoma cell line CNE-2 by inducing endoplasmic reticulum stress, downregulating STAT3 signaling, and modulating the MAPK pathway. J Cell Physiol. 2019;234:2618–2630.
- Liu Y, Feng J, Zhao M, et al. JNK pathway inhibition enhances chemotherapeutic sensitivity to Adriamycin in nasopharyngeal carcinoma cells. Oncol Lett. 2017;14:1790–1794.
- Li X, Zhao Z, Yi S, et al. Nuclear Klf4 accumulation is associated with cetuximab drug-resistance and predicts poor prognosis of nasopharyngeal carcinoma. J Transl Med. 2018;16:183.
- Roberts R, McEwen J. Attitudes to alcohol. Lancet. 1988;2:1027.
- Xu S, Xu Y, Chen L, et al. RCN1 suppresses ER stress-induced apoptosis via calcium homeostasis and PERK-CHOP signaling. Oncogenesis. 2017;6:e304.
- Zhou Z, Zhang L, Xie B, et al. FOXC2 promotes chemoresistance in nasopharyngeal carcinomas via induction of epithelial mesenchymal transition. Cancer Lett. 2015;363:137–145.
- Fukuda T, Oyamada H, Isshiki T, et al. Distribution and variable expression of secretory pathway protein reticulocalbin in normal human organs and non-neoplastic pathological conditions. J Histochem Cytochem. 2007;55:335–345.
- Yu H, Xue Y, Wang P, et al. Knockdown of long non-coding RNA XIST increases blood-tumor barrier permeability and inhibits glioma angiogenesis by targeting miR-137. Oncogenesis. 2017;6:e303.
- Rivankar S. An overview of doxorubicin formulations in cancer therapy. J Cancer Res Ther. 2014;10:853–858.
- Xia J, Inagaki Y, Gao J, et al. Combination of cinobufacini and doxorubicin increases apoptosis of hepatocellular carcinoma cells through the Fas- and mitochondria-mediated pathways. Am J Chin Med. 2017;45:1537–1556.
- Li K, Cao RJ, Zhu XJ, et al. Erythropoietin attenuates the apoptosis of adult neurons after brachial plexus root avulsion by downregulating JNK phosphorylation and c-Jun expression and inhibiting c-PARP cleavage. J Mol Neurosci. 2015;56:917–925.
- Jen CY, Lin CY, Huang BM, et al. Cordycepin induced MA-10 mouse leydig tumor cell apoptosis through caspase-9 pathway. Evid Based Complement Alternat Med. 2011;2011:984537.
- Su EY, Chu YL, Chueh FS, et al. Bufalin induces apoptotic cell death in human nasopharyngeal carcinoma cells through mitochondrial ROS and TRAIL pathways. Am J Chin Med. 2019;47:237–257.
- Huang YY, Pu LJ, Song LL, et al. Knockdown of GRP78 enhances cell death by cisplatin and radiotherapy in nasopharyngeal cells. Anticancer Drugs. 2016;27:726–733.
- Masciarelli S, Fra AM, Pengo N, et al. CHOP-independent apoptosis and pathway-selective induction of the UPR in developing plasma cells. Mol Immunol. 2010;47:1356–1365.
- Chen F, Wen X, Lin P, et al. HERP depletion inhibits zearalenone-induced apoptosis through autophagy activation in mouse ovarian granulosa cells. Toxicol Lett. 2019;301:1–10.
- Zong Y, Feng S, Cheng J, et al. Up-regulated ATF4 expression increases cell sensitivity to apoptosis in response to radiation. Cell Physiol Biochem. 2017;41:784–794.
- Lai CW, Otero JH, Hendershot LM, et al. ERdj4 protein is a soluble endoplasmic reticulum (ER) DnaJ family protein that interacts with ER-associated degradation machinery. J Biol Chem. 2012;287:7969–7978.
- Liu ZW, Zhu HT, Chen KL, et al. Protein kinase RNA-like endoplasmic reticulum kinase (PERK) signaling pathway plays a major role in reactive oxygen species (ROS)-mediated endoplasmic reticulum stress-induced apoptosis in diabetic cardiomyopathy. Cardiovasc Diabetol. 2013;12:158.