
ABSTRACT
This study aims to investigate the potential mechanisms and identify core biomarkers of Hepatocellular carcinoma (HCC). The profile GSE113850 was downloaded to analyze the differentially expressed genes. Gene ontology (GO), Kyoto Encyclopedia of Genes and Genomes (KEGG), and protein–protein interaction network analysis were used to reveal the main signal pathways of the differentially expressed genes (DEGs) and hub genes. The correlation between core gene expression and pathological stages, the disease-free survival analysis, the overall survival analysis were analyzed by Gene Expression Profiling Interactive Analysis. Furthermore, we reidentified the expression level of core genes of carcinoma tissues and para-carcinoma tissues from 14 HCC patients with real-time reverse transcription-polymerase chain reaction analysis (RT-PCR) and western blotting. After SK-Hep1 cell was treated with cyclin-dependent kinase 1 (CDK1) siRNA for 72 h, we detected the expression of the core genes and fluorescence-activated cell sorting analysis. A total of 378 DEGs were found. GO and KEGG analysis revealed that the DEGs were mainly enriched in the cell cycle. There were positive correlations among CDK1, polo-like kinase 1, shugoshin2 and anillin actin-binding protein. Moreover, the expression levels of four core genes were related to the HCC occurrence, pathological stages, and survivorship curve. The clinical HCC specimens verified the higher expression level of core genes by real-time RT-PCR. The transfection of siCDK1 in SK-Hep1 resulted in a disordered cell cycle. Furthermore, CDK1 knockdown suppressed the expression of PLK1, ANLN, and SGOL2. The CDK1-PLK1/SGOL2/ANLN pathway mediating abnormal cell division in the cell cycle might be a critical process in HCC.
1. Introduction
Hepatocellular carcinoma (HCC) is a representative of malignancies, which is characterized by poor prognosis and high mortality. Globally, it is the second leading cause of cancer-related mortality [Citation1], presumptively more than 750,000 new HCC cases are diagnosed worldwide every year, 55% of which cases are in China [Citation2] Despite advances in medical and surgical techniques, it is typically in an advanced stage at diagnosis and leaves very little hepatic functional reserve. As a highly heterogeneous tumor, HCC is a progressive accumulation of plenty of alterations of the genome and multifaceted molecular pathway [Citation3]. The identification of target genes and related pathway is of great importance, not only for early diagnosis, optimal treatment, and better prognosis but also for a comprehensive understanding of the cellular and molecular mechanisms involved in carcinogenesis.
Microarray analysis is increasingly valued as an essential tool in the field of medical oncology with the superiority of simultaneously detecting the alterations of thousands of genes, which can bring in great clinical applications, such as molecular classification of cancers, molecular diagnosis, and prognosis prediction [Citation4,Citation5]. In the present study, original data (GSE113850) were downloaded from Gene Expression Omnibus (GEO, http://www.ncbi.nlm.nih.gov/geo/) and we systematically selected the differentially expressed genes (DEGs). We established protein–protein interaction (PPI) network of DEGs and top 20 genes were analyzed with Gene Ontology (GO) and Kyoto Encyclopedia of Genes and Genomes (KEGG) pathway. Top four core genes, including CDK1, PLK1, SGOL2, and ANLN, were further analyzed in the perspective of disease-free survival and overall survival by the Gene Expression Profiling Interactive Analysis online database (http://gepia.cancer-pku.cn/) and the associations among the top genes were also identified there. To verify the data from bioinformatic analysis, we examined the expression of the four core genes in carcinoma tissues and para-carcinoma tissues of HCC patients. Furthermore, we investigated the mechanisms of CDK1 in HCC progression, and the data suggest that CDK1 promoted HCC invasion through PLK1/SGOL2/ANLN mediating cell cycle disorder, and the abnormal inaccurate chromosome segregation and cytokinesis were involved in the pathological process.
2. Materials and methods
2.1. Microarray data
Gene Expression Omnibus (GEO, http://www.ncbi.nlm.nih.gov/geo/) database in the National Center for Biotechnology Information (NCBI) was used to store gene expression datasets, original series, and platform records. The gene expression profile of GSE113850 was downloaded from the GEO database, which was based on Invitrogen NCode Human lncRNA Array on the Platform of GPL16847 by Polycarpou-Schwarz M et al. A total of 39 samples, including 7 normal liver samples and 32 HCC samples, were included in the analysis.
2.2. Identification of DEGs
GEO2R (https://www.ncbi.nlm.nih.gov/geo/geo2r/), an interactive online analysis tool for the GEO database, was applied to identify the DEGs between HCC samples and normal liver samples. The adjusted P-values (adj P-values) were applied to correct for the occurrence of false-positive results using the Benjamini and Hochberg false discovery rate method by default. The logFC <−2 (downregulated genes) or logFC >2 (upregulated genes) and the adj P-value <0.05 were used as the inclusion criteria [Citation6]. Based on that, totally 378 DEGs were found, including 142 upregulated genes and 236 downregulated genes, and we selected the top 20 genes with a high degree of connectivity as hub genes.
To show the results more directly and visually, we used visual hierarchical cluster analysis to depict the heat map and volcano plot of two groups by ImageGP (http://www.ehbio.com/ImageGP/index.php/Home/Index/index.html).
2.3. Gene Ontology and KEGG pathway analysis of DEGs and hub genes
Candidate DEGs` functions and pathway enrichments can be analyzed using multiple online databases. Among them, GO (Gene ontology) is a major bioinformatics initiative to unify the representation of gene and gene product and to interpret the characteristic biological attributes including cellular components, molecular function, and biological pathways [Citation7]. The Kyoto Encyclopedia of Genes and Genomes (KEGG) is a database resource for understanding high-level functions and utilities of the biological system, such as the cell, the organism, and the ecosystem from molecular-level information, especially large-scale molecular datasets generated by genome sequencing and other high-throughput experimental technologies [Citation8]. In addition, the 20 hub genes were analyzed by GO and KEGG. The DEGs and 20 hub genes were mapped to the relevant biological annotation using the DAVID online database (https://david.ncifcrf.gov/). P < 0.05 was considered to indicate a statistically significant difference.
2.4. PPI network and module analysis
PPT information of DEGs was acquired from the Search Tool for the Retrieval of Interacting Genes (STRING, http://www.stringdb.org/) database. So far, STRING (version 10.0) contains 9.6 million proteins from 2,031 organisms, and 184 million interactions has been portrayed and integrated [Citation9]. The cutoff criterion was set as a maximum number of interactors = 0 and a confidence score ≥ 0.4. The whole giant network was then uploaded into Cytoscape software (version 3.4) to evaluate primary modules of the PPI sub-network using the plug‑in Molecular Complex Detection (MCODE) according to node score cutoff = 0.2, degree cutoff = 2, max. Depth = 100, and k-core = 2. Also, the genes of three modules were analyzed by GO and KEGG to further investigate the biological function and potential pathway information, respectively.
2.5. Comparison of the hub gene expression level
Gene Expression Profiling Interactive Analysis (GEPIA, http://gepia.cancer-pku.cn/) is a newly created web-based tool for cancer and normal gene expression profiling and interactive analyses. It integrates the tremendous amount of RNA sequencing data produced by large consortium projects such as TCGA and GTEx, in order to provide key interactive and customizable functions including differential expression analysis, profiling plotting, correlation analysis, patient survival analysis, similar gene detection, and dimensionality reduction analysis [Citation10]. In our study, we utilized the box plots to depict the contract of hub gene expression between normal human hepatocytes and hepatoma cells. Meanwhile, the violin plots based on pathological stages were presented to further insight into correlation between gene expressions and disease phases. GEPIA also provides pairwise gene correlation analysis for given genes, and we input several suspicious genes for detailed exploration.
2.6. Survival analysis of core genes
The overall survival and disease-free survival analysis of core genes were carried out on GEPIA. The hazard ratio (HR) with 95% confidence intervals and logrank P value was measured and P < 0.05 was considered statistically significant.
2.7. Reidentification of core gene expression in HCC
2.7.1. Clinical specimens and cell line
The study protocol was approved by the Ethics Committee of Zhongnan Hospital, Wuhan University (No.2019016). We collected 14 patients who underwent curative surgery for HCC in Zhongnan Hospital of Wuhan University, for primary HCC and corresponding adjacent non-tumor (NT) liver specimens. The cell line SK-Hep1 was purchased from the Cell Bank of Chinese Academy of Sciences (No. TCHu109 and GNHu 6, Chinese academy of sciences, Shanghai, China) and cultured in Dulbecco’s modified Eagle’s medium (DMEM; Invitrogen, Carlsbad, CA, USA) supplemented with 10% fetal bovine serum (Gibco, Grand Island, NY, USA). All cells were maintained in a humidified incubator at 37°C with 5% CO2.
2.7.2. RNA interference
The control nonspecific small interfering RNA and CDK1 siRNAs were synthesized by Guangzhou RiboBio Co., Ltd. Transfection of siRNA was carried out according to the procedure recommended by the manufacturer. The cell line SK-Hep1 was chosen for the RNA interference. The control group was disposed with nonspecific siRNA, and the CDK1 knockdown groups were disposed with CDK1 siRNA. The nucleotide sequences of CDK1 siRNAs were siCDK1 primer: GTACTGCAATTCGGGAAAT. Seventy-two hours after transfection with 50 nM siRNA, the cells were then collected and processed for quantitative real-time PCR and flow cytometry analysis.
2.7.3. RNA isolation, cDNA synthesis, and quantitative real-time PCR
Total RNA was extracted from human liver tissues and cells using TRIzol reagent (No.15596026, Thermo Fisher Scientific, Waltham, MA, USA). The reverse transcription of mRNA was performed using RevertAid RT Reverse Transcription Kit (No.K1691, Thermo Fisher Scientific, Waltham, MA, USA). Quantitative real-time PCR was performed using a standard protocol from the Hieff® qPCR SYBR Green Master Mix (No Rox) kits (No.11201ES08, shanghai, China). β-actin was used as an internal control. Each sample was analyzed in triplicate. Primers specific to target genes were synthesized by Tsing Ke (Beijing Qing Ke Xin Ye Biotechnology Co., Ltd, Wuhan, China). Data were analyzed according to the 2−ΔCq (Comparative Cq) method. The primers used in this study are as follows: CDK1, forward primer: TTACAAAGATCAAGGGCTGTCCGCAACA, reverse primer: AAAGCCAAGATAAGCAACTCCTTCAGT; PLK1 forward primer: ACGGCAGCGTGCAGATCAACTT; reverse primer: TCCAGGAGACTCAGGCGGTATGT; SGOL2, forward primer: GAAAGCCATTCCCACTCAGACC; reverse primer: TTTGATTCCCAAGATGACCCAC; ANLN, forward primer: CACCGTTTCCATCGTCTC; reverse primer: CTGCTGGTTACTTGCTTCTG; β-actin, forward primer:5ʹ-TGGCACCCAGCACAATGAA-3ʹ, reverse primer: 5ʹ-CTAAGTCATAGTCCGCCTAGAAGCA-3ʹ
2.7.4. Western blotting analysis
Total protein was isolated from SK-Hep-1 cells using RIPA lysis buffer (Wuhan Servicebio Biotechnology, Wuhan, China). Protein concentrations were determined using bicinchoninic acid assay (Wuhan Servicebio Biotechnology). Equal amounts of protein for each sample were run on polyacrylamide gels and then transferred to PVDF membranes. Subsequently, PVDF membranes were incubated at 4°C overnight with primary antibodies at the indicated concentrations (). Protein bands were detected using a chemiluminescence reagent kit (Wuhan Servicebio Biotechnology). GAPDH content was used to standardize sample loading.
Table 1. Diluted concentrations of antibodies used for western blotting
2.7.5. Immunohistochemistry (IHC)
For IHC, the carcinoma tissues and para-carcinoma tissues of HCC patients were deparaffinized in xylene and rehydrated in ethanol, and submerged in distilled water. After treated in Hydrogen Peroxide, the slides were processed for antigen retrieval in Tris-EDTA buffer, and then cooled down slowly. After blocking with 10% goat serum, the slides were incubated in primary antibodies overnight and then incubated in HRP-conjugated secondary antibodies. Subsequent detection was performed using the standard substrate detection of HRP. Then, the sections were stained with hematoxylin and dehydration in graded alcohols and xylene. The CDK1 antibody was purchased from (No.10026-1-AP, Proteintech, Wuhan, China). The IHC images were observed under 400× magnification.
2.7.6. Flow cytometry analysis
Cells were transfected with CDK1 siRNAs or control sequence for 72 h before analysis. Briefly, cells were washed in PBS and fixed in 70% precooled ethanol at 4°C at least 4 h. Fixed cells were then washed twice in PBS and water-bath heated in 100ul RNase (50 µg/mL) at 37°C for 30 min, then stained away from light in 50 µg/mL propidium iodide for 30 min. They were analyzed by flow cytometry (FACS Calibur flow cytometer; BD Biosciences, Franklin Lakes, NJ, USA).
2.8. Statistical analysis
All values are presented as the mean ± SD. All statistical analyses were performed by SPSS 19.0 software. A difference of P < 0.05 was considered statistically significant.
3. Results
3.1. Identification of DEGs and hub genes
A total of 32 HCC samples and 7 normal samples were analyzed. By using GEO2R online tool with the inclusion criteria of logFC <−2 or logFC >2 and the adj P-value <0.05, totally 378 DEGs were found, including 142 up-regulated genes and 236 down-regulated genes. The results were shown in the heat map and volcano plot (,)). Meanwhile, we selected the top 20 genes with a high degree of connectivity as hub genes, including CDK1, PLK1, HIST3H3, CYP2B6, SYK, ACSL1, ANLN, EDN1, RAD21, CXCL12, IGF1, DMGDH, HDAC10, SHMT1, SGOL2, CYP2 C19, CYP3A5, HTR2 C, SYNE1, and MTR ().
Figure 1. Identification of DEGs of HCC in GSE113850. (a) Heat map of the expression levels of the top 60 DEGs in GSE113850 employed the GEO2R online analysis tool based on P-value < 0.05 and logFC ≤ −2 or logFC ≥ 2 criteria. Ordinate Abscissa represented sample types and abscissa referred to genes. Each block referred to the expression of a gene in a sample, and upper histogram showed color gradation. Red represented high expression and green represented low expression. (b) Volcano plot about total 378 DEGs from GSE113850. The red dots stand for 142 up-regulated DEGs, while the green dots represent 236 down-regulated DEGs. The blue dots denote the no-differentially expressed genes
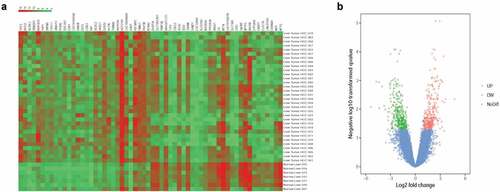
Table 2. Top 20 hub genes with a higher degree of connectivity
3.2. GO Function and KEGG pathway enrichment analysis
To investigate the functions of DEGs and further assess the signal pathway, we performed GO and KEGG pathway enrichment analysis using DAVID. Inputting all the DEGs into DAVID, we obtained up-regulated DEGs and down-regulated DEGs by GO analysis. To be more specific, these DEGs were mainly enriched in biological processes (BP), involving the regulation of ubiquitin-protein ligase activity involved in mitotic cell cycle; the positive regulation of ubiquitin-protein ligase activity involved in regulation of mitotic cell cycle transition; the anaphase-promoting complex-dependent catabolic process and the single organismal cell-cell adhesion for upregulation. GO cell component (CC) analysis uncovered that the down-regulated DEGs were principally enriched in the plasma membrane, chromosome centromeric region, and extracellular region. To be more specific, we imported 20 hub genes into DAVID software. The KEGG result showed that the pathways mainly involved were metabolic pathways and cell cycle ().
Table 3. KEGG pathway analysis of 20 hub gene
3.3. Module screening from the PPI network
Based on the information of the STRING protein query from public databases, we constructed the PPI network of all DEGs ()). Furthermore, we applied the MCODE plug-in to focus on the most significant modules in this PPI network. The selected top three modules are shown in .
Figure 2. PPI network and module analysis of HCC. (a) PPI network of all DEGs via the information of the STRING protein query with a maximum number of interactors ≤ 5, confidence score ≥ 0.4 which consists of 88 nodes and 112 edges based on STRING database. The top 10 DEGs with high degree of connectivity were selected as the hub genes of HCC. (b-d) PPI networks of Module 1–3. The top three gene modules were significantly enriched in metabolic pathways, mineral absorption, and cell cycle, respectively
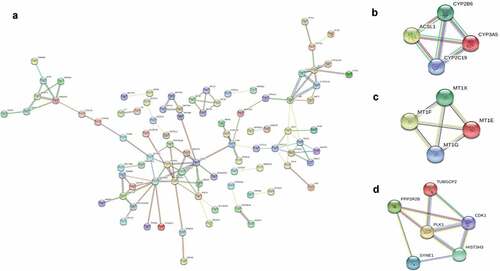
What is more, we conducted GO and KEGG analysis of the three top modules, respectively, to reveal the predominant biological functions and pathways. KEGG analysis disclosed that the top three modules were mainly associated with metabolic pathways and mineral absorption ( and ).
Table 4. Gene ontology analysis of hub genes associated with hepatocellular carcinoma (Cluster1, 2, and 3)
Table 5. KEGG pathway analysis of hub genes associated with hepatocellular carcinoma (Cluster1, 2, 3)
3.4. The Kaplan–Meier plotter and expression level of core genes
As a highly heterogeneous tumor, the pathogenesis of HCC is intricate, which is implicated with the progressive accumulation of plenty of alterations of genome and multifaceted molecular pathways. Based on the comprehensive but complicated results available of GO and KEGG analysis, we can hardly focalize on a pivotal pathway which is partly responsible for cancerization. GEPIA provides pairwise gene correlation analysis for given genes, and we input the hub genes for detailed exploration. Intriguingly, we found distinct positive correlations between CDK1, PLK1, SGOL2, and ANLN ().
Figure 3. Correlation analysis of any two core genes in GEPIA. (a) CDK1 and PLK1 correlation analysis. CDK1 and PLK1 are obviously positively correlated (P-value = 0, R = 0.85). (b) CDK1 and SGOL2 correlation analysis. CDK1 and SGOL2 are obviously positively correlated (P-value = 0, R = 0.82). (c) CDK1 and ANLN correlation analysis. CDK1 and ANLN are obviously positively correlated (P-value = 0, R = 0.88). (d) PLK2 and SGOL2 correlation analysis. PLK2 and SGOL2 are obviously positively correlated (P-value = 0, R = 0.88). (e) PLK1 and ANLN correlation analysis. PLK1 and ANLN are obviously positively correlated (P-value = 0, R = 0.88)
Cyclin-dependent kinase 1, also known as CDK1 or cell division cycle protein 2 homolog, a highly conserved protein that functions as a serine/threonine kinase, is a key player in cell cycle regulation [Citation11]. Serine/threonine-protein kinase PLK1, also known as polo-like kinase 1 (PLK1) or serine/threonine-protein kinase 13 (STPK13), functions as an early trigger for G2/M transition. Often observed to overexpress in tumor cells, PLK1 is considered as a proto-oncogene [Citation12]. Depletion of PLK1 by RNA interference results in metaphase arrest and formation of abnormal chromatin structures. Knockdown of PLK1 also reduces cell survival and elevates drug sensitivity of tumor, but not normal cells [Citation13,Citation14]. In more detail, PLK1 contributes to the tumorigenicity of BEL-7402 hepatoma cells via regulation of Survivin expression [Citation15]. Shugoshin-like 2 (SGOL2) is vital for faithful chromosome segregation during mitosis and meiosis, which regulates sister chromatid cohesion by protecting the integrity of a complex named cohesion [Citation16]. ANLN (Anillin) is an evolutionarily conserved actin-binding protein that serves as a key mediator of cytokinesis [Citation17]. It binds to all three types of actin filaments, as well as other important cytoskeletal components, serving as a scaffolding protein to coordinate cytokinesis in space and time [Citation18,Citation19]. The high correlations hinted that they might participate jointly in a pro-tumorigenic or tumor-responsive pathway. According to the findings, we chose the four genes as core genes and tried to undercover the key pathways.
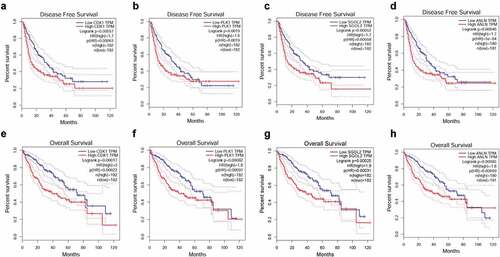
The prognostic information of the core genes was downloaded from http://gepia.cancer-pku.cn/. As shown in , the results of disease-free survival verified the worse effect of CDK1 (HR (high) = 1.7, P (HR) = 0.00063, logrank P = 0.00057), PLK1 (HR (high) = 1.6, P (HR) = 0.0019, logrank P = 0.0019), ANLN (HR (high) = 1.7, P (HR) = 5e-04, logrank P = 0.00046) and SGOL2 (HR (high) = 1.7, P (HR) = 0.00058, logrank P = 0.00052). What is more, the high expression of CDK1 was associated with worse overall survival (OS) for HCC patients (HR (high) = 2, P (HR) = 0.00022, logrank P = 0.00017), as well as PLK1 (HR (high) = 1.8, P (HR) = 0.00097, logrank P = 0.00082), SGOL2(HR (high) = 1.9, P (HR) = 0.00031, logrank P = 0.00025) and ANLN (HR (high) = 1.8, P (HR) = 0.00099, logrank P = 0.00085). ()
Figure 4. The Kaplan-Meier plotter of four core genes in HCC patients. The disease-free curves of CDK1 (a), PLK1 (b), SGOL2 (c), and ANLN (d). It was demonstrated that expression of CDK1 (HR (high) = 1.7, Logrank P =0.00057), PLK1 (HR (high) = 1.6, Logrank P = 0.0019), SGOL2 (HR (high) = 1.7, Logrank P = 0.00052) and ANLN (HR (high) = 1.7, Logrank P = 0.00046) were associated with worse disease-free survival (DFS) for HCC patients. The overall survival curves of CDK1 (e), PLK1 (f), SGOL2 (g), and ANLN (h) in HCC patients. It was demonstrated that expression of CDK1 (HR (high) = 2, Logrank P = 0.00017), PLK1 (HR (high) = 1.8, Logrank P = 0.00082), SGOL2 (HR (high) = 1.9, Logrank P = 0.00025) and ANLN (HR (high) = 1.8, Logrank P = 0.00085) were associated with worse overall survival (OS) for HCC patients. *P < 0.05 was regarded statistically different
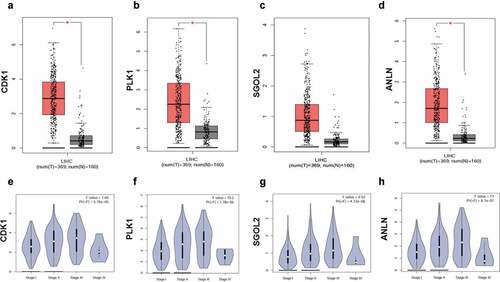
In order to compare the expression level of hub genes in normal hepatocytes with that in hepatoma cells, we drew the boxplots which displayed that CDK1, PLK1, SGOL2, and ANLN appeared a higher expression level, which is consistent with the survival analysis ()). The violin plots showed the relevance between gene expressions and pathological stages, indicating the influence of core genes on progression of disease ().
Figure 5. The boxplots and the violin plots of four core genes in HCC patients. The boxplots of CDK1 (a), PLK1 (b), SGOL2 (c), and ANLN (d). The expression levels of CDK1, PLK1, SGOL2, and ANLN were higher in hepatocellular carcinoma tissues than in liver tissues. The violin plots of CDK1 (e), PLK1 (f), SGOL2 (g), and ANLN (h) in HCC patients. The expression levels of CDK1, PLK1, SGOL2, and ANLN were significantly associated with tumor stage for hepatocellular carcinoma. *P < 0.05 was regarded statistically different
3.5. Reidentification of target gene expression in HCC
To reidentify the expression profiles of core genes shown in the integrated bioinformatic analysis, we examined the mRNA levels in 14 paired HCC samples. The results showed significantly higher CDK1, PLK1, ANLN, and SGOL2 expression in tumor tissues than those in adjacent nontumor tissues ().
Figure 6. The relative mRNA level of four hub genes in HCC tissues and adjacent non-tumor tissues. (a) Up-regulation of CDK1 (log2(HCC/NT)>0) was detected in 100% (14/14) of primary HCCs, and (b) up-regulation of PLK1 was detected in 85.71% (12/14), (c) up-regulation of SGOL2 was detected in 85.71% (12/14), (d) up-regulation of ANLN was detected in 100% (14/14). The results showed that the expression level of CDK1, PLK1, SGOL2, and ANLN was distinctly higher in HCC tissues
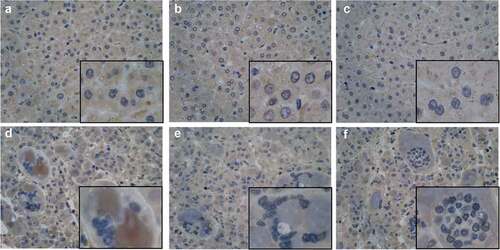
Immunohistochemistry (IHC) in three pairs of HCC tissues further confirmed the upregulation of CDK1 protein in HCC cells and indicated that multinuclear giant cells causing by failed cell division were involved in HCC pathogenesis ().
Figure 7. Representative IHC images showing the protein level of CDK1 in HCC tissues and paired adjacent non-tumor tissues. The results shown that CDK1 protein was significant high expression in the HCC issues (d–e) compared with adjacent non-tumor tissues (a–c) and obvious delayed process of the mitosis was found in those HCC issues
3.6. CDK1 mediates disordered cell cycle
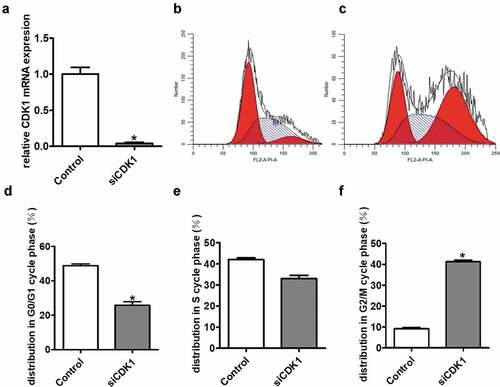
To investigate the potential biological function of CDK1, we knocked down CDK1 in SK-Hep1 cells. The siRNAs were transiently transfected into the cells and the knockdown efficiency was measured by real-time RT-PCR ()). Previous studies suggest that CDK1 is implicated in cell cycle regulation, which is confirmed by our results. Fluorescence-activated cell sorting (FACS) analysis showed that the proportion of cells in G2/M phase increased while G0/G1 decreased accordingly following CDK1 knockdown using siRNAs ().
Figure 8. FACS analysis showing cell cycle arrest in G2/M phase after silencing of CDK1 in transiently transfected cell lines. (a) The siRNA knockdown efficiency of CDK1 was measured by quantitative real-time RT-PCR. (b) showed the FACS analysis of the control group; (c) showed the FACS analysis of the siCDK1 group. (d-f) showed that the proportion of cells in G2/M phase increased while G0/G1 decreased accordingly following CDK1 knockdown. *P < 0.05 was regarded statistically different
3.7. CDK1 knockdown suppresses the expression of downstream genes
PLK1, ANLN, and SGOL2 are implicated to involve in different aspects of cell division, and our results indicated that the effect of CDK1 on cell cycle was mediated by regulating downstream gene expressions including PLK1, ANLN, and SGOL2. The results from quantitative real-time RT-PCR showed the significantly decreased expression levels of PLK1, ANLN, and SGOL2 following CDK1 knockdown () and CDK1 knockdown suppressed the expression protein of PLK1, ANLN, and SGOL2 () in SK-Hep1 cell line.
Figure 9. CDK1 knockdown suppressed the expression protein of hub genes in transiently transfected cell lines. *P < 0.05 was regarded statistically different
Figure 10. CDK1 knockdown suppressed the relative mRNA level of hub genes in transiently transfected cell lines. *P < 0.05 was regarded statistically different
4. Discussion
In this study, a total of 378 DEGs, including 236 down-regulated and 142 up-regulated genes, were identified in HCC tissues compared to in normal livers. To have a deep exploration of these DEGs, we carried out GO function and KEGG pathway analysis of these DEGs. To confirm the clinical significance and practicability, we reexamined the expression level of core genes in clinical HCC specimens. Cell experiments worked out the specific pathway in which the core genes get involved in HCC occurrence and development.
4.1. CDK1/PLK1/SGOL2/ANLN genetic interaction mediates inaccurate chromosome segregation through cohesin and abnormal cytokinesis in mitosis
In mitosis, the genome is programmed to be duplicated and separated in the way that each of the daughter cells inherits a complete copy of the genome without alterations. Chromosome segregation and cytokinesis are essential for complete cell division and are processes shared by most mitotic cells [Citation20]. The processes are controlled by numerous mechanisms ensuring correct cell division [Citation21]. Any errors in the signal pathway are likely to initiate aberrant cell proliferation and facilitate the development of cancer [Citation22]. A key feature for controlling genomic integrity is sister chromatid cohesion, which is mediated by the cohesin complex.
In this study, CDK1, PLK1, SGOL2, and ANLN, four of the selected hub genes, were confirmed to be associated with HCC pathological stages and disease-free survival. More importantly, the following correlation analysis exhibited high positive correlation of expression level between each pair, implying that potential genetic interactions between CDK1/PLK1/SGOL2/ANLN mediates disorganized cell cycle, exerting an influence on HCC progression and prognosis. The results of CDK1 knockdown experiments implied that PLK1, SGOL2, and ANLN were downstream genes regulated by CDK1.
Binding of CDK1 to cyclin B is essential for activation of the kinase, and the activation of the CDK1-cyclin B brings the onset of mitosis and is tightly regulated [Citation23]. At the G2/M transition, CyclinB1 expression gradually increases and binds to CDK1 form a heterodimer. CDK1-cyclin B is activated through dephosphorylation on threonine 14 (Thr14) and tyrosine 15 (Tyr15) by Cdc25 and triggers the G2/M transition and initiates the biological processes and changes in cellular structure and organization necessary for mitotic progression [Citation24]. Mouse knockout experiments have shown that CDK1 is prerequisite for mammalian cell proliferation; it is the only CDK that can initiate the onset of mitosis (that is, the M phase) [Citation25], subsequently, CDK1-cyclin B phosphorylates multiple substrates, leading to nuclear envelope breakdown, chromosome condensation, and mitotic spindle assembly [Citation26]. Analysis of human HCC tissue samples confirmed that CDK1 activity was detected in primary malignancies but not in healthy paraneoplastic tissues, what is more, small hairpin RNA (shRNA) knockdown of CDK1 significantly reduced the tumor-specific killing effects of apoptin [Citation27].
PLK1 is a master mitotic regulator controlling a wide variety of processes during G2/M cell cycle progression, such as centrosome maturation, entry into mitosis, chromosome segregation, and cytokinesis. In prophase, PLK1 shuttles to the kinetochores, helping condensed chromosomes to align in the metaphase plate. At the onset of anaphase, PLK1 localizes at the spindle mid-zone and later to the cytokinetic bridge in order to coordinate cytokinesis and cell abscission [Citation12,Citation28]. As mentioned above, CDK1-cyclin B phosphorylates multiple substrates, including the conserved protein, Bora, which functions as a PLK1 activator. Phosphorylation of specific sites on Bora by CDK1 is essential for PLK1 function in mitotic entry in C. elegans embryos and during DNA damage checkpoint recovery in mammalian cells [Citation29,Citation30]. Cyclin-B accumulation in G2 triggers activation of Cdk1 and drives cells into mitosis; once all the chromosomes have been correctly aligned on the mitotic spindle, the activity of Cdk1 falls and the activation of CDK1 control the switch of PLK1 localization from centrosomes and kinetochores during metaphase to the central spindle during anaphase [Citation31]. At the G2/M transition, cohesin is phosphorylated by the mitotic kinases CDK1, PLK1, and Aurora B. Then, Wapl will remove the bulk of cohesin from chromosome arms and the sister chromatids move to the opposite poles of the cell [Citation24]. In accordance with this, the GEO analysis and quantitative real-time RT-PCR results showed the consistent uptrend of CDK1 and PLK1 expression in HCC tissues, and higher expression of both indicated a shorter overall survival and disease-free survival.
SGOL2 is vital to regulate sister chromatid cohesion by protecting the integrity of a complex named cohesin. Cohesion, a multi-subunit complex, consisting of two SMC (structural maintenance of chromosome) family proteins – a kleisin subunit Scc1/Rad21 and an accessory subunit Scc3/SA (stromal antigen) [Citation16,Citation32,Citation33], is maintained until metaphase when sister kinetochores attach to microtubules emanating from the opposite spindle poles [Citation34]. SGOL2 regulates chromosome alignment and retention of centromeric protection mainly by recruiting MCAK and PP2A to centromeres, and that the recruitment of these factors largely depends on SGOL2 phosphorylations by Aurora B in Hela cells [Citation35]. There is a report that Aurora B phosphorylates PLK1 on Thr210 and activates PLK1 at centrosomes, active PLK1 and phosphorylates MCAK at Ser715 which promotes its microtubule depolymerase activity essential for faithful chromosome segregation [Citation36]. In prophase, phosphorylation of the cohesin subunit SA by PLK1 promotes the sister chromatid dissociation [Citation37,Citation38], and phosphorylation of the Scc1 subunit by PLK1 enhances its cleavability by separase [Citation39]. Tomoya S. Kitajima et al. revealed the mechanism of protection of cohesion against phosphorylation: SGOL1 associated with protein phosphatase 2A (PP2A) plays a crucial part in counteracting the phosphorylation by PLK1, while SGOL2 is required for the localization of PP2A at centromeres [Citation40]. Hence, the expression of SGOL2 is crucial to the validity and accuracy of cell cycle, both in mitosis and meiosis. Further investigation into the activation mechanism of SGOL1 uncovered that SGOL1 is activated by CDK1-dependent phosphorylation at T346 during early mitosis in human cells, allowing SGOL1 binding to cohesion [Citation41]. The interrelation between SGOL2 and CDK1 is unclear yet, but the high correlation of SGOL2/CDK1 expression indicates an underlying relation. What intrigued us is that disruption of the mouse SGOL2 gene leads to no alterations in sister chromatid cohesion in embryonic cultured fibroblasts or adult somatic tissues. What is more, SGOL2 knockout mice grow normally and survive to adulthood without any abnormality, while both male and female SGOL2-deficient mice are infertile [Citation42]. However, in our study, the GEO analysis manifested that SGOL2 expresses at a statistically significant higher level in HCC tissues compared to normal liver tissues. We speculated that SGOL2-deficiency is unable to cause disordered cell cycle or induce carcinogenesis independently, but its disfunction or high expression is a significant part in the pathological process of HCC. The Kaplan-Meier plotter showed that SGOL2 high-expression is associated with shorter disease-free survival, indicating a worse prognosis. Inaccuracy of chromosome segregation in mitosis gives rise to aneuploidy, which may lead to tumorigenesis under certain contexts. Indeed, errors of cohesin and its regulators are proved to cause human diseases, including cancer [Citation43]. A deep exploration into cohesion stability and dissociation will help to decipher the latent mechanism of carcinogenesis and identify new target genes for early diagnosis or treatment.
Multinuclear cells caused by cytokinesis failure are a common characteristic amongst cancers, and unscheduled polyploidization may cause genomic instability that might lead to neoplastic aneuploidy [Citation44]. The actin-binding protein ANLN is a ubiquitously expressed protein required for cytokinesis. During the interphase of the cell cycle, ANLN is primarily located to the nucleus. At the onset of mitosis, ANLN protein relocates to the cytoplasm where it accumulates in the contractile ring and cleavage furrow during telophase [Citation45]. ANLN knockdown experiment demonstrated that ANLN was required for cytokinesis, for that siANLN-treated cells failed to complete cytokinesis and became large and multinucleated. Further study showed that siANLN-treated cells still appeared to be frozen in anaphase and could not generate a cleavage furrow or contractile ring [Citation46]. There is reported that Anln shRNA inhibits tumor suppressor but not oncogene by affecting the polyploidy in the liver [Citation47]. Magnusson et al. revealed that transient knockdown of ANLN protein expression in breast cancer cell lines resulted in an increase of senescent cells and an accumulation of cells in the G2/M phase of the cell cycle with altered cell morphology including large, poly-nucleated cells [Citation48]. The IHC figures exhibited distinct multinuclear giant cells in HCC tissues. The exact mechanisms by which CDK1 influences ANLN remain unknown, but its presence is important during multiple stages of cytokinesis. Previous research mentioned that inhibition of phosphoinositide 3-kinase/AKT activity in NSCLC (non-small-cell lung cancer) cells decreased the stability of ANLN and caused a reduction of the nuclear ANLN level, which might give us a clue that PI3 K/AKT pathway links up CDK1 and ANLN [Citation49].
4.2. The disordered cell cycle is critical in the carcinogenesis of HCC
Although a multitude of mechanisms have been proposed by bioinformatic analysis, disordered cell cycle is the predominant contributing to the progression of HCC [Citation50,Citation51]. The inerrant cell cycle is precisely regulated throughout the global process, and ultimately determines the fate of organisms. In addition to intrinsic mechanisms, the cell cycle is very sensitive to the extracellular environment and can be altered by factors including growth factors, nutrients, and other stress signals [Citation52]. The FACS analysis showed that the proportion of cells in G2/M phase increased while G0/G1 decreased accordingly following CDK1 knockdown induced by siRNAs.
As is stated above, PLK1/SGOL2 mediated inaccurate chromosome segregation and ANLN mediated abnormal cytokinesis regulated by CDK1 are likely to trigger disordered cell division, thus interfering inherent cell cycle.
What is more, KEGG analysis shows that the downregulated DEGs are implicated with oxidative stress. When the levels of reactive oxygen species (ROS) and reactive nitrogen species (RNS) increase beyond norm, intracellular oxidative stress response is triggered, thus activating a variety of mechanisms to allow them to cope with these changes, which may cause cell injury and lead to initiation and progression of cancer by regulating molecules such as DNA, enhancers, transcription factors, and cell cycle regulators [Citation53]. Chul-Woong Pyo et al. [Citation54] found that exposure of cells to excessive H2O2 induced ubiquitin-dependent proteasomal degradation of cyclin D1, subsequently followed by translational repression. The dual control mechanism was found to contribute to the induction of cell cycle arrest in G2 phase under oxidative stress [Citation55].
The functional analysis of hub genes and DEGs approved metal homeostasis as an enrichment pathway involved in HCC. Correct metal homeostasis is essential for the control of physiology in eukaryotic cells, most of which act as a cofactor for many enzymes and excess of which may be toxic to cells [Citation56]. For instance, via preventing the formation or activation of the cyclin and cyclin-dependent kinase complexes, iron acts as an indispensable regulator of cell cycle. Studies showed that intracellular iron disruption by chelators could cause cell cycle arrest, particularly in G1 and S phases [Citation54,Citation57]. On the other hand, excess intracellular iron may result in oxidative stress response, which can eventually lead to genome instability and disordered cell cycle [Citation58,Citation59]. Several reports have given evidence that alterations in the import, export, and storage of cellular iron may contribute to cancer development, behavior, and recurrence [Citation56].
Taken all together, defect of the cell cycle may intermediate cell transformation and uncontrolled cell growth, dominating the pathological process of malignant tumors. Increased oxidative response and disequilibrium of metal homeostasis make an adverse effect on cell cycle directly or indirectly, subsequently facilitating the carcinogenesis. Therefore, therapies targeting the cell cycle of cancer cells may be a potential strategy for therapy of HCC. The new medical pattern, in which bioinformatic analysis provides clues of potential target genes and possible pathways related to diseases, and clinical specimens and cell experiments offer mechanistic investigation and verification, will facilitate future research on the molecular mechanisms contributing to HCC and promote the discovery of novel diagnosis biomarkers and therapeutic strategies.
Supplemental Material
Download MS Excel (23 KB)Disclosure statement
The authors declare that they have no conflict of interests to state.
Supplementary material
Supplemental data for this article can be accessed here.
Additional information
Funding
Related Research Data
References
- Maluccio M, Covey A. Recent progress in understanding, diagnosing, and treating hepatocellular carcinoma. CA Cancer J Clin. 2012 Nov-Dec;62(6):394–399. Pubmed PMID: 23070690.
- Parkin DM, Bray F, Ferlay J, et al. Global cancer statistics, 2002. Cancer J Clin. 2005 Mar-Apr;55(2):74–108. Pubmed PMID: 15761078.
- Arzumanyan A, Reis HM, Feitelson MA. Pathogenic mechanisms in HBV- and HCV-associated hepatocellular carcinoma. Nat Rev Cancer. 2013 Feb;13(2):123–135. Pubmed PMID: 23344543.
- Grzmil M, Morin P Jr, Lino MM, et al. MAP kinase-interacting kinase 1 regulates SMAD2-dependent TGF-β signaling pathway in human glioblastoma. Cancer Res. 2011 Mar;71(6):2392–2402. Pubmed PMID: 21406405.
- Walsh AM, Kapoor GS, Buonato JM, et al. sprouty2 drives drug resistance and proliferation in glioblastoma. Mol Cancer Res. 2015 Aug;13(8):1227–1237. Pubmed PMID: 25934697.
- Luo S, Cao N, Tang Y, et al. Identification of key microRNAs and genes in preeclampsia by bioinformatics analysis. PLoS One. 2017 Jun 8;12(6):e0178549. Pubmed PMID: 28594854.
- Gaudet P, Škunca N, Hu JC, et al. Primer on the gene ontology. Methods Mol Biol. 2017;1446:25–37, Pubmed PMID: 27812933
- Kanehisa M, Sato Y, Kawashima M, et al. KEGG as a reference resource for gene and protein annotation. Nucleic Acids Res. 2016 Jan;44(D1):D457–462. Pubmed PMID: 26476454.
- Szklarczyk D, Franceschini A, Wyder S, et al. STRING v10: protein-protein interaction networks, integrated over the tree of life. Nucleic Acids Res. 2015 Jan;43(Database issue):D447–452. Pubmed PMID: 25352553.
- Tang Z, Li C, Kang B, et al. GEPIA: a web server for cancer and normal gene expression profiling and interactive analyses. Nucleic Acids Res. 2017 Jul;45(W1):W98–W102. Pubmed PMID: 28407145.
- Malumbres M, Barbacid M. Cell cycle, CDKs and cancer: a changing paradigm. Nat Rev Cancer. 2009 Mar;9(3):153–166. Pubmed PMID: 19238148.
- He Z, Deng W, Jiang B et al.Hsa-let-7b inhibits cell proliferation by targeting PLK1 in HCC Gene 2018 Oct 673 46–55 Pubmed PMID: 29913237
- Spänkuch B, Heim S, Kurunci-Csacsko E, et al. Down-regulation of Polo-like kinase 1 elevates drug sensitivity of breast cancer cells in vitro and in vivo. Cancer Res. 2006 Jun;66(11):5836–5846. Pubmed PMID: 16740723.
- Liu X, Lei M, Erikson RL. Normal cells, but not cancer cells, survive severe Plk1 depletion. Mol Cell Biol. 2006 Mar;26(6):2093–2108. Pubmed PMID: 16507989.
- He Z, Wu J, Dang H, et al. Polo-like kinase 1 contributes to the tumorigenicity of BEL-7402 hepatoma cells via regulation of Survivin expression. Cancer Lett. 2011 Apr;303(2):92–98. Pubmed PMID: 21330050.
- Nasmyth K. Disseminating the genome: joining, resolving, and separating sister chromatids during mitosis and meiosis. Annu Rev Genet. 2001;35:673–745. [ Pubmed PMID: 11700297].
- Hickson GR, O’Farrell PH. Anillin: a pivotal organizer of the cytokinetic machinery. Biochem Soc Trans. 2008 Jun;36(Pt 3):439–441. Pubmed PMID: 18481976.
- Piekny AJ, Maddox AS. The myriad roles of Anillin during cytokinesis. Semin Cell Dev Biol. 2010 Dec;21(9):881–891. Pubmed PMID: 20732437.
- Piekny AJ, Glotzer M. Anillin is a scaffold protein that links RhoA, actin, and myosin during cytokinesis. Curr Biol. 2008 Jan;18(1):30–36. Pubmed PMID: 18158243.
- Barr FA, Gruneberg U. Cytokinesis: placing and making the final cut. Cell. 2007 Nov;131(5):847–860. Pubmed PMID: 18045532.
- McIntosh JR. Mitosis. Cold Spring Harb Perspect Biol. 2016 Sep;8(9). Pubmed PMID: 27587616. DOI:10.1101/cshperspect.a023218
- Sansregret L, Swanton C. The role of aneuploidy in cancer evolution. Cold Spring Harb Perspect Med. 2017 Jan;7(1). Pubmed PMID: 28049655. DOI:10.1101/cshperspect.a028373
- Liao Y, Feng Y, Shen J, et al. The roles and therapeutic potential of cyclin-dependent kinases (CDKs) in sarcoma. Cancer Metastasis Rev. 2016 Jun;35(2):151–156. Pubmed PMID: 26669603.
- Petrone A, Adamo M, Cheng C, et al. Identification of candidate Cyclin-dependent kinase 1(Cdk1) substrates in mitosis by quantitative phosphoproteomics. Mol Cell Proteomics. 2016 Jul;15(7):2448–2461. Pubmed PMID: 27134283.
- Santamaría D, Barrière C, Cerqueira A. Cdk1 is sufficient to drive the mammalian cell cycle. Nature. 2007 Aug;448(7155):811–815. Pubmed PMID: 17700700.
- Nigg EA, Blangy A, Lane HA. Dynamic changes in nuclear architecture during mitosis: on the role of protein phosphorylation in spindle assembly and chromosome segregation. Exp Cell Res. 1996 Dec;229(2):174–180. Pubmed PMID: 8986594.
- Zhao J, Han SX, Ma JL, et al. The role of CDK1 in apoptin-induced apoptosis in hepatocellular carcinoma cells. Oncol Rep. 2013 Jul;30(1):253–259. Pubmed PMID: 23619525.
- Peng Y, Liu Y, Gao Y, et al. USP7 is a novel deubiquitinase sustaining PLK1 protein stability and regulating chromosome alignment in mitosis. J Exp Clin Cancer Res. 2019;38(1):468. PMID: 31730000. .
- Thomas Y, Cirillo L, Panbianco C, et al. Cdk1 phosphorylates SPAT-1/Bora to promote Plk1 activation in C. elegans and human cells. Cell Rep. 2016 Apr;15(3):510–518. Pubmed PMID: 27068477.
- Parrilla A, Cirillo L, Thomas Y, et al. Mitotic entry: the interplay between Cdk1, Plk1 and Bora. Cell Cycle. 2016 Dec;15(23):3177–3182. Pubmed PMID: 27831827.
- Neef R, Gruneberg U, Kopajtich R, et al. Choice of Plk1 docking partners during mitosis and cytokinesis is controlled by the activation state of Cdk1. Nat Cell Biol. 2007;9(4):436–444. PMID: 17351640. .
- Milutinovich M, Koshland DE. Molecular biology. SMC complexes–wrapped up in controversy. Science. 2003 May;300(5622):1101–1102. Pubmed PMID: 12750506.
- Losada A, Hirano T. Dynamic molecular linkers of the genome: the first decade of SMC proteins. Genes Dev. 2005 Jun;19(11):1269–1287. Pubmed PMID: 15937217.
- Hauf S, Watanabe Y. Kinetochore orientation in mitosis and meiosis. Cell. 2004 Oct;119(3):317–327. Pubmed PMID: 15507205.
- Tanno Y, Kitajima TS, Honda T, et al. Phosphorylation of mammalian Sgo2 by Aurora B recruits PP2A and MCAK to centromeres. Genes Dev. 2010 Oct;24(19):2169–2179. PMID: 20889715.
- Shao H, Huang Y, Zhang L et al.Spatiotemporal dynamics of Aurora B-PLK-MCAK signaling axis orchestrates kinetochore bi-orientation and faithful chromosome segregationSci Rep2015Jul512204 PMID: 26206521
- Sumara I, Vorlaufer E, Stukenberg PT, et al. The dissociation of cohesin from chromosomes in prophase is regulated by Polo-like kinase. Mol Cell. 2002 Mar;9(3):515–525. Pubmed PMID: 11931760.
- Hauf S, Roitinger E, Koch B, et al. Dissociation of cohesin from chromosome arms and loss of arm cohesion during early mitosis depends on phosphorylation of SA2. PLoS Biol. 2005 Mar;3(3):e69. Pubmed PMID: 15737063.
- Alexandru G, Uhlmann F, Mechtler K, et al. Phosphorylation of the cohesin subunit Scc1 by Polo/Cdc5 kinase regulates sister chromatid separation in yeast. Cell. 2001 May;105(4):459–472. Pubmed PMID: 11371343.
- Kitajima TS, Sakuno T, Ishiguro K, et al. Shugoshin collaborates with protein phosphatase 2A to protect cohesin. Nature. 2006 May;441(7089):46–52. Pubmed PMID: 16541025.
- Liu H, Rankin S, Yu H. Phosphorylation-enabled binding of SGO1-PP2A to cohesin protects sororin and centromeric cohesion during mitosis. Nat Cell Biol. 2013 Jan;15(1):40–49. Pubmed PMID: 23242214.
- Llano E, Gómez R, Gutiérrez-Caballero C, et al. Shugoshin-2 is essential for the completion of meiosis but not for mitotic cell division in mice. Genes Dev. 2008 Sep;22(17):2400–2413. Pubmed PMID: 18765791.
- Tormos AM, Taléns-Visconti R, Sastre J. Regulation of cytokinesis and its clinical significance. Crit Rev Clin Lab Sci. 2015;52(4):159–167. Pubmed PMID: 26104038.
- Solomon DA, Kim T, Diaz-Martinez LA, et al. Mutational inactivation of STAG2 causes aneuploidy in human cancer. Science. 2011 Aug;333(6045):1039–1043. Pubmed PMID: 21852505.
- Oegema K, Savoian MS, Mitchison TJ, et al. Functional analysis of a human homologue of the drosophila actin binding protein anillin suggests a role in cytokinesis. J Cell Biol. 2000;150:539–552, PMID: 10931866
- Zhang S, Nguyen LH, Zhou K, et al. Knockdown of anillin actin binding protein blocks cytokinesis in hepatocytes and reduces liver tumor development in mice without affecting regeneration. Gastroenterology. 2018 Apr;154(5):1421–1434. Pubmed PMID: 29274368.
- Zhang S, Zhou K, Luo X, et al. The polyploid state plays a tumor-suppressive role in the liver. Dev Cell. 2018 Feb;44(4):447–456. PMID: 29429824.
- Magnusson K, Gremel G, Ryden L, et al. ANLN is a prognostic biomarker independent of Ki-67 and essential for cell cycle progression in primary breast cancer. BMC Cancer. 2016 Nov;16(1):904. PMID: 27863473.
- Suzuki C, Daigo Y, Ishikawa N, et al. ANLN plays a critical role in human lung carcinogenesis through the activation of RHOA and by involvement in the phosphoinositide 3-kinase/AKT pathway. Cancer Res. 2005 Dec;65(24):11314–11325. Pubmed PMID: 16357138.
- Feng R, Ye J, Zhou C et al. Calreticulin down-regulation inhibits the cell growth, invasion and cell cycle progression of human hepatocellular carcinoma cells. Diagn Pathol. 2015 Aug;10:149. Pubmed PMID: 26307067.
- Dituri F, Mazzocca A, Lupo L, et al. PI3K class IB controls the cell cycle checkpoint promoting cell proliferation in hepatocellular carcinoma. Int J Cancer. 2012 Jun;130(11):2505–2513. Pubmed PMID: 21796621.
- Gupta-Elera G, Garrett AR, Robison RA, et al. The role of oxidative stress in prostate cancer. Eur J Cancer Prev. 2012 Mar;21(2):155–162. Pubmed PMID: 21857523.
- Sosa V, Moliné T, Somoza R, et al. Oxidative stress and cancer: an overview. Ageing Res Rev. 2013 Jan;12(1):376–390. Pubmed PMID: 23123177.
- Fu D, Richardson DR. Iron chelation and regulation of the cell cycle: 2 mechanisms of posttranscriptional regulation of the universal cyclin-dependent kinase inhibitor p21CIP1/WAF1 by iron depletion. Blood. 2007 Jul;110(2):752–761. Pubmed PMID: 17429006.
- Pyo CW, Choi JH, Oh SM, et al. Oxidative stress-induced cyclin D1 depletion and its role in cell cycle processing. Biochim Biophys Acta. 2013 Nov;1830(11):5316–5325. Pubmed PMID: 23920145.
- Marques O, da Silva BM, Porto G, et al. Iron homeostasis in breast cancer. Cancer Lett. 2014 May;347(1):1–14. Pubmed PMID: 24486738.
- Siriwardana G, Seligman PA. Two cell cycle blocks caused by iron chelation of neuroblastoma cells: separating cell cycle events associated with each block. Physiol Rep. 2013 Dec;1(7):e00176. Pubmed PMID: 24744856.
- Orrenius S, Nicotera P, Zhivotovsky B. Cell death mechanisms and their implications in toxicology. Toxicol Sci. 2011 Jan;119(1):3–19. Pubmed PMID: 20829425.
- Romero A, Ramos E, de Los Ríos C, et al. A review of metal-catalyzed molecular damage: protection by melatonin. J Pineal Res. 2014 May;56(4):343–370. Pubmed PMID: 24628077.