
ABSTRACT
Gastric cancer (GC) is one of the main causes of the high death rate in the world. But the molecular mechanisms of GC carcinogenesis remain little known. This study aimed to identify novel promising biomarkers of GC and reveal its potential molecular mechanisms by integrating bioinformatics analysis. We screened the overlapped differentially expressed genes (DEGs) of TCGA and several GEO datasets. Among these DEGs, we used protein-protein interactions network analysis to recognize the hub genes. Moreover, functional enrichment analysis including GO and KEGG pathway analysis and gene set enrichment analysis (GSEA) were performed to study the role of DEGs and potential underlying mechanisms of GC. Based on integrated bioinformatics analysis, SERPINH1, COL1A2, COL8A1, COL4A1, COL5A1, COL12A1, and COL1A1 were screened as candidate diagnostic marker genes. In addition, SERPINH1 was identified as a core gene in the regulation of GC development. Furthermore, we confirmed that SERPINH1 could promote the proliferation, migration, and cell cycle of GC cells. Our present study demonstrated that SERPINH1 was a core therapeutic biomarker in the regulation of candidate genes involved in GC progression.
Introduction
Gastric cancer (GC) is one of the serious malignant tumors worldwide with high morbidity and mortality [Citation1]. And the high rate of advanced-stage diagnosis, treatment resistance, and metastasis of GC largely contribute to the poor survival rate and the high recurrence rate of GC patients. Current treatment mainly depended on surgery combined with conventional chemotherapy [Citation2], but the prognosis of patients with GC is still poor. Therefore, identifying the molecular mechanisms and biomarkers for GC diagnosis, metastasis inhibition and treatment is significant and greatly demanded.
Nowadays, high throughput data, including gene expression data from RNA sequencing or microarrays, could be generally applied in search of the molecular mechanisms that drive tumor progression. mRNA expression microarray platforms are applied to detect aberrant mRNA expression and explore differentially expressed genes (DEGs). Microarrays have been used to identify DEGs, some of which have been demonstrated to lead to tumorigenesis and progression in malignancies [Citation3]. Recently, many researchers employed gene expression microarray platforms to understand the tumor program of gene expression in different grade GC tissues and try to discover some genes associated with GC oncogenesis [Citation4]. In these platforms, the Gene Expression Omnibus (GEO) database offers the methods for the bioinformatics mining of gene expression profiles in a variety of tumors [Citation5]. The Cancer Genome Atlas (TCGA) is a database of the most large-scale sequencing data, which provides a flexible and open design that facilitates comprehensive cancer genomic datasets for researchers [Citation6].
In this paper, we identified the DEGs between GC and adjacent normal tissues by integrating three microarray datasets from GEO and TCGA database, aiming to find and confirm the promising novel biomarkers associated with progression and pathogenesis of GC. In the meanwhile, the present study revealed one novel biomarker SERPINH1 may function as an oncoprotein in GC progression and provide new insights into the molecular mechanisms that lead to the occurrence and progression of GC.
Materials and methods
Microarray data
Gene Expression Quantification datasets of Stomach adenocarcinoma samples were downloaded from the TCGA data portal (https://portal.gdc.cancer.gov/), which included 343 tumor samples and 30 normal samples. Another gene expression profiles of GSE26899, GSE33651, and GSE79973 were downloaded from the NCBI GEO (http://www.ncbi.nlm.nih.gov/geo) database. In total, three GEO datasets contained 146 tumor samples and 34 normal samples.
Differentially expressed genes (DEGs)
In TCGA and three GEO datasets, the Limma package in R language was applied to screen DEGs between tumor samples and normal samples. The false discovery rate (FDR) was calculated using a multi‑test package. |log2foldchange|>1 and FDR<0.05 were the cut‑off criteria for DEGs. Intersect function in R was used for identifying the common DEGs among GSE26899, GSE33651, GSE79973, and TCGA. The Venn diagram was generated by the VennDiagram R package. The common DEGs of the four datasets were used for further analysis.
Function and pathway analysis of DEGs
The Database for Annotation, Visualization, and Integrated Discovery (DAVID) version 6.8 was used to analyze the Gene Ontology (GO) and Kyoto Encyclopedia of Genes and Genomes (KEGG) pathways. Biological significance was explored by GO term enrichment analysis, including biological process, cellular component, and molecular function. STRING version 11.0 was used by inserting the gene name of DEGs and exporting the results. P < 0.05 was considered statistically significant.
Interaction and Regulatory Network Establishment
Protein-protein interaction (PPI) network of the overlapping DEGs was conducted using the STRING database. An interaction score of 0.4 was regarded as the threshold. MCODE, a plug-in Cytoscape version 3.6.1, was performed to select the modules from the PPI network. Modules with MCODE scores >5, degree cutoff= 2, node score cutoff= 0.2, Max depth = 100 and k-score = 2 were presented. Hub genes were screened out with degrees ≥10. A network of the genes and their co-expression genes was further evaluated using the online cBioPortal platform. Biological process pathways analysis of hub genes was used by BiNGO plug-in Cytoscape.
Gene set enrichment analysis
Gene set enrichment analysis (GSEA) is a computational method that assesses whether a priori defined a set of genes shows statistically significant, concordant differences between two biological states [Citation7]. To investigate the role of SERPINH1 in GC, GSEA was conducted to analyze the enrichment of datasets between high-SERPINH1 and low-SERPINH1 groups. False discovery rate (FDR) < 25% and nominal pvalue < 5% were set as the cut‐off criteria.
Cell transfection
For overexpression of endogenous SERPINH1, the coding sequence of SERPINH1 was amplified and subcloned into the pcDNA3.1 (+) vector (Invitrogen, Carlsbad, CA, USA) according to the manufacturer’ instructions. Cells were then transfected with a negative control vector (vector) or an overexpression plasmid using lipofectamine 3000 (Invitrogen, Carlsbad, CA, USA). Each cell line was authenticated by short-tandem-repeat (STR) profiling analysis.
An empty plasmid served as a negative control (scramble). siRNAs designed to specifically silence Serpinh1 was purchased from GenePharma (Shanghai, China). A scrambled siRNA served as a control. The siRNA sequences were as follows: si-Serpinh1: 5ʹ-AATGCTGGCATTGGTTGGAAG-3ʹ. siRNAs and the scramble plasmids were also transfected into cells using Lipofectamine 3000 (Invitrogen) according to the manufacturer’s instructions.
Immunohistochemical (IHC) staining
Briefly, core tissue biopsies (2 mm in diameter) were derived from individual paraffin-embedded sections and arranged in recipient paraffin blocks. TMA specimens were cut into 4 μm sections and put on super frost-charged glass microscope slides. Sections were deparaffinized with dimethylbenzene and dehydrated through 100, 95, 85, and 75% ethanol. Antigen retrieval treatment was done in 0.01 mol/L sodium citrate buffer and endogenous peroxidase was blocked by incubation with 3% H2O2 for 10 mins at room temperature. The sections were washed in PBS solution subsequent and blocked with 10% goat serum for 30 mins and incubated with anti-SERPINH1 (ab226052, 1:100, Abcam, rabbit monoclonal) at 4°C for 12 h. The sections were washed in PBS solution three times and incubated with HRP-conjugated secondary antibody for 30 mins at room temperature. All slides were counterstained diaminobenzidine (DAB) solution. At last, sections were counterstained with hematoxylin, dehydrated, cleared and mounted.
Western blot analysis
Tissues and cells were harvested, and protein extracts were obtained by lysis buffer including protease inhibitors (Promega, Madison, WI). Equal amounts of protein were electrophoresed on 10% SDS‑PAGE gels, and then electrophoretically transferred onto polyvinylidene fluoride membranes. Membranes were washed and incubated with respective secondary antibodies and were visualized by enhanced chemiluminescence (Millipore, Beijing, China) according to the manufacturer’s instructions. Antibodies for SERPINH1 were purchased from Abcam (Cambridge, MA, USA). An Odyssey infrared imaging system (LI‑COR Biosciences, Lincoln, NE, USA) was performed to scan the membrane, and PDQuest software (version, 7.2.0; Bio‑Rad Laboratories, Inc.) was used to analyze the protein bands. GAPDH was used as an internal standard.
Flow cytometry
For cell cycle, cells were harvested and fixed with 70% ethanol at 4°C overnight, then washed with PBS twice. The staining for DNA content was used with 50 μg/mL propidium iodide with RNase A (100 mg/mL), followed by incubation for 30 min in the dark at room temperature. Then, cells were evaluated on a FACSCalibur flow cytometer (BD Biosciences, USA). Cell cycle distribution was described as the percentage of cells in G0/G1, S, and G2/M populations and data were analyzed by ModFit LT software.
For cell apoptosis, cells were seeded in 6-well plates (1 × 10⁵ cells/well) after transfection of 48 h. The cells were disposed of double staining with 100 nmol/L Annexin V-FITC/PI. After transfection of 72 h, the cells were washed with PBS at 4°C and then discarded from the plates by digestion with trypsin. After removing the supernatant and washing the cells twice with PBS, cells were re-suspended with 500 μl of Annexin V-FITC binding buffer and incubated with 5 μl of Annexin V-FITC solution and 5 μl of PI for 15 min in the dark. Cell apoptosis was analyzed using flow cytometry. The percentage of early apoptotic cells relative to the total number of cells was displayed as the apoptosis rate.
Cell proliferation assay
Cell proliferation was examined using the MTT assay. Cells transfected with siRNA or empty vector were inoculated in a 96-well plate at a density of 1 × 10³ cells/well containing 200 µl DMEM supplemented with 10% FBS. After 1, 3, and 5 days of incubation, 100 µl of sterile MTT dye (0.5 mg/ml, Sigma, St. Louis, MO, USA) was added to each well and incubated for 4 h. The supernatant was removed, 150 µl DMSO (Sigma) was added to each well, and the spectrophotometric absorbance was determined at 490 nm. All the experiments were performed three times.
Cell migration assays
Cell migration capacity was measured using Transwell chambers (Corning, Corning, NY, USA). Briefly, cells (1 × 10⁵/well) were suspended in 100 µl serum-free medium and then added to the upper chamber of the inserts. DMEM medium (Gibco) containing 10% FBS (500 µl) was added to the lower chamber as the chemotactic factor. After 48 h of incubation, the cells on the lower chambers were fixed using methanol, stained with 0.1% crystal violet for 15 min and was calculated under the microscope.
Statistical analysis
Statistical analysis was performed using SPSS 19.0 software (SPSS Inc., Chicago, IL, USA). Differences between groups were compared using one-way ANOVA and t-test was used to determine differences between groups. Bars and error bars on the graphs as well as data in the text represent the mean ± SD. P < 0.05 was considered as statistical significance.
Results
Identification of DEGs
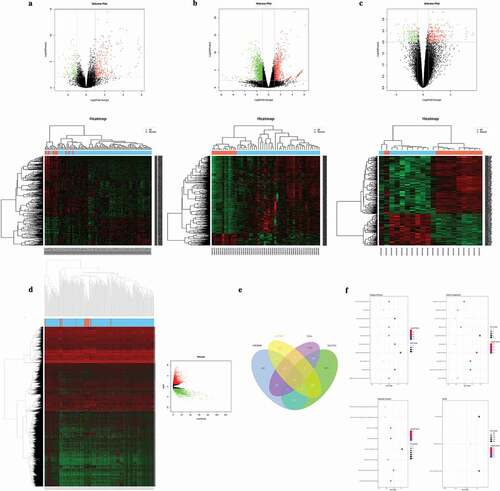
The heatmaps and volcano plots were generated to show the down-regulated and up-regulated genes in GEO datasets (GSE26899, GSE33651, and GSE79973) as well as TCGA GC dataset, respectively (), ), ) and )). A total of 411 overlapping DEGs (log2|fold change| > 1 and FDR < 0.05) including 234 down-regulated and 177 up-regulated genes were screened by intersecting the results of the integrated microarray analysis of all datasets ()).
Figure 1. Hierarchical cluster analysis (Heatmaps) and volcano plots of the common DEGs between GC tissues and normal controls in GSE26899 (a), GSE33651 (b) and GSE79973 (c). Statistically significant DEGs were defined with P< 0.05 and absolute log2FC>1.0 as the cutoff threshold. (d) Hierarchical cluster analysis (Heatmaps) and volcano plots of the common DEGs between GC tissues and normal controls in TCGA. (e) Identification of overlapping DEGs in GC by four profile data (GSE26899, GSE33651, GSE79973, and TCGA) using VennDiagram. Statistically significant DEGs were defined with P< 0.05 and absolute log2FC>1.0 as the cutoff threshold. (f) Functional and signaling pathway analysis of the overlapped DEGs in GC according to biological processes, cellular components, molecular function, and KEGG pathway.
GO and KEGG pathway of DEGs enrichment analysis
GO and KEGG pathway enrichment analysis was used by using the DAVID with a threshold of P< 0.05 ()). Enriched biological processes (BP), cellular component (CC) and molecular function (MF) were used to better understand the biological functions of overlapping DEGs. The results indicated that the significantly enriched GO terms for BP were collagen fibril organization, collagen biosynthetic process, extracellular structure organization, extracellular matrix organization, odontogenesis, and oxidation-reduction; whereas the significantly enriched GO terms for CC were collagen, extracellular matrix part, extracellular region part, extracellular region, and fibrillar collagen. Moreover, the significantly enriched GO terms for MF were extracellular matrix structural constituent, platelet-derived growth factor binding, and Aldo-keto reductase activity. Furthermore, the results of the KEGG pathway analysis revealed that these DEGs were primarily enriched in focal adhesion, drug metabolism, and ECM-receptor interaction. These above significantly enriched terms and pathways will provide further insight toward future research fields of the roles which DEGs play in GC development and progression.
Hub genes identification with DEGs PPI network
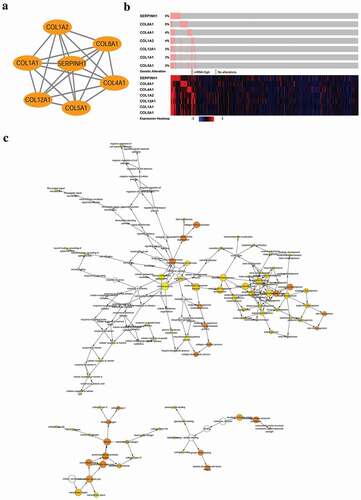
The overlapping DEGs showed a significant cluster of interactions and networks. And the PPIs with combined scores greater than 0.4 were obtained for constructing networks by using the STRING database (Figure S1). Additionally, we used the MCODE plugin for module analysis of the PPI network and the most prominent module was chosen for further pathway analyses based on the degree of importance. The top genes with the highest interaction degrees were selected in this study ()), SERPINH1, COL1A2, COL8A1, COL4A1, COL5A1, COL12A1, and COL1A1 included. Furthermore, based on the results of the cBioPortal database, the OncoPrint results of genomic alterations for these genes were depicted by using the cBioPortal. We found 5% of GC cases exhibited SERPINH1 gene alteration in this cohort. Next, we constructed the expression heatmap and show higher expression of SERPINH1 by using the cBioPortal ()). Biological process analysis of these hub genes was significantly correlated with the extracellular matrix, extracellular structure organization and collagen fibril organization ()). Concerning genes with the most relevance to GC, we chose SERPINH1 as a hub gene for further study.
Figure 2. Interaction network and biological process analysis of the hub genes. (a) The most significant module was obtained from the PPI network. (b) Hub genes and their co-expression genes were analyzed using cBioPortal. (c) The biological process analysis of hub genes was constructed using BiNGO. The color depth of nodes refers to the corrected P-value of ontologies. The size of nodes refers to the number of genes that are involved in the ontologies. P < 0.01 was considered statistically significant.
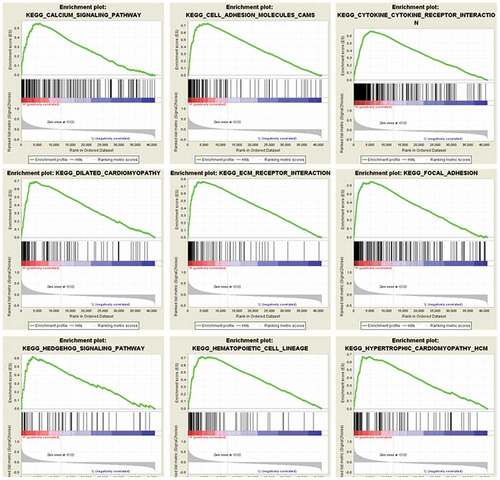
In order to acquire a better understanding of the function of the selected hub gene and signaling pathways activated in GC, we applied GSEA comparing the low and high SERPINH1 expression datasets. Then, GSEA indicated obvious differences (FDR < 0.25, nominal P-value <0.05) in the enrichment, and gene sets related to calcium signaling pathway, cell adhesion molecules, cytokine receptor interaction, ECM receptor interaction, dilated cardiomyopathy, focal adhesion, hedgehog signaling pathway, hematopoietic cell lineage, and hypertrophic cardiomyopathy were differentially enriched with the high expression phenotype of SERPINH1 ().
Figure 3. Enrichment plots from GSEA. GSEA results showing that calcium signaling pathway, cell adhesion molecules, cytokine receptor interaction, dilated cardiomyopathy, ECM receptor interaction, focal adhesion, hedgehog signaling pathway, hematopoietic cell lineage, and hypertrophic cardiomyopathy were significantly enriched in SERPINH1 highly-expressed human GC tissues.
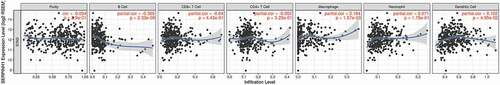
Furthermore, we studied whether SERPINH1 expression associated with tumor immune infiltration level by using the TIMER database (https://cistrome. shinyapps.io/timer/) [Citation8]. Interestingly, we found that the expression of SERPINH1 is significantly negatively related to B cells and has a very weak correlation with macrophages and dendritic cells infiltration level in GC. But SERPINH1 expression showed no distinct correlations with tumor purity and infiltrating levels of CD8 + T cells, CD4 + T cells, and neutrophils in GC ().
Figure 4. Correlation of SERPINH1 expression with immune infiltration level in STAD (stomach adenocarcinoma). SERPINH1 expression is significantly negatively related to B cells and has a very weak correlation with macrophages and dendritic cell infiltration levels in STAD. But SERPINH1 expression has no significant correlations with tumor purity and infiltrating levels of CD8 + T cells, CD4 + T cells, and neutrophils in STAD.
SERPINH1 is up-regulated in GC tissues and cell lines
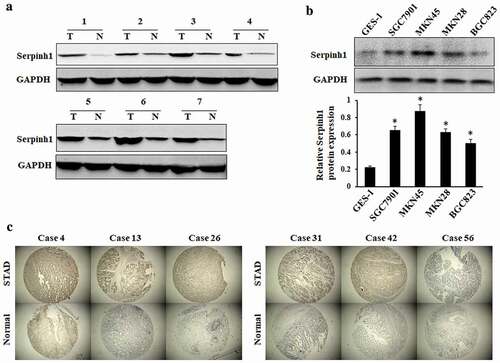
The level of SERPINH1 protein was evaluated in GC tissues by using western blot. The results of western blot exhibited overexpression of SERPINH1 in primary GC tissues compared with paired adjacent normal tissues ()). Moreover, western blot analysis revealed the expression levels of SERPINH1 were higher in GC cell lines than that of normal gastric epithelial cell line GES-1 (), *P < 0.05). Mining of the GEPIA database further confirmed that SERPINH1 was obviously up-regulated in GC tissues compared to normal tissues (Figure S2). Furthermore, the TMA-based immunohistochemical staining results showed markedly higher positivity of SERPINH1 in GC tissues than adjacent normal tissues. And immunohistochemical staining showed that SERPINH1 was present mainly in the tumor cell cytoplasmic. Representative immunohistochemical results in six cases are shown in ).
Figure 5. SERPINH1 expression is upregulated in GC. (a) and (b) Western blot analysis showed that the SERPINH1 expression level in matched GC tissues (t) and adjacent non-tumor tissues (n), and in normal gastric epithelial and GC cell lines. GAPDH was used as a loading control. (c) Representative immunohistochemistry staining results revealed the protein level expression of SERPINH1 in GC and normal tissues. *P < 0.05.
SERPINH1 promotes GC proliferation and migration in vitro
To investigate whether SERPINH1 is involved in the progression of aggressiveness in GC, we tested the functions of SERPINH1 expression on GC cell proliferation and migration by MTT and colony formation assays. And AGS cells or SGC7901 were transfected with pcDNA3.1(+)-SERPINH1 or SERPINH1 knockdown, respectively (), *P < 0.05). The results of the MTT assay indicated that overexpression of SERPINH1 significantly promoted the viability of BGC823 cells. Colony formation assay showed the number of colonies was significantly increased in SERPINH1 overexpressing cells compared with control cells, whereas, knockdown of SERPINH1 markedly suppressed the growth rate and colony formation ability of MKN45 cells compared with that of control cells () and ), *P < 0.05).
Figure 6. SERPINH1 promotes cell proliferation, colony formation and migration in vitro. (a) The SERPINH1 protein level is increased after overexpression of SERPINH1 in BGC823 cells and decreased after knockdown of SERPINH1 in MKN45 cells. (b) Ectopic expression of SERPINH1 stimulates colony formation in BGC823 cells. Knockdown of SERPINH1 expression inhibits colony formation in MKN45 cells. (c) Ectopic expression of SERPINH1 promotes cell migration in BGC823 cells as demonstrated by transwell assays. Knockdown of SERPINH1 expression inhibits cell migration in MKN45 cells, Original magnification ×100. (d) Ectopic expression of SERPINH1 promotes cell proliferation in BGC823 cells whereas knockdown of SERPINH1 inhibits cell proliferation in MKN45 cells as determined by MTT assays. *P < 0.05.
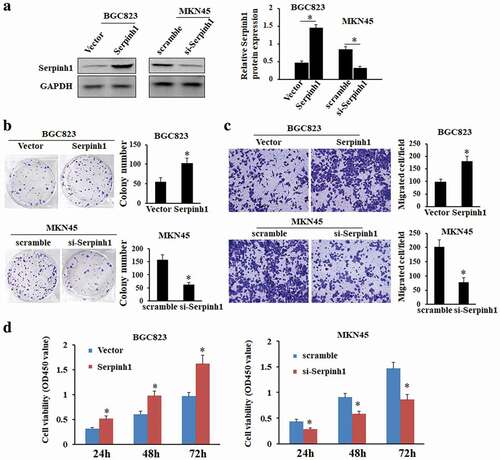
To further investigate the potential role of SERPINH1 expression on cellular migration, we performed transwell assays by SERPINH1 overexpression in BGC823 cells or knockdown of SERPINH1 in MKN45 cells. The results demonstrated that overexpression of SERPINH1 dramatically enhanced the migratory ability of BGC823 cells, whereas, knockdown of SERPINH1 significantly suppressed the migratory ability of MKN45 cells (), *P < 0.05).
SERPINH1 affects the progression of GC cells by regulating the cell cycle and apoptosis
To further evaluate the mechanisms that SERPINH1 promotes cell proliferation, we performed flow cytometry analysis to analyze the cell cycle and apoptosis of GC cell lines after transfection with pcDNA3.1(+)-SERPINH1 or si-SERPINH1. In BGC823 cells, the percentage of cells in the G1 phase decreased and the percentage of cells in the S phase significantly increased after the transfection of SERPINH1 overexpression plasmid. Whereas silencing of SERPINH1 in MKN45 cells led to an increase in the percentage of cells in the G2/M phase. Therefore, these above results suggest that SERPINH1 can accelerate the cell cycle in GC cells ()).
Figure 7. SERPINH1 influences the cell cycle progression and reduced the apoptotic rate by using flow cytometry. (a) Cell cycle detected by flow cytometry in BGC823 or MKN45 cells 48 h after transfection with pcDNA3.1 (+)-SERPINH1 or si-SERPINH1, respectively. Histogram represented the percentage of cells in G1, S and G2 cell-cycle phases. (b) Cell apoptosis was detected by Annexin-V/PI with flow cytometry in BGC823 or MKN45 cells 48 h after transfection with pcDNA3.1 (+)-SERPINH1 or si-SERPINH1, respectively. The apoptotic evaluation was calculated by the percentage of apoptotic cell number in total cell number. *P < 0.05.
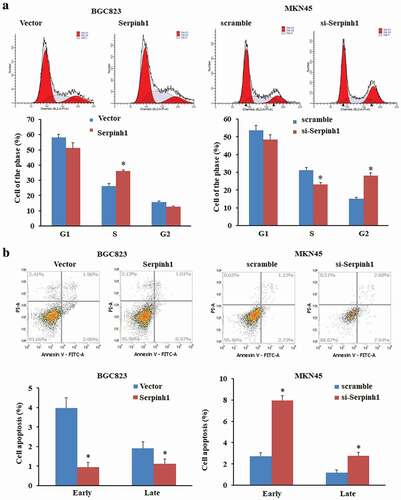
Moreover, we found that the ratio of early and late apoptotic cells was decreased by overexpression of SERPINH in BGC823 cells. In addition, the ratio of apoptotic cells was increased by SERPINH1 silencing in MKN45 cells ()). The above results indicated that SERPINH1 inhibits apoptosis in GC cells. Thus, our data demonstrated that SERPINH1 can lead to the tumor-promoting effects of GC cells in GC development and progression.
Discussion
Currently, in spite of some advances in surgery and treatment measures, the overall five-year survival rate of GC patients has not been improved dramatically. Thus, it is urgent to find and identify the key genes related to the molecular mechanisms of GC tumorigenesis and explore potential diagnostic and therapeutic targets to improve the prognosis of GC patients. In our study, we integrated the gene expression profiles of GSE26899, GSE33651, GSE79973, and TCGA database to screen the DEGs between GC and adjacent normal tissues by bioinformatics analysis. Then, GO terms and the KEGG pathway enrichment analysis of the 411 DEGs were analyzed using the DAVID database. At last, the PPI network of DEGs was constructed, and the top hub genes and the most significant module were selected from the PPI network.
In the present study, seven hub genes were screened out through integrated bioinformatics analysis, including SERPINH1, COL1A2, COL8A1, COL4A1, COL5A1, COL12A1, and COL1A1. The main findings of our study focused on the SERPINH1 gene. SERPINH1 (Serpin peptidase inhibitor clade H, member 1), also known as HSP47, belongs to the serpin superfamily and has been identified as a crucial chaperone protein in the regulation and maintenance of cellular proteostasis [Citation9], which has a close relationship with the development and progression of tumors. Some previous studies have demonstrated that SERPINH1 is highly expressed in various cancers, such as clear cell renal cell carcinoma [Citation10], esophageal squamous cell carcinoma [Citation11], pancreatic cancer [Citation12], glioma [Citation13], head and neck squamous cell carcinoma [Citation14], cervical squamous cell carcinoma [Citation15], and colorectal cancer [Citation16]. These studies have revealed that SERPINH1 accelerated tumor angiogenesis, growth, migration, and metastatic capacity. However, its biological role and clinical significance in GC still remain unclear.
In the present study, we found that the expression level of SERPINH1 was significantly up-regulated in GC tissues and cells. The immunohistochemical staining results indicated that SERPINH1 expression was consistent with its expression of protein level, which further validated the reliability of our results. Previous reports have provided evidence that SERPINH1 may lead to regulate collagen synthesis in the extracellular matrix, thereby promoting cell migration [Citation17]. Moreover, down-regulation of HSP47, which regulates collagen synthesis, may be a key protein for the development of therapeutic approaches for the treatment of scirrhous gastric cancer [Citation18]. In agreement with these reports, our results revealed that SERPINH1 promoted proliferation, colony formation and migration of GC cells. Another previous research reported that SERPINH1 promoted cancer growth and invasion, probably through regulation of the extracellular matrix network, and may be a potential biomarker and therapeutic target [Citation19]. These above reports were consistent with our previous results. Moreover, we also found that SERPINH1 contributed to the G1-S phase transition in GC cell lines and silencing of SERPINH1 induced apoptosis in GC cell lines. Moreover, by using TCGA data, GSEA was performed to further study the effects of SERPINH1 in GC, which showed that calcium signaling pathway, cell adhesion molecules, cytokine receptor interaction, ECM receptor interaction, dilated cardiomyopathy, focal adhesion, hedgehog signaling pathway, hematopoietic cell lineage, and hypertrophic cardiomyopathy are differentially enriched in high expression phenotype of SERPINH1. The findings revealed that SERPINH1 may act as a possible prognostic biomarker and therapeutic target in GC. Furthermore, through TIMER database, our findings demonstrated that there was a weak positive relationship between the expression level of SERPINH1 and infiltration level of macrophages and dendritic cells, and markedly positive correlations between infiltration level of B cells and SERPINH1 expression, which suggested that SERPINH1 might play a special role in the tumor microenvironment.
In summary, with the integrated bioinformatics analysis for GC gene expression profiles, our study found and verified that SERPINH1 was highly expressed in colorectal cancer tissues and cells. SERPINH1 promoted proliferation and migration by regulating the cell cycle and apoptosis in vitro. Therefore, SERPINH1 was indicated to be novel promising candidates for developing effective therapeutic strategies for GC.
Author contributions
WF and LX had responsibility for the design of the study. XQ and XD performed the experiments. JY and TC analyzed the data. WF and TC wrote the manuscript. LX and XQ revised the manuscript.
Supplemental Material
Download Zip (7.7 MB)Disclosure statement
No potential conflict of interest was reported by the authors.
Additional information
Funding
Related Research Data
References
- Bray F, Ferlay J, Soerjomataram I, et al. Global cancer statistics 2018: GLOBOCAN estimates of incidence and mortality worldwide for 36 cancers in 185 countries. CA Cancer J Clin. 2018;68:394–424.
- Wang F-H, Shen L, Li J, et al. The Chinese Society of Clinical Oncology (CSCO): clinical guidelines for the diagnosis and treatment of gastric cancer. Cancer Commun (Lond). 2019;39:10.
- Li T, Xujie G, Lei H, et al. Identification of hub genes with prognostic values in gastric cancer by bioinformatics analysis. World J Surg Oncol. 2018;16:114.
- Wang K, Yuen ST, Xu J, et al. Whole-genome sequencing and comprehensive molecular profiling identify new driver mutations in gastric cancer. Nat Genet. 2014;46:573–582.
- Jiang P, Liu XS. Big data mining yields novel insights on cancer. Nat Genet. 2015;47:103–104.
- Akbani R, Ng PKS, Werner HMJ, et al. A pan-cancer proteomic perspective on the cancer genome atlas. Nat Commun. 2014;5:3887.
- Andrew KPR, Harrison P-L G, Aik-Choon T, et al. GSEA-InContext: identifying novel and common patterns in expression experiments. Bioinformatics. 2018;34:i555–i564.
- Li T, Fan J, Wang B, et al. TIMER: A web server for comprehensive analysis of tumor-infiltrating immune cells. Cancer Res. 2017;77:e108–e110.
- Hirayoshi K, Kudo H, Takechi H, et al. HSP47: a tissue-specific, transformation-sensitive, collagen-binding heat shock protein of chicken embryo fibroblasts. Mol Cell Biol. 1991;11:4036–4044.
- Qi Y, Zhang Y, Peng Z, et al. SERPINH1 overexpression in clear cell renal cell carcinoma: association with poor clinical outcome and its potential as a novel prognostic marker. J Cell Mol Med. 2018;22:1224–1235.
- Kwon YJ, Lee SJ, Koh JS, et al. Expression patterns of aurora kinase B, heat shock protein 47, and periostin in esophageal squamous cell carcinoma. Oncol Res. 2009;18:141–151.
- Duarte BDP, Bonatto D. The heat shock protein 47 as a potential biomarker and a therapeutic agent in cancer research. J Cancer Res Clin Oncol. 2018;144:2319–2328.
- Zhao D, Jiang X, Yao C, et al. Heat shock protein 47 regulated by miR-29a to enhance glioma tumor growth and invasion. J Neurooncol. 2014;118:39–47.
- Lee S, Tseng L, Li Y, et al. Heat shock protein 47 expression in oral squamous cell carcinomas and upregulated by arecoline in human oral epithelial cells. J Oral Pathol Med. 2011;40:390–396.
- Yamamoto N, Kinoshita T, Nohata N, et al. Tumor-suppressive microRNA-29a inhibits cancer cell migration and invasion via targeting HSP47 in cervical squamous cell carcinoma. Int J Oncol. 2013;43:1855–1863.
- Mori K, Toiyama Y, Otake K, et al. Proteomics analysis of differential protein expression identifies heat shock protein 47 as a predictive marker for lymph node metastasis in patients with colorectal cancer. Int J Cancer. 2017;140:1425–1435.
- Kudo H, Hirayoshi K, Kitagawa Y, et al. Two collagen-binding proteins, osteonectin and HSP47, are coordinately induced in transformed keratinocytes by heat and other stresses. Exp Cell Res. 1994;212:219–224.
- Hirai K, Kikuchi S, Kurita A, et al. Immunohistochemical distribution of heat shock protein 47 (HSP47) in scirrhous carcinoma of the stomach. Anticancer Res. 2006;26:71–78.
- Zhu J, Xiong G, Fu H, et al. Chaperone Hsp47 drives malignant growth and invasion by modulating an ECM gene network. Cancer Res. 2015;75:1580–1591.