
ABSTRACT
Myeloma Overexpressed (MYEOV) is closely related to cell growth and differentiation in many cancer types. However, the role of this protein-coding gene in pancreatic ductal adenocarcinoma (PDAC) has rarely been investigated. In this study, we demonstrated that MYEOV was higher expressed in tumor tissues compared with adjacent normal pancreas tissues (ANPTs) both in mRNA and protein levels. We also performed bioinformatic analysis and found high MYEOV expression was positively correlated with tumor differentiation (P = 0.004), lymph node metastasis (P = 0.016) and TNM stage (P = 0.001). Moreover, Kaplan–Meier and Cox proportional-hazards analyses indicated that high MYEOV expression was significantly associated with poor survival in patients with PDAC and that MYEOV was an independent prognostic factor for overall survival in patients with PDAC. Geneset Enrichment Analysis (GSEA) result showed that high expression of MYEOV facilitates glycolysis of tumor cells in PDAC and validated in cellular assays. In conclusion, our results suggest that MYEOV acts as an oncogene in PDAC and can therefore serve as a biomarker for the prognosis of patients with PDAC.
KEYWORDS:
Introduction
Pancreatic ductal adenocarcinoma remains one of the most devastating malignancies all over the world, despite the fact that average progression of all types of cancer is 40–60% from 1970 s to 2011 [Citation1,Citation2]. The mortality rate of PDAC is almost equal to its incidence rate. By 2019, pancreatic cancer ranks fourth among the fatal malignant tumors in western countries and sixth in China; its 5-year survival rate is only 7% or lower [Citation2–Citation4]. Therefore, it is important to study the genes that play a key role in pancreatic ductal adenocarcinoma development because these genes might be useful as disease biomarkers or as targets in its treatment and could also be useful for improving its prognosis.
By using bioinformatic approaches we have identified genes with most significant P-value in prognosis prediction in PDAC. Myeov (Myeloma Overexpressed), which is located in chromosome (chr)11q13.3, a region of cancer-associated genomic amplification [Citation5–Citation8], was initially isolated by the application of the NIH/3T3 tumorigenicity assay with DNA from gastric carcinoma and activated in a subset of multiple myeloma cell lines [Citation9,Citation10]. Several studies have revealed its oncogene role in many types of cancer including non-small cell lung cancer (NSCLC), colorectal cancer, neuroblastoma, esophageal squamous cell carcinoma, gastric cancer and breast cancer [Citation11–Citation20]. Fang li et al. demonstrated that MYEOV transcript functions as a competing endogenous RNA (ceRNA) and plays a critical role in the invasion and metastasis of NSCLC cells in NSCLC [Citation11]. Lawlor G. et al. found that Myeov expression was enhanced after treatment with PGE2 and promote CRC proliferation and invasion [Citation12]. However, the exact role of MYEOV in PDAC has not been researched. Study by Horie et al. predicted Myc as the most affected transcriptional factor in response to knock-down of MYEOV using Integrated Motif Activity Response Analysis (ISMARA) [Citation14]. The finding that 17 out of 38 MYEOV depletion-downregulated genes carries Myc binding sites within the promoter regions supports the prediction, suggesting an involvement of Myc transcriptional activity in MYEOV-mediated tumorigenesis [Citation14]. Myc is also of great importance for PDAC progression and regulates several malignancy biological behaviors such as proliferation and glycolysis. We tentatively hypothesized that MYEOV facilities the transcription of Myc in tumor cells and in that contributes to the PDAC development.
In our study, we first assessed the expression of MYEOV in PDAC both in mRNA and protein level and investigated its correlation with clinicopathologic parameters, long-term overall survival and the potential mechanism that may be involved.
Methods
Human tissue specimens
Ethical approval for human subjects was obtained from the institutional review board of the Shuguang hospital, and written consent was obtained from each patient.
A total of 90 formalin-fixed, paraffin-embedded (FFPE) PDAC tissue samples and 15 pairs of fresh-frozen PDAC tissues and corresponding adjacent normal pancreas tissues were included in this study. All samples were obtained from patients with PDAC who underwent radical surgical resection without preoperative chemotherapy or radiotherapy at Shuguang hospital between January 2004 and December 2015. All diagnoses were confirmed by experienced pathology. Clinical samples were collected from patients after written informed consent was obtained.
Immunohistochemical staining
Paraffin-embedded PDAC tissues were consecutively sectioned at 4-μm intervals and then mounted on polylysine-coated glass slides. The slides were subsequently incubated for 2 h at 62°C, deparaffinized, and rehydrated. Heat-mediated antigen retrieval was performed in 10 mmol/L Tris-citrate buffer (pH 7.0) in a pressure cooker. Endogenous peroxidase activity was blocked by incubating the sections with 3% hydrogen peroxide for 10 min at room temperature. Each section was then incubated with 5% normal goat serum in phosphate-buffered saline containing 0.1% Tween 20 for 1 h at room temperature to block nonspecific binding of the primary antibody. The slides were subsequently incubated with primary antibodies (diluted 1:50) against MYEOV (11,151-1-AP, Proteintech, China) overnight at 4°C. After washing, each slide was incubated with the appropriate horseradish peroxidase (HRP)–labeled secondary antibody and then developed with DAB solution (GeneTech, Shanghai, China) before counterstaining with hematoxylin. Staining intensity was scored as 0, 1, 2, or 3 for absent, weak, moderate, or strong, respectively, and the staining percentage was given a score of 0 (absent) for <5% positive staining, 1 (focal) for 5% to <50% positive staining, 2 (diffuse) for 51% to 80% positive staining or 3 for 81% to 100% positive staining. Final scores were determined by multiplying the 2 numbers mentioned above (“negative” for a score of 0, “weak” for a score of 1–3, “moderate” for a score of 4–6, and “positive” for a score of 7–9). The high expression group had scores greater than 3, while the low expression group scores were less than or equal to 3. Two pathologists assessed the specimens independently. Images were obtained using an Olympus BX63 microscope (Olympus, Japan).
RNA extraction and quantitative real-time polymerase chain reaction
Total RNA was extracted from frozen tissues using RNAiso Plus (TaKaRa, Japan) according to the manufacturer’s instructions and was quantified using a NanoDrop 2000 instrument (Thermo Scientific). Complementary DNA was synthesized using PrimeScript RT Master Mix (TaKaRa) for mRNA according to the manufacturer’s instructions. mRNA expression levels were determined by quantitative real-time polymerase chain reaction (PCR) with SYBR Premix Ex Taq II (TaKaRa) and an ABI 7900HT Fast Real-Time PCR System (Applied Biosystems) using gene-specific primers shown below (Sangon Biotech, Shanghai, China). PCR comprised the following steps: 95°C for 30 s followed by 40 cycles of 95°C for 5 s and 60°C for 30 s. GAPDH was used as an endogenous control to normalize the data. The relative mRNA expression levels were quantified using the 2− ΔΔCt method. All quantitative real-time PCR experiments were performed in triplicate.
Data mining
The RNASeq data for PDAC were downloaded from The Cancer Genome Atlas (TCGA; http://gdc.cancer.gov/), The Genotype-Tissue Expression (GTEx; https://www.gtexportal.org/) and the data in the microarray based on the Affymetrix platform were downloaded from the Gene Expression Omnibus (GEO) GSE102238, GSE28735, GSE15471, and GSE6515 (http://www.ncbi.nlm. nih.gov/geo). The data from TCGA were log2 transformed, and the results were analyzed using Microsoft (Redmond, WA) Excel 2016 and GraphPad (La Jolla, CA) Prism 7 software. Gene set enrichment analysis (GSEA) was performed on the Broad Institute Platform. Characteristic gene sets were analyzed according to the genes presenting the strongest enrichment scores for each gene set.
Cell culture and transfection
Human PDAC cell lines AsPC-1, BxPC-3, CAPAN-1 CFPAC-1 PANC1 and SW1990 and normal human pancreatic ductal cell line hTERT-HPNE were all purchased from the Cell Resource Center, Shanghai Institute of Biochemistry and Cell Biology at the Chinese Academy of Sciences (Shanghai, China). All the cells were cultured in indicated medium according to the protocol in American Type Culture Collection (ATCC, Manassas, VA), and supplemented with 10% (v/v) fetal bovine serum (FBS) and 1% antibiotics (100 μg/ml streptomycin and 100 units/ml penicillin) at 37°C in a humidified incubator under 5% CO2 condition. The small interference RNA (siRNA) targeting human MYEOV(si-1: sense,5ʹ-UCA ACG CCC ACU CUA AAG GCU UCU C-3ʹ; anti-sense,5ʹ- GAG AAG CCU UUA GAG UGG GCG UUG A-3ʹ; si-2: sense,5ʹ- GGA UGU AAG UUA UCA ACU A-3ʹ; anti-sense,5ʹ- UAG UUG AUA ACU UAC AUC C-3ʹ) were transfected into the cells using the RNAiMAX transfection reagent (Thermo Fisher, USA), whereas nonspecific siRNA acted as negative controls. The treated cells were cultured for 3 days and replaced the medium with FBS-free culture medium, then culture the cells for another 24 h. The conditional culture medium was collected and the cells were lysed for RNA extraction.
Seahorse analyses
Extracellular acidification rate (ECAR) of cells was assessed using Seahorse XF96 Flux Analyzer (Seahorse Bioscience, Agilent). In brief, 1 × 10⁴cancer cells were seeded in incubation plate as protocol indicated. Cells were cultured at 37°C overnight for adhesion. Before detection culture medium was replaced as assay media. The glycolytic stress test kit (Seahorse Cat.#103,020-100) was purchased for ECAR detection. The assays were performed following protocol.
Cell viability measurements
Cell viability was measured using a Cell Counting Kit-8 (CCK-8, Dojindo Molecular Technologies, Japan). Cells were collected after stable transfection of 72 h, and then they were seeded in plates (96-well) at the density of 2 × 10⁴ cells/ml. CCK-8 (10 μl/well) reagent was added to each well at 0, 1, 2, 3, 4 and 5 days. The absorbance at each wavelength of 450 nm was measured by an automatic enzyme-linked immune detector after 1 h of incubation. The cell growth curve was plotted with time as the horizontal axis and the OD value as the vertical axis. The experiment was repeated three times.
Statistics
Statistical analysis was performed with SPSS version 23.0 (IBM, Armonk, NY). Differences between groups were compared using Student t-test or Fisher exact test where appropriate. The χ2 test was used to analyze the relationships between categorical variables. The impact of various prognostic factors on the overall and disease-free survival of patients with PDAC was assessed using Cox regression and Kaplan-Meier analysis. Two-tailed P value <.05 was used to indicate statistically significant results.
Results
High expression of MYEOV indicating poor prognosis of patients with PDAC
In order to scan for the genes occupying most significant value in prognosis prediction, TCGA data were downloaded and analyzed. More specifically, all samples are divided into two groups based on the expression level of each gene and the P-value was calculated after Kaplan–Meier analysis. Top 20 is shown in , among which MYEOV occupies the top 1 protein-coding gene. To our surprise, the role of MYEOV in PDAC has never been investigated. We found that high expression of MYEOV predicts better both overall survival (OS) and disease-free survival (DFS) than low expression of MYEOV in TCGA database (). These data indicated that MYEOV may function as an oncogene in PDAC and is associated with poor prognosis of patients.
Table 1. Top 20 most significant survival genes based on TCGA database.
Figure 1. MYEOV is upregulated in PDAC tissues compared with ANPTs. (a) Overall survival and disease-free survival curves for the PDAC patient groups with low and high MYEOV expression in TCGA database. (b) MYEOV was highly expressed in PDAC tissues compared with normal pancreas tissues according to an analysis of data from TCGA GTEx and GEO. (c) Standard immunohistochemical scoring pictures of MYEOV expression in 90 pancreatic cancer tumors and adjacent normal tissues. (d) The protein expression level of MYEOV in TMA. (e) Overall survival curves for the PDAC patient groups with low and high MYEOV expression in TMA.
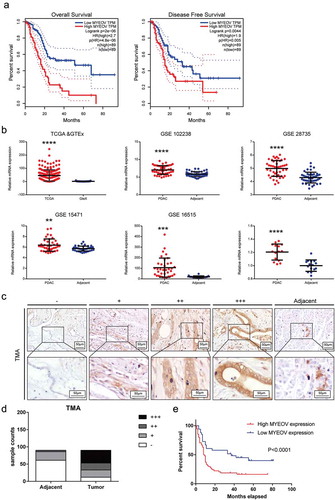
MYEOV highly expressed in PDAC tissues compared with ANPTs
To further determine the clinical significance of MYEOV in PDAC, we used mRNA sequencing or microarray data sets from TCGA, GTEx and GEO, respectively, to analyze MYEOV expression in mRNA level. These data indicated that MYEOV expression was markedly increased in tumor tissues compared with normal pancreas tissues. Fifteen pairs of PDAC tissues were also collected and underwent qPCR for validation (). We then detected the MYEOV expression in protein levels by performing immunohistochemistry in 90 pairs of PDAC and ANPTs microarray (TMA). The expressions were scored based on staining intensity and area (). As shown in ), tumor tissue manifested a higher staining score, and patients with increased MYEOV had a poorer prognosis which is consistent with the analytic results of the TCGA and GEO data (). These data indicate that the expression of MYEOV is higher in tumor tissue compared with ANPTs.
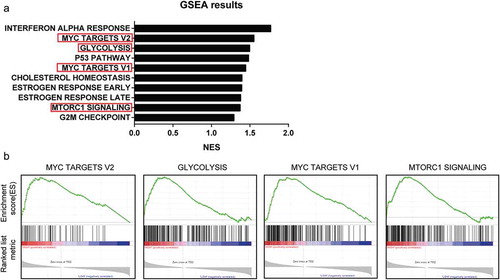
Figure 2. GSEA analysis Result of MYEOV in TCGA database. (a) Top 10 enriched gene sets of GSEA analysis. (b) Enriched glycolysis-related gene sets.
Expression of MYEOV significantly correlated with tumor stage as an independent risk factor in PDAC
Our current research showed that MYEOV expression in PDAC tissues is markedly increased compared with that in ANPTs and correlates with poor prognosis. We then performed Chi-square analysis to evaluate the relationship between MYEOV expressions and the clinicopathologic features of PDAC in TMA cohort. The clinicopathologic features include age, gender, tumor size, tumor differentiation, N classification, M classification, AJCC stage and neural invasion. The patients in TMA cohort have an average age of 62.46 years (from 34 to 83 years), where 58 patients were males and 32 patients were females. As shown in , high expression of MYEOV is significantly correlated with tumor differentiation (P = 0.004), lymph node metastasis (P = 0.016) and TNM stage (P = 0.001), which suggested a potential link between MYEOV and tumor progression.
Table 2. Correlation between MYEOV expression and clinicopathologic factors.
We also used univariate and multivariate analysis to identify the risk factors for PDAC in TMA cohort. Univariate Cox regression analysis suggested that MYEOV expression, TNM stage as well as lymph node metastasis are associated with poor prognosis. Then, multivariate Cox regression analysis demonstrated that only MYEOV expression was an independent risk factor for PDAC patients (). Those results suggest that MYEOV is an independent risk factor for PDAC patients and might work as an oncogene in tumor progression.
Table 3. Univariate and Multivariate Cox regression analysis of potential prognostic factors in pancreatic cancer.
MYEOV contributing to the glycolysis of pancreatic cancer cells
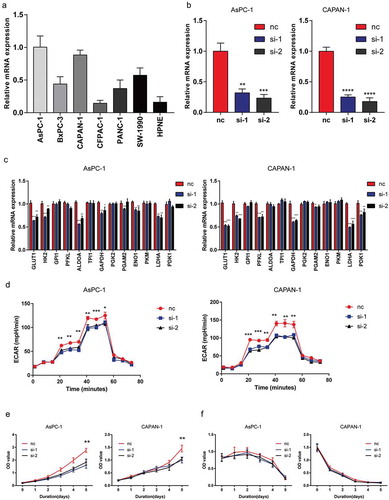
To investigate how MYEOV contribute to the progression of MYEOV, we performed GSEA using TCGA data. As ) showed, several glycolysis-related pathways were enriched in the high MYEOV expression group including two myc-related datasets. The exact genes sets are shown in ). Myc is a vital transcription factor in regulating glycolysis. Tumor microenvironment (TME) of PDAC is characterized with hypoxia and hypovascular, in which glycolysis is of great importance for tumor progression and proliferation. Based on the study by Horie et al. and GESA results [Citation14], we suspect that high expression of MYEOV may take parts in the glycolysis process of cancer cells. To validate our hypothesis, cell lines with highest MYEOV expression level were selected for knockdown assays (,) while PCR was performed to investigate the effect of MYEOV on glycolysis-related genes. We found that knockdown of MYEOV results in impaired expression of GLUT1 HK2 and LDHA in both cell lines (). We then detected the extracellular acidification rate (ECAR) using Seahorse XF96 Flux Analyzer which indicates the glycolysis rate of cells. The result showed that knockdown of MYEOV resulted in decreased ECAR in both cell lines (). To investigate whether the pro-metabolism effect of MYEOV has an impact on tumor cell’s proliferation, we further performed CCK8 assays in both cells lines. Under normal culture medium knockdown of MYEOV could attenuate the viability of tumor cells ()) while when cultured in glucose-free medium the viability of cells in different group no longer had significant difference (). These data demonstrated that MYEOV facilitates the progression of PDAC by contributing to the glycolysis of tumor cells.
Figure 3. Knockdown of MYEOV impairs the glycolysis of PDAC. (a) Relative mRNA expression levels of MYEOV in cell lines. (b) Knockdown efficiency of MYEOV in two PDAC cell lines. (c) Relative mRNA expression levels of glycolysis-related genes. (d) Glycolytic function of AsPC-1 and CAPAN-1 treated with siRNA or not were measured by extracellular acidification rate. (e) Relative cell viability of AsPC-1 and CAPAN-1 cells. (f) Relative cell viability of AsPC-1 and CAPAN-1 cells with absence of glucose.
Discussion
The existing studies on the clinical significance and biological role of MYEOV have shown that its role in PDAC remains unknown. This study serves as the first investigation of the relationship between MYEOV expression in patients with PDAC and prognosis. Our results indicated that MYEOV is highly expressed in PDAC tissues and that patients with high MYEOV expression have a poor prognosis. The oncogene role of MYEOV may be executed by contributing to glycolysis.
As one of the most devastating malignancies, the mortality rate of PDAC is almost equal to its incidence rate. Several factors result in the poor prognosis of PDAC such as a lack of typical symptom, a relative hidden position and so on. This makes it difficult to diagnose in the early stage. In order to investigate the underneath mechanism that may take part in the progression of PDAC, we analyze the data from TCGA to find out the genes that occupy the most significant correlation with the prognosis of PDAC patients. MYEOV is the top one protein-coding gene according to our result. Previous studies revealed that MYEOV is highly expressed in some types of cancer tissues such as non-small cell lung cancer (NSCLC), colorectal cancer, neuroblastoma, esophageal squamous cell carcinoma, gastric cancer and breast cancer [Citation11–Citation20]. TCGA and GEO databases are public repositories of high-throughput microarray or next-generation sequencing genomic datasets for thousands of tumor tissues and tumor types [Citation21,Citation22]. In our study, we first analyzed RNA sequencing data from TCGA and GEO databases. The results indicated that MYEOV expression in tumor tissues was higher than that in ANLTs. We then performed qRT-PCR and IHC to detect MYEOV mRNA levels in PDAC tissues and corresponding ANPTs, and the results were consistent with those mentioned above. These results indicated that MYEOV expression in PDAC tissues is higher than that in ANPTs, and these findings are consistent with those of other studies showing that MYEOV shows differential expression between tumor tissues and normal tissues. Furthermore, IHC was used to detect MYEOV expression in 90 pairs of FFPE PDAC samples and corresponding ANPTs, which supported that PDAC is overexpressed in PDAC. Kaplan-Meier analysis showed that patients with high MYEOV expression had a poorer prognosis than patients with low MYEOV expression. Additionally, multivariate Cox proportional hazards analysis indicated that MYEOV was an independent prognostic factor for overall survival.
We then performed GESA to investigate the potential mechanism in which MYEOV may be involved. As showed, several glycolysis-related pathways were enriched. Tumor cells prefer to utilize glycolysis instead of oxidation phosphorylation to generate energy even when the oxygen is sufficient. This pathological behavior was named the Warburg effect. Thanks to the hypoxia and the hypovascular tumor microenvironment of PDAC, the Warburg effect is of greater importance for pancreatic cancer cell’s proliferation and viability. Thus, we infer that the oncogene role of MYEOV in PDAC may be executed via contributing to the Warburg effect and validated our hypothesis via Seahorse assay.
In conclusion, our results indicated that high MYEOV expression is predictive of prognosis in PDAC patients. MYEOV can serve as an independent prognostic factor for overall survival. High MYEOV expression is strongly correlated with advanced T stage, N stage and TNM stage. Additional studies are required to clarify the molecular mechanisms through which MYEOV promotes PDAC progression.
Disclosure statement
No potential conflict of interest was reported by the authors.
Additional information
Funding
References
- Costello E, Greenhalf W, Neoptolemos JP. New biomarkers and targets in pancreatic cancer and their application to treatment. Nat Rev Gastroenterol Hepatol. 2012;9(8):435–444.
- Siegel RL, Miller KD, Jemal A. Cancer statistics, 2019. CA Cancer J Clin. 2019;69(1):7–34.
- Guo X, Cui Z. Current diagnosis and treatment of pancreatic cancer in China. Pancreas. 2005;31(1):13–22.
- Long J, Luo G-P, Xiao Z-W, et al. Cancer statistics: current diagnosis and treatment of pancreatic cancer in Shanghai, China. Cancer Lett. 2014;346(2):273–277.
- Hui AB-Y, Or Y-Y-Y, Takano H, et al. Array-based comparative genomic hybridization analysis identified cyclin D1 as a target oncogene at 11q13.3 in nasopharyngeal carcinoma. Cancer Res. 2005;65(18):8125–8133.
- Rodrigo JP, García-Carracedo D, García LA, et al. Distinctive clinicopathological associations of amplification of the cortactin gene at 11q13 in head and neck squamous cell carcinomas. J Pathol. 2009;217(4):516–523.
- Brown LA, Irving J, Parker R, et al. Amplification of EMSY, a novel oncogene on 11q13, in high grade ovarian surface epithelial carcinomas. Gynecol Oncol. 2006;100(2):264–270.
- Brown LA, Kalloger SE, Miller MA, et al. Amplification of 11q13 in ovarian carcinoma. Genes Chromosomes Cancer. 2008;47(6):481–489.
- Janssen JW, Vaandrager JW, Heuser T, et al. Concurrent activation of a novel putative transforming gene, myeov, and cyclin D1 in a subset of multiple myeloma cell lines with t(11;14)(q13;q32). Blood. 2000;95(8):2691–2698.
- Specht K, Haralambieva E, Bink K, et al. Different mechanisms of cyclin D1 overexpression in multiple myeloma revealed by fluorescence in situ hybridization and quantitative analysis of mRNA levels. Blood. 2004;104(4):1120–1126.
- Fang L, Wu S, Zhu X, et al. MYEOV functions as an amplified competing endogenous RNA in promoting metastasis by activating TGF-β pathway in NSCLC. Oncogene. 2019;38(6):896–912.
- Lawlor G, Doran PP, MacMathuna P, et al. MYEOV (myeloma overexpressed gene) drives colon cancer cell migration and is regulated by PGE2. J Exp Clin Cancer Res. 2010;29(1):81.
- Moss AC, Lawlor G, Murray D, et al. ETV4 and Myeov knockdown impairs colon cancer cell line proliferation and invasion. Biochem Biophys Res Commun. 2006;345(1):216–221.
- Horie M, Kaczkowski B, Ohshima M, et al. Integrative CAGE and DNA methylation profiling identify epigenetically regulated genes in NSCLC. Mol Cancer Res. 2017;15(10):1354–1365.
- Takita J, Chen Y, Okubo J, et al. Aberrations of NEGR1 on 1p31 and MYEOV on 11q13 in neuroblastoma. Cancer Sci. 2011;102(9):1645–1650.
- Janssen JW, Imoto I, Inoue J, et al. MYEOV, a gene at 11q13, is coamplified with CCND1, but epigenetically inactivated in a subset of esophageal squamous cell carcinomas. J Hum Genet. 2002;47(9):460–464.
- Carneiro A, Isinger A, Karlsson A, et al. Prognostic impact of array-based genomic profiles in esophageal squamous cell cancer. BMC Cancer. 2008;8(1):98.
- Brown J, Bothma H, Veale R, et al. Genomic imbalances in esophageal carcinoma cell lines involve Wnt pathway genes. World J Gastroenterol. 2011;17(24):2909–2923.
- Janssen JW, Cuny M, Orsetti B, et al. MYEOV: a candidate gene for DNA amplification events occurring centromeric to CCND1 in breast cancer. Int J Cancer. 2002;102(6):608–614.
- Leyden J, Murray D, Moss A, et al. Net1 and Myeov: computationally identified mediators of gastric cancer. Br J Cancer. 2006;94(8):1204–1212.
- Zhu Y, Qiu P, Ji Y. TCGA-assembler: open-source software for retrieving and processing TCGA data. Nat Methods. 2014;11(6):599–600.
- Barrett T, Wilhite SE, Ledoux P, et al. NCBI GEO: archive for functional genomics data sets–update. Nucleic Acids Res. 2013;41(Database issue):D991–5.