
ABSTRACT
Altered expressions of long non-coding RNAs (lncRNAs) are potential cancer prognostic biomarkers that play a critical role in the development of tumorigenesis and metastasis of cancer. However, the relationship between the expression of lncRNAs in oral squamous cell carcinoma (OSCC) and the diagnosis, progression, and prognosis of OSCC has not been thoroughly elucidated. To identify the differentially expressed lncRNAs between OSCC tissue and normal tissue, RNA-Seq data were used. lncRNA SLC16A1-AS1 was significantly highly expressed in OSCC samples than that in normal samples. Systematic bioinformatics analysis revealed that SLC16A1-AS1 was associated with histological tumor grades and overall survival status, as well as copy number variation, somatic mutation, tumor mutation burden, tumor stemness, tumor microenvironment and infiltrating immune cells. According to three advanced bioinformatic algorithms prediction (WGCNA, GSEA and GSVA), SLC16A1-AS1 played an essential role in OSCC proliferation and its biological function was related to cell-cycle regulation. Loss-of-function experiments were performed to determine the biological functions of SLC16A1-AS in OSCC cells. Silencing SLC16A1-AS1 significantly reduced the cell proliferation rate and colony-forming ability in both CAL27 and SCC25 cell lines. Flow cytometry and western blot analysis revealed that SLC16A1-AS1 silencing induced G0/G1 cell cycle arrest and inhibited the expression of cyclin D1 in both CAL27 and SCC25 cells. In conclusion, our study comprehensively investigated the role of the lncRNA SLC16A1-AS1 in OSCC growth and proved that it may serve as a new diagnostic indicator and a new target for the treatment of OSCC.
Introduction
Oral cancer includes all malignancies originating in the oral cavity. Each year, oral cancer causes around 300,400 new cases and 145,400 deaths globally, and the incidence is still rising in many countries [Citation1–Citation3]. Histologically, most oral cancer cases are classified as oral squamous cell carcinoma (OSCC) [Citation4]. The 5-year survival rate of OSCC remains about 50% and the prognosis is principally dependent on early detection and effective therapeutic approaches [Citation5]. For the early staged tumors, the cure rate is nearly 95%, and the rate of local recurrence is less than 5%. However, for advance tumors, the cure rate drops to 20–35%, with frequent recurrence and regional lymph node metastasis [Citation6–Citation8]. Thus, improving the diagnostic methods of OSCC is urgent and it requires a better understanding of the progression of such disease.
Previous studies investigating the molecular mechanisms of tumorigenesis mainly focused on protein-coding genes. Recently, researches related to long noncoding RNAs (lncRNAs) have been reported widely. LncRNAs are a class of single-stranded noncoding RNAs which are larger than 200 nucleotides (nt) in length and can’t be translated into proteins. Increasing evidences have suggested that dysregulated expression of lncRNAs may be involved in the pathogenesis of cancer, which could serve as predictors for patients’ outcomes [Citation9–Citation11]. Therefore, it is important to investigate the molecular functions of OSCC-associated lncRNAs in order to understand the development and the progression of OSCC. The expression of LncRNA SLC16A1-AS1 has been found to be less in non-small cell lung cancer tissue than that in adjacent tissue, and its function is associated with viability and proliferation of lung cancer cells as it blocks the cell cycle and promotes cell apoptosis [Citation12]. However, its role in OSCC remains unclear.
In the present study, we proved that SLC16A1-AS1 was aberrantly expressed in OSCC and increased the malignancy of OSCC cells. Notably, the upregulation of SLC16A1-AS1 was related to poor prognosis. Further experiments revealed that SLC16A1-AS1 silencing could inhibit the viability and proliferation of OSCC cells, and block the cell cycle in vitro. We also discovered the genomic features of copy number variation (CNV), tumor mutation burden (TMB), somatic mutation and tumor composition of immune and stromal cells. Our study identified the functions of SLC16A1-AS1 in OSCC cells and its clinical significance. And the results provided new insights into the pathogenesis of OSCC and could potentially assist clinical treatment.
Materials and methods
Data acquisition and preprocess
The row count expression matrix of TCGA-HNSC cohort was obtained from GDC data portal (https://portal.gdc.cancer.gov/). The FPKM (log2[FPKM+1]) expression matrix of TCGA-HNSC cohort, clinical follow-up information and protein expression matrix were downloaded from UCSC Xena database (https://xenabrowser.net/). Somatic mutations data and somatic copy number alternations (CNAs) data were downloaded from TCGA database and firehose database. We selected patients whose anatomic neoplasm subdivisions are from oral cavity (including alveolar ridge, base of tongue, buccal mucosa, floor of mouth, hard palate, lip, oral cavity, oral tongue, and tonsil) and excluded those without clinical information or with incomplete details.
Bioinformatic analysis
The R package “edgR” was used for differentially expressed gene (DEG) analysis and the cutoff values for differentially expressed lncRNAs were set as: FDR<0.01 and |log2 FC|>1. R package “ggplot2” was applied for volcano-plot, boxplot and dot plot (R version 3.6.1). Two ways for grouping were used in Kaplan–Meier (KM) survival analysis including by median SLC16A1-AS1 expression separation and by optimal cut point SLC16A1-AS1 expression separation. The R package “survival” and “survminer” were used for cox proportional hazards model construction and KM-plots visualization. Copy number alternations associated with SLC16A1-AS1 expression were analyzed by GISTIC 2.0. For TMB analysis, we used the somatic called variants determined by TCGA as the raw mutation count. We used 38 Mb as the estimate of the exome size. The stromal scores, immune scores and ESTIMATE scores were performed by R package “ESTIMATE”. The status of infiltration immune cells was analyzed by CIBERSORT to reveal 22 types of immune cells in OSCC. We adapted WGCNA, an advanced method, to identify genes closely related to SLC16A1-AS1. The R package “WGCNA” was conducted, and the power parameter was chosen by the “pickSoftThreshold” function. Hierarchical clustering analysis was applied to classify genes with similar expression profiles into modules based on the TOM dissimilarity with a minimum size of 30 for the gene dendrogram. The correlation between module and SLC16A1-AS1 was calculated to identify the relevant module. Then, gene significance (GS) and module membership (MM) were calculated. The genes with MM>0.8 and GS>0.3 were regarded as key genes related to SLC16A1-AS1. All these processes information have been detailly descripted in previous study [Citation13]. To further understand the function of SLC16A1-AS1 and its related key genes, Gene Ontology (GO) and Kyoto Encyclopedia of Genes and Genomes (KEGG) enrichment analysis were performed in DAVID (Database for Annotation, Visualization, and Integrated Discovery,https://david.ncifcrf.gov/). P-value <0.05 was regarded significant as previous studies did [Citation14]. Online database STRING (https://string-db.org/) was used to identify their relationship and construct the PPI network. The network was re-visualized by software “CytoScape”. To analyze the biological changes occurring with the up-regulation of SLC16A1-AS1, GSEA analysis was performed concerning hallmarks, biological processes and KEGG pathways. Patients were divided into two groups according to SLC16A1-AS1 expression as indicated: low-SLC16A1-AS1 expression group (lowest 20% patients) and high-HXOA10-AS expression group (highest 20% patients). The R package “clusterProfiler” was conducted for GSEA and the cutoff criterion for the significant gene-sets was p-value<0.05. To evaluate whether SLC16A1-AS1 was involved in the OSCC cell cycle process and cell proliferation activity, GSVA was applied in low- and high-SLC16A1-AS1 expression groups (in hallmark gene-sets). The R package “GSVA” was conducted in this process. To confirm that the SLC16A1-AS1 is involved in proliferation, the commonly used markers concerning cell proliferation activity were assessed between low-SLC16A1-AS1 and high-SLC16A1-AS1 groups from mRNA and protein levels. The patients of low-SLC16A1-AS1 and high-SLC16A1-AS1 groups in the reverse phase protein array were these intersected with ones in low- and high- mRNA expression matrix. The commonly used markers for proliferation in transcription level were as follows: MKI67, PCNA, MCM2, MCM3, MCM4, MCM5, MCM6, MCM7. As for the markers in translation level, only PCNA was available.
Cell culture
Human oral squamous carcinoma cell lines, SCC25 and CAL27, were obtained from the State Key Laboratory of Oral Disease (Chengdu, China). The two cell lines were both well characterized and originated from tongue. The cells were cultured in Dulbecco’s Modified Eagle’s medium (DMEM), supplemented with 10% fetal bovine serum and 1% penicillin-streptomycin, at 37°C in a humidified air containing 5% CO2.
Transfection of LncRNA smart silencer
We used LncRNA Smart Silencer, synthesized by RiboBio, to target SLC16A1-AS1. SLC16A1-AS1 Smart Silencer was a mixture of three siRNAs and three ASOs (table S4). The NC Smart Silencer did not contain domains homologous to those in humans, mice, or rats. Transfection was performed with riboFECT™ CP Reagents (Ribobio) according to the manufacturer’s protocols. Experiments were performed 48 hours after transfection.
Quantitative real-time PCR (qRT-PCR)
For gene-detection, total RNA was isolated by TRIzol reagent (Invitrogen, Carlsbad, CA, USA). First-strand cDNA was synthesized from total RNA using a Perfect Real Time PrimeScript® RT reagent kit (Takara, Shiga, Japan), according to the manufacturer’s protocol. SYBR Green Mix (Promega) was applied to amplify target primers. Sequences of the SLC16A1-AS1 primer were as follow: forward primer: TGGACGATGCATATGTGGGG; reverse primer: CACGTTGGTTATGCGGTCAC. GAPDH was used as the endogenous control.
Colony formation assay
Cells were transfected with smart silencer against lncRNA SLC16A1-AS1. After 48 h, 2 × 10³ cells were seeded in six-well plates, and then cultured for 7 days. Cells were fixed with methanol for 20 min at room temperature. After fixation, colonies were stained with 0.1% crystal violet for 15 min.
Cell counting kit-8 assay
Cell proliferation was measured with CCK8 assay (CCK8, Dojindo, Japan). Briefly, cells transfected with smart silencer against SLC16A1-AS1 were seeded in 96-well plates at a density of 1 × 10⁴ cells/well. At 24 h, 48 h, 72 h and 96 h, 10 μl of CCK8 reagent (100 μl medium/well) was added and incubated with cells for 2 h at 37°C, 5% CO2. The absorbance of each well at 450 nm was measured using a spectrophotometer (Thermo, Grand Island, NY, USA) every 24 h following the reagent kit’s instructions for 4 consecutive days to draw a growth curve.
Cell-cycle assays
At 48 h after transfection with smart silencer against SLC16A1-AS1 or NC, cells were harvested, washed twice with cold phosphate-buffered saline (PBS), and fixed with ice-cold 70% ethanol for 24 h at 4°C. After centrifugation at 1500 rpm for 5 min, the cells were washed twice with PBS and resuspended with 0.5 ml of PBS containing PI (50 mg/ml) and RNase (100 mg/ml). The cells were then incubated for 30 min at 37°C. DNA contents were then analyzed using an Elite ESP flow cytometry (Beckman Coulter, CA, USA).
Western blot analysis
Cells were harvested after corresponding treatment and lysed in RIPA lysis buffer (Beyotime, Beijing, China) containing protease inhibitors. Protein concentrations were determined using BCA protein assays. A total of 30 μg of each sample was added and separated by sodium dodecyl sulfate–polyacrylamide gel electrophoresis, then transferred to polyvinylidene fluoride membrane. The primary antibodies were added in 1:1000 dilution and incubated at 4°C overnight. Horseradish peroxidase-conjugated secondary antibodies were added and incubated at room temperature for 1 h. Western blot images were captured using an electrochemiluminescence system (Bio‐Rad).
Statistical analysis
The experiments shown were replicated three times. All data were presented as mean ± SD. The differences between the two groups were performed using a t-test. The differences among the groups were tested by a one-way analysis of variance (ANOVA). Multiple-comparison tests were applied only when a significant difference was determined by the ANOVA. A two-side value of p < 0.05 was considered statistically significant. Graphpad Prim 8 was utilized for statistical analysis.
Results
Identification of differentially expressed lncRNAs in OSCC
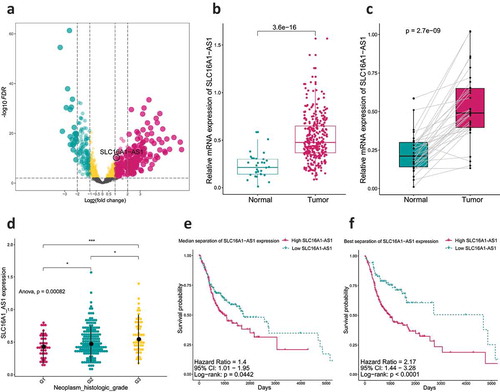
The workflow of this study was presented in , in which lncRNA SLC16A1-AS1 was systematically analyzed from multiple aspects. According to the criterion described in material and methods, a total 359 samples from TCGA-HNSC cohort were included in our study, which were consist of 32 normal samples and 327 OSCC samples. Following the data preprocessing methods, a total 2164 lncRNAs were involved in DEG analysis. To explore the aberrant expressed lncRNAs in OSCC, DEG analysis was performed using the criterion of |log2FC|>1 and FDR<0.01. We finally obtained 494 differentially expressed lncRNAs, among which 336 lncRNAs were up-regulated and 158 lncRNAs were down-regulated in OSCC (table S1). The differentially expressed lncRNAs were presented in a volcano plot ().
Figure 1. Work flowchart of the study.
Figure 2. SLC16A1-AS1 expression and its clinical significance.
Prognosis significance of SLC16A1-AS1 in grades and overall survival
From the DEG results, we found SLC16A1-AS1 was an aberrantly up-regulated lncRNA in OSCC. There was almost no expression of SLC16A1-AS1 in normal samples but high in OSCC including paired samples (), indicating that SLC16A1-AS1 might play a positive role in OSCC tumorigenesis. To verify the risky role of SLC16A1-AS1 in OSCC, we explored the relationship between the SLC16A1-AS1 and clinical features and we found SLC16A1-AS1 expression was associated with histological tumor grades and patient overall survival status. With the tumor grade increasing, the expression of SLC16A1-AS1 also increased, suggesting that SLC16A1-AS1 might be a risk factor of OSCC. Besides, according to both median separation and best separation for SLC16A1-AS1 expression, a lower survival probability, shorter survival time and poorer prognosis were observed in the high-SLC16A1-AS1 patients, confirming that SLC16A1-AS1 was a risk factor for OSCC patients and might be a promoting factor in the tumorigenesis of OSCC (,f and table S2).
SLC16A1-AS1 expression is associated with distinct patterns of genomic alterations
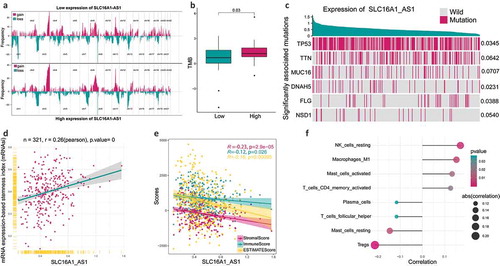
To get a deeper insight into the molecular mechanisms of OSCC, somatic mutations and copy number alterations from TCGA database were analyzed. Somatic copy number alternations were investigated between patients with low and high SLC16A1-AS1 expression. As shown in , an amplification of Chr3 accompanied by a deletion of Chr7 was enriched in OSCC with high SLC16A1-AS1 expression. Whereas gaining of copy number in Chr5 and losing of copy number in Chr1 were enriched in OSCC cases with low SLC16A1-AS1. These results indicated that SLC16A1-AS1 was associated with CNV. As for TMB, patients with high SLC16A1-AS1 expression had a significantly higher TMB than those with low expression, suggesting TMB may be involved in SLC16A1-AS1 expression regulation (). demonstrates associations between the expression of SLC16A1-AS1 and gene mutation status. The top six significantly related genes were presented which means the mutation of these genes was involved in SLC16A1-AS1 expression.
Figure 3. The relationship between SLC16A1-AS1 and tumorigenesis-related features.
Association between SLC16A1-AS1 and immune microenvironment
To understand the relationship between SLC16A1-AS1 and immune microenvironment, ESTIMATE and CIBSORTE algorithm were conducted. The tumor microenvironment including stromal cells and immune cells was significantly negatively correlated with SLC16A1-AS1, suggesting that SLC16A1-AS1 might promote tumor cell proliferation and increase tumor purity (). For the infiltrated immune cells, SLC16A1-AS1 was significantly associated with eight immune cells including NK cells resting, macrophages M1, mast cells activated, T cells CD4 memory activated, plasma cells, T cells follicular cells, mast cells resting and Tregs, in which the first four were positively correlated and the rest were negatively correlated ().
SLC16A1-AS1 related module and key genes
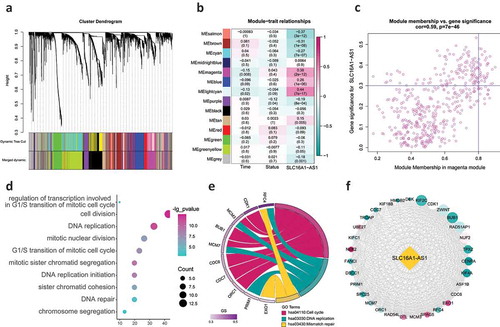
To identify the genes interacting with SLC16A1-AS1, WGCNA was conducted. A total 5028 genes were used for WGCNA and 14 modules were identified (including the gray module) ( and table S3). Further analysis revealed that the magenta module was the second most related (correlation value: 0.38) and significant (p) module associated with SLC16A1-AS1 expression indicating SLC16A1-AS1 may regulate or be regulated by the genes in magenta module (). To confirm that the key genes were regulating SLC16A1-AS1 or being regulated by SLC16A1-AS1, we chose key genes by the criterion of GS>0.3 and MM>0.8. Finally, 31 key genes were identified and they were the genes that played a critical role in magenta module (). The function of SLC16A1-AS1 could be speculated through analyzing these key genes.
Figure 4. WGCNA identifying the key regulating module and biological functions SLC16A1-AS1 involved in.
Biological functions of SLC16A1-AS1-related genes
To understand the biological function of SLC16A1-AS1, we performed functional enrichment analysis including biological processes and KEGG pathways. The results demonstrated that these 31 key genes were almost all involved in cell proliferation-related terms including regulation of DNA replication (such as DNA replication, DNA replication initiation and DNA repair), regulation of mitosis (such as mitotic nuclear division, G1/S transition of mitotic cell cycle and mitotic sister chromatid segregation) (). As for the KEGG pathways, all the three significantly enriched terms were concerned with cell proliferation including cell cycle, DNA replication and mismatch repair (). These results strongly suggested that SLC16A1-AS1 played an essential role in OSCC proliferation and its biological function was related to cell cycle regulation. The PPI network revealed that the 31 key genes were closely related to each other, indicating that they may function together, confirming the reliability of speculation of SLC16A1-AS1’s function ().
The relationship between SLC16A1-AS1 and cell proliferation
To explore the underlying biomolecular changes initiated by SLC16A1-AS1, GSEA was applied to identify the deregulated gene-sets enriched in high-SLC16A1-AS1 expression group. The analysis was performed in three aspects as follows: hallmark gene-sets, KEGG pathway gene-sets and biological process gene-sets. We noted that a lot of cell proliferation-related gene-sets were enriched in high-SLC16A1-AS1 group such as G2 M checkpoint and E2F targets in hallmark (), cell cycle and DNA replication in KEGG pathway (), DNA replication checkpoint and DNA strand elongation in biological process (). These results indicated that SLC16A1-AS1 was closely associated with cell proliferation.
Figure 5. SLC16A1-AS1 is involved in regulation of OSCC cell proliferation via GSEA and GSVA analysis.
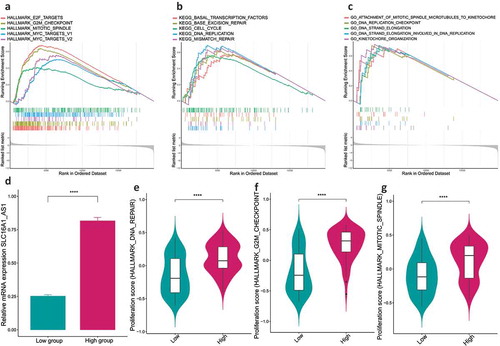
GSVA demonstrated SLC16A1-AS1 promotes cell proliferation
To address how SLC16A1-AS1 was involved in cell proliferation, GSVA was employed to detect the cell proliferation activity and apoptosis status in high-SLC16A1-AS1 expression group (). It turned out that high-SLC16A1-AS1 expression group had a higher proliferation activity including higher G2 M checkpoint activity (), higher mitotic spindle score () and higher DNA repair rate ().
Proliferation markers confirmed SLC16A1-AS1 promote cell proliferation in transcriptional and translational level
In order to further confirm SLC16A1-AS1’s role in cell proliferation regulation and other conclusions presented above, we detected the commonly used markers of cell proliferation, cell cycle and apoptosis from transcriptional and translational level. We detected mRNA expression of cell proliferation markers (MKI67, PCNA, MCM2, MCM3, MCM4, MCM5, MCM6, MCM7) () and protein expression (PCNA) (). It turned out that all these markers were significantly higher in high-SLC16A1-AS1 expression group than the ones in low-SLC16A1-AS1 group, indicating that SLC16A1-AS1 could promote cell proliferation.
Figure 6. SLC16A1-AS1 silencing inhibits cell proliferation and arrest cell cycle of OSCC cells in vitro.
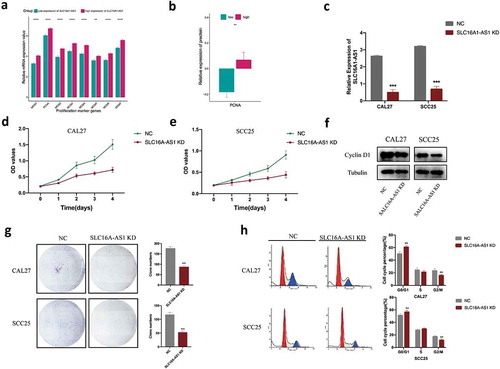
Silencing of SLC16A1-AS1 inhibited the proliferation of OSCC
To further investigate the role of SLC16A1-AS1 in OSCC, we knocked down the cellular level of SLC16A1-AS1 in CAL27 and SCC25 cell lines. The knockdown efficacy was confirmed by qPCR, the results showed that compared with the shame knockdown (NC) group, SLC16A1-AS1 knockdown (KD) group strongly repressed the SLC16A1-AS1 expression level (). The results showed that the knockdown of SLC16A1-AS1 significantly reduced cell proliferation rate in both CAL27 and SCC25 (,e). Meanwhile, SLC16A1-AS1 inhibition significantly reduced the colony-forming ability of two OSCC cells ().
SLC16A1-AS1 inhibition induces cell cycle arrest in OSCC
Flow cytometry was performed to find out whether the growth inhibition induced by SLC16A1-AS1 downregulation was caused by cell cycle arrest. After knockdown of SLC16A1-AS1, the cell cycle distribution analysis showed significantly increased cell populations in the G0/G1 phase and decreased cell populations in the G2/M phase of CAL27 and SCC25 (). To confirm the SLC16A1-AS1-mediated cell cycle arrest in human OSCC cells, cell cycle regulatory protein was examined using Western blotting in SLC16A1-AS1 knockdown OSCC cells. Cyclin D1 was found to be downregulated in CAL27 and SCC25 cells transfected with SLC16A1-AS1 smart silencer ().
Discussion
Oral squamous cell carcinoma is the eighth common malignancy worldwide, and is famous for its high mortality rate and short survival time. Its pathogenesis remains unclear [Citation15]. In our study, we aimed to identify the crucial lncRNA in the development of OSCC, and explore its biological functions in turn, as well as its clinical significance. Through differential analysis, aberrantly expressed lncRNAs were found, in which SLC16A1-AS1 was up-regulated. Next, the clinical relevance of SLC16A1-AS1 was explored, which was closely related to overall survival and histological grades. Moreover, several tumorigenesis characteristics were investigated and we found SLC16A1-AS1 expression was related to CNV, somatic mutation, TMB, tumor stemness, microenvironments and infiltrating immune cells, suggesting either their regulatory role of SLC16A1-AS1 or the vital role of SLC16A1-AS1 in such processes. Then, WGCNA revealed that the magenta module was closely associated with SLC16A1-AS1. Further analysis demonstrated that key genes in magenta module were involved in cell proliferation. Using GSEA and GSVA, we also identified the key functions of SLC16A1-AS1, which was in turn proved by marker genes in cell proliferation. Furthermore, to prove our prediction and uncover the biological function on SLC16A1-AS, experimental validations were conducted including qRT-PCR, CCK8 assay, western-blot, clone formation assay and flow cytometry cell cycle assay. Lastly, we discovered that SLC16A1-AS1 was involved in G0/G1 phase cell cycle arrest and could thus influence cell proliferation.
LncRNA SLC16A1-AS1 has been reported to be related to lung cancer, as its expression was lower in paracancer tissues and could affect the prognosis [Citation12]. Song et al. investigated the role of SLC16A1-AS1 via a competing endogenous RNA regulation network, they found SLC16A1-AS1 could be identified as one of the diagnosis biomarkers, as well as the prognosis and metastasis prediction markers of patients with Hepatocellular carcinoma [Citation16]. However, little was known about the biological functions of SLC16A1-AS1 in OSCC cells. In our work, we combined both bioinformatics analysis of data extracted from TCGA database and a loss-of-function experiment of two OSCC cell lines to gain a better understanding the role of SLC16A1-AS1 in oral cancer. We found the knockdown of SLC16A1-AS1 reduced the proliferation of OSCC cells, suggesting that SLC16A1-AS1 contributed to the progression of OSCC. Cyclin D1 has been found to play a crucial role in cell cycle regulation, including cell proliferation and growth, as well as tumor grade in OSCC samples [Citation17,Citation18]. In this study, SLC16A1-AS1 silencing induced cell cycle arrest in G0/G1 phase and inhibited the expression of cyclin D1, indicating that SLC16A1-AS1 might behave as an oncogene that influences OSCC proliferation through regulating cell cycle-related genes. In previous studies, Li et al. verified that lncRNA CCAT1 played an oncogenic lncRNA role in OSCC carcinogenesis, suggesting a regulatory pathway of CCAT1/miR-181a/wnt in OSCC tumorigenesis [Citation19]. Zhang et al. revealed that lncRNA KCNQ1OT1 was overexpressed in OSCC tissues, and it competed with miR-211-5p and upregulated Ezrin/Fak/Src signaling to promote cisplatin resistance and OSCC progression [Citation20]. In our study, we revealed that SLC16A1-AS1 was highly expressed in oral cancer tissues and cells, and it could promote the proliferation of OSCC cells and accelerate the cell cycle. Nowadays, multi-omics in field of oncology plays an increasingly important role. The famous mutation gene “TP53” is associated with gene expression, lncRNA expression and even immune infiltration status [Citation21–Citation23]. Previous studies reported that TP53 mutation delocalized lncRNA MALAT1 from nuclear speckles and favored its association with chromatin in breast cancer. It also regulated lnc273-31 or lnc273-34 depletion, dramatically diminishing colorectal cancer migration, invasion, cancer stem cell self-renewal and chemoresistance in vitro [Citation24,Citation25]. As for CNV, Yang Y et al. found that CNV contributed to the deregulation of 235 lncRNAs, in which many of them were enriched in co-expressed clusters of genes related to cell adhesion, immune response and metabolic processes [Citation26]. Here, we found that SLC16A1-AS1 expression was associated with CNV, TMB, somatic mutation, suggesting these genomic changes might be involved in SLC16A1-AS1 dysregulation. Recent studies have suggested that lncRNAs played crucial roles in different phases of cancer immunity, including antigen releasing, antigen presentation, immune activation, immune cells migration, infiltration into cancer tissues, and cancer cells killing [Citation27]. Wu J et al. found lncRNA MALAT1 induced tolerogenic dendritic cells and regulatory T cells via miR155/dendritic cell-specific intercellular adhesion Molecule-3 Grabbing Nonintegrin/IL10 axis. Huang D et al. reported that lncRNA NKILA regulated tumor-mediated T cell activation-induced cell death, indicating that engineering lncRNAs in adoptively transferred T cells might provide a novel antitumor immunotherapy [Citation28,Citation29]. Our results revealed that SLC16A1-AS1 had a close relationship with multiple infiltrating immune cells such as NK cells and Tregs. These findings implied the role of SLC16A1-AS1 in OSCC tumor microenvironment regulation. Further studies are needed to confirm these assumptions.
However, there were still some limitations in this current research. For example, the in-depth mechanism of SLC16A1-AS1/CCND1 network remains to be elucidated and the detailed relationship among SLC16A1-AS1, genomic features and tumor microenvironment have not been experimentally validated. Moreover, further validation of the results is needed by in vivo assays and deeper cellular functional experiments.
In summary, the current study is the first to verify that SLC16A1-AS1 was overexpressed in oral cancer tissues and cells, which promoted the growth of oral tumor cell and accelerates cell cycle. These altered expressions promoted environmental changes in cellular proliferation and cell cycle, suggesting that the SLC16A1-AS1 expression level might be a potential diagnostic indicator and a new therapeutic target for OSCCs. However, the potential association among SLC16A1-AS1, genomic alteration and microenvironment was only slightly explored, which needs to be made clear in future researches.
Abbreviations
Supplemental Material
Download Zip (29.4 KB)Disclosure statement
We declare that we have no conflict of interest.
Supplementary material
Supplemental data for this article can be accessed here.
Additional information
Funding
References
- Torre LA, Bray F, Siegel RL, et al. Global cancer statistics, 2012. CA Cancer J Clin. 2015 Mar;65(2):87–108. PubMed PMID: 25651787.
- Fakhry C, Westra WH, Wang SJ, et al. The prognostic role of sex, race, and human papillomavirus in oropharyngeal and nonoropharyngeal head and neck squamous cell cancer. Cancer. 2017 May 1;123(9):1566–1575. PubMed PMID: 28241096; PubMed Central PMCID: PMCPMC5788020.
- Speight PM, Epstein J, Kujan O, et al. Screening for oral cancer-a perspective from the global oral cancer forum. Oral Surg Oral Med Oral Pathol Oral Radiol. 2017 Jun;123(6):680–687. PubMed PMID: 27727113.
- Sargeran K, Murtomaa H, Safavi SMR, et al. Survival after diagnosis of cancer of the oral cavity. Br J Oral Maxillofac Surg. 2008 Apr;46(3):187–191. PubMed PMID: 18096283.
- Markopoulos AK. Current aspects on oral squamous cell carcinoma. Open Dent J. 2012;6:126–130. PubMed PMID: 22930665; PubMed Central PMCID: PMCPMC3428647.
- Shah JP, Gil Z. Current concepts in management of oral cancer–surgery. Oral Oncol. 2009 Apr-May;45(4–5):394–401. . PubMed PMID: 18674952; PubMed Central PMCID: PMCPMC4130348.
- Dik EA, Willems SM, Ipenburg NA, et al. Resection of early oral squamous cell carcinoma with positive or close margins: relevance of adjuvant treatment in relation to local recurrence: margins of 3 mm as safe as 5 mm. Oral Oncol. 2014 Jun;50(6):611–615. PubMed PMID: 24630900.
- Bloebaum M, Poort L, Bockmann R, et al. Survival after curative surgical treatment for primary oral squamous cell carcinoma. J Craniomaxillofac Surg. 2014 Dec;42(8):1572–1576. PubMed PMID: 24636353.
- Sun CC, Zhang L, Li G, et al. The lncRNA PDIA3P Interacts with miR-185-5p to modulate oral squamous cell carcinoma progression by targeting cyclin D2. Mol Ther Nucleic Acids. 2017 Dec 15;9:100–110. PubMed PMID: 29246288; PubMed Central PMCID: PMCPMC5626923.
- Lu T, Liu H, You G. Long non-coding RNA C5orf66-AS1 prevents oral squamous cell carcinoma through inhibiting cell growth and metastasis. Int J Mol Med. 2018 Dec;42(6):3291–3299. . PubMed PMID: 30280186; PubMed Central PMCID: PMCPMC6202082.
- Liu Z, Li H, Fan S, et al. STAT3-induced upregulation of long noncoding RNA HNF1A-AS1 promotes the progression of oral squamous cell carcinoma via activating Notch signaling pathway. Cancer Biol Ther. 2019;20(4):444–453. PubMed PMID: 30404566; PubMed Central PMCID: PMCPMC6422516.
- Liu HY, Lu SR, Guo ZH, et al. lncRNA SLC16A1-AS1 as a novel prognostic biomarker in non-small cell lung cancer. J Investig Med. 2019 Jul 31 PubMed PMID: 31371390. DOI:https://doi.org/10.1136/jim-2019-001080.
- Zhang X, Feng H, Li Z, et al. Application of weighted gene co-expression network analysis to identify key modules and hub genes in oral squamous cell carcinoma tumorigenesis. Onco Targets Ther. 2018;11:6001–6021. PubMed PMID: 30275705; PubMed Central PMCID: PMCPMC6157991.
- Zhang X, Feng H, Li Z, et al. Aspirin is involved in the cell cycle arrest, apoptosis, cell migration, and invasion of oral squamous cell carcinoma. Int J Mol Sci. 2018 Jul 12;19(7). PubMed PMID: 30002310.
- Liao P, Wang H, Tang YL, et al. The common costimulatory and coinhibitory signaling molecules in head and neck squamous cell carcinoma. Front Immunol. 2019;10:2457. PubMed PMID: 31708918; PubMed Central PMCID: PMCPMC6819372.
- Song MJ, Zhong AL, Yang JY, et al. Large-scale analyses identify a cluster of novel long noncoding RNAs as potential competitive endogenous RNAs in progression of hepatocellular carcinoma [Article]. Aging-US. 2019 Nov;11(22):10422–10453. PubMed PMID: WOS:000499683800033; English.
- Troiano G, Caponio VCA, Botti G, et al. Immunohistochemical Analysis Revealed a Correlation between Musashi-2 and Cyclin-D1 Expression in Patients with Oral Squamous Cells Carcinoma [Article]. Int J Mol Sci. 2020 Jan;21(1):9. doi:10.3390/ijms21010121. PubMed PMID: WOS:000515378000121.
- Li Z, Wang C, Jiao X, et al. Cyclin D1 regulates cellular migration through the inhibition of thrombospondin 1 and ROCK signaling. Mol Cell Biol. 2006 Jun;26(11):4240–4256. PubMed PMID: 16705174; PubMed Central PMCID: PMCPMC1489104.
- Li GH, Ma ZH, Wang X. Long non-coding RNA CCAT1 is a prognostic biomarker for the progression of oral squamous cell carcinoma via miR-181a-mediated Wnt/beta-catenin signaling pathway. Cell Cycle. 2019 Nov;18(21):2902–2913. . PubMed PMID: 31599709; PubMed Central PMCID: PMCPMC6791703.
- Zhang S, Ma H, Zhang D, et al. LncRNA KCNQ1OT1 regulates proliferation and cisplatin resistance in tongue cancer via miR-211-5p mediated Ezrin/Fak/Src signaling. Cell Death Dis. 2018 Jul 3;9(7):742. 10.1038/s41419-018-0793-5. PubMed PMID: 29970910; PubMed Central PMCID: PMCPMC6030066.
- Kumar P, Khadirnaikar S, Shukla SK. A novel LncRNA-based prognostic score reveals TP53-dependent subtype of lung adenocarcinoma with poor survival. J Cell Physiol. 2019 Feb 10. PubMed PMID: 30740686.
- Long J, Wang A, Bai Y, et al. Development and validation of a TP53-associated immune prognostic model for hepatocellular carcinoma. EBioMedicine. 2019 Apr;42:363–374. PubMed PMID: 30885723; PubMed Central PMCID: PMCPMC6491941.
- Martinez E, Yoshihara K, Kim H, et al. Comparison of gene expression patterns across 12 tumor types identifies a cancer supercluster characterized by TP53 mutations and cell cycle defects. Oncogene. 2015 May 21;34(21):2732–2740. PubMed PMID: 25088195; PubMed Central PMCID: PMCPMC4317393.
- Pruszko M, Milano E, Forcato M, et al. The mutant p53-ID4 complex controls VEGFA isoforms by recruiting lncRNA MALAT1. EMBO Rep. 2017 Aug;18(8):1331–1351. PubMed PMID: 28652379; PubMed Central PMCID: PMCPMC5538427.
- Zhao Y, Li Y, Sheng J, et al. P53-R273H mutation enhances colorectal cancer stemness through regulating specific lncRNAs. J Exp Clin Cancer Res. 2019 Aug 28;38(1):379. PubMed PMID: 31455383; PubMed Central PMCID: PMCPMC6712617.
- Yang Y, Chen L, Gu J, et al. Recurrently deregulated lncRNAs in hepatocellular carcinoma. Nat Commun. 2017 Feb 13;8:14421. PubMed PMID: 28194035; PubMed Central PMCID: PMCPMC5316832.
- Yu WD, Wang H, He QF, et al. Long noncoding RNAs in cancer-immunity cycle. J Cell Physiol. 2018 Sep;233(9):6518–6523. PubMed PMID: 29574911.
- Huang D, Chen J, Yang L, et al. NKILA lncRNA promotes tumor immune evasion by sensitizing T cells to activation-induced cell death. Nat Immunol. 2018 Oct;19(10):1112–1125. 10.1038/s41590-018-0207-y. PubMed PMID: 30224822.
- Wu J, Zhang H, Zheng Y, et al. The long noncoding RNA MALAT1 induces tolerogenic dendritic cells and regulatory T cells via miR155/Dendritic cell-specific intercellular adhesion Molecule-3 grabbing Nonintegrin/IL10 axis. Front Immunol. 2018;9:1847. PubMed PMID: 30150986; PubMed Central PMCID: PMCPMC6099154.