
ABSTRACT
In males, aging is accompanied by decline in serum testosterone levels due to impairment of testicular Leydig cells. The polycomb protein BMI1 has recently been identified as an anti-aging factor. In our previous study, BMI1 null mice showed decreased serum testosterone and Leydig cell population, excessive oxidative stress and p16/p19 signaling activation. However, a cause-and-effect relationship between phenotypes and pathways was not investigated. Here, we used the rescue approach to study the role of oxidative stress or p16/p19 in BMI1-mediated steroidogenesis. Our results revealed that treatment with antioxidant NAC, but not down-regulation of p16/p19, largely rescued cell senescence, DNA damage and steroidogenesis in BMI1-deficient mouse MLTC-1 and primary Leydig cells. Collectively, our study demonstrates that BMI1 orchestrates steroidogenesis mainly through maintaining redox homeostasis, and thus, BMI1 may be a novel and potential therapeutic target for treatment of hypogonadism.
Introduction
Serum testosterone in humans and rodents declines with age. In most men, serum testosterone slowly declines starting at the age of 30 y. Approximate 20–50% of men over the age of 60 y have serum testosterone levels below those of young men [Citation1–Citation5]. Testosterone deficiency, also called hypogonadism, impacts on the general health of individuals, causing increased body fats, fatigue, low bone mineral density, loss of muscle mass, mood changes and sexual dysfunction [Citation6,Citation7]. Although exogenous testosterone treatment is widely used in treating hypogonadism, this approach has been shown to increase risk of stroke, heart attack, and cancer [Citation8–Citation11]. Additionally, it negatively impacts on luteinizing hormone (LH), further lowering the production of the hormone in Leydig cells, decreased intratesticular testosterone concentration and impaired spermatogenesis. This makes exogenous testosterone treatment inappropriate for men who wish to sire [Citation12,Citation13].
Steroid hormones regulate vital developmental stages and homeostasis of physiological functions. In male, testosterone is secreted in testicular Leydig cells. Secretion of testosterone is largely regulated by the hypothalamus-pituitary-gonadal axis (HPG) [Citation14]. Upon stimulation of Leydig cells by LH, steroidogenic acute regulatory protein (StAR) regulates the transfer of cholesterol across mitochondrial membrane. This is the first step in limiting steroid biosynthesis. It’s followed by conversion of cholesterol to pregnenolone by cytochrome P450 enzyme CYP11A1. Pregnenolone is then metabolized to testosterone by 3β-hydroxysteroid dehydrogenase (3β-HSD), 17α-hydroxylase (CYP17A1) and 17β-hydroxysteroid dehydrogenase (17β-HSD) in the smooth endoplasmic reticulum [Citation15,Citation16].
B lymphoma Mo-MLV insertion region 1 (BMI1), a member of the polycomb transcriptional repressors proteins, was first identified as a proto-oncogene and has since been associated with cell cycle, stem cell maintenance and oncogenesis [Citation17–Citation19]. Mice without BMI1 display premature aging of the entire body, including brain, hematopoiesis, bone, kidney, liver and ovary [Citation20–Citation25], suggesting that this protein exerts anti-aging effects. Mechanistically, BMI1 can transcriptionally repress the expressions of cell cycle dependent kinase inhibitors, p16 and p19, which regulate cell cycle, senescence, and apoptosis [Citation26]. On the other hand, BMI1 is also associated with redox balance, since increased and persistent high levels of reactive oxygen species (ROS) caused by impaired mitochondrial function are sufficient to drive organism senescence through DNA damage in BMI1 null mice [Citation27].
In our previous study, we found that BMI1 was highly expressed in mouse testis and universally expressed in all types of testicular cells. Deficiency of BMI1 in mice caused male infertility with smaller testis size, severe oligospermia and sperm malformation. Germ cells in BMI1 null testes displayed decreased proliferation and increased apoptosis, while the function of Leydig cells was also impaired as a result of reduced serum testosterone levels with down-regulation of 3β-HSD and 17β-HSD levels. Mechanistically, BMI1 null testes depicted excessive oxidative stress and DNA damage, and p16/p19 signaling pathway activation [Citation28], raising the possibility that ROS and p16/p19 are two major repressors during BMI1 mediated testosterone synthesis in Leydig cells. Therefore, this study aimed to explore the role of BMI1 in steroidogenesis, and thus reveal a potential target for clinical therapy in hypogonadism.
Materials and methods
Mouse
CD-1 mice were housed and bred in a controlled environment under a 12/12-h light/dark cycle at 20–24°C and 50–70% humidity, with sufficient food and water. Experiments were performed according to the guidelines by Ethics Committee of Nanjing Medical University.
Cell culture and reagents
Mouse MLTC-1 Leydig cell line was obtained from ATCC (Manassas, VA, USA) and cultured in DMEM medium supplemented with 10% fetal bovine serum (FBS) at 37°C, in a humidified 5% CO2. For primary mouse Leydig cell culture, male adult CD-1 mice were sacrificed, and the testes were washed in phosphate-buffered saline (PBS) and digested with 0.5% (w/v) collagenase IV (Sigma, St. Louis, MO, USA) for 30 min at 37°C. The reaction was stopped with addition of FBS and the supernatant was filtered with 400 mesh stainless screen. Collected cells were suspended in DMEM culture medium supplemented with 10% FBS, and incubated at 37°C under 5% CO2. Testosterone levels were measured with an ELISA kit (Jiancheng Bioengineering, Nanjing, China), according to the manufacturer’s instructions. Cell viability was determined using a Cell Proliferation Reagent Kit (MTT; Beytime, Nantong, China). ROS and ATP assay kits were purchased from Beytime (Nantong, China). PTC-209 and N-acetylcysteine (NAC) were obtained from Selleck (Houston, TX, USA) and Sigma (St. Louis, MO, USA), respectively. P16 siRNA (5ʹ- UUAUGUAUUUUUUAAAGCCAC-3ʹ) and P19 siRNA (5ʹ- AACUCUAUGAUCAUUUGCCGG-3ʹ) were synthesized from genepharma (Shanghai, China).
RNA extraction and quantitative PCR
Total RNA was extracted using the RNeasy Plus Micro Kit (Qiagen, Duesseldorf, Germany), according to the instructions of manufacturer. cDNA synthesis was carried out using the PrimeScript Reverse Transcription Kit (Vazyme, Nanjing, China). SYBR green-based quantitative PCR was performed by an ABI 7500 machine (Applied Biosystems, Foster City, CA, USA). Internal control was done using 18 S rRNA. The primers used in this study were as followings: Bmi1, forward 5ʹ- CTCGCTCCAAGATGGCCG-3ʹ and reverse 5ʹ- ATAAAAGATCCCGGAAAGAGCG-3ʹ; 3β-HSD, forward 5ʹ- TGGACAAAGTATTCCGACCAGA-3ʹ and reverse 5ʹ-GGCACACTTGCTTGAACACAG-3ʹ; 17β-HSD, forward 5ʹ-ACTTGGCTGTTCGCCTAGC-3ʹ and reverse 5ʹ- GAGGGCATCCTTGAGTCCTG-3ʹ; 18sRNA, forward 5ʹ- AAACGGCTACCACATCCAAG −3ʹ and reverse 5ʹ- CCTCCAATGGATCCTCGTTA −3ʹ.
Western blot
Western blot analysis was conducted according to our previous protocol with minor modifications [Citation29,Citation30]. In brief, tissue or cell lysates were loaded on a SDS-PAGE gel and electro-transferred to polyvinylidene difluoride membranes (Bio-Rad, Hercules, USA). Protein bound membranes were blocked with 5% (w/v) milk and probed overnight at 4°C with the indicated primary antibodies (Supplementary Table S1). After incubated with horseradish peroxidase (HRP)-conjugated secondary antibodies at room temperature (RT) for 2 hours, signals were detected by enhanced Chemiluminescent Substrate (Thermo Scientific, Waltham, USA). Resultant band was subsequently analyzed by using Image Pro Plus Software.
Immunofluorescence
Testicular sections were deparaffinized and hydrated as previously described [Citation31,Citation32]. After retrieving antigens with boiling sodium citrate buffer (pH 6.0), the sections were blocked with 10% goat serum at RT for 2 hour and incubated with primary antibodies overnight at 4°C (Supplementary Table S1). The slides were rinsed and incubated with Alexa-Fluor secondary antibodies (Thermo Scientific, Waltham, USA) for 2 h at RT. For cells immunofluorescence, MLTC-1 or primary mouse Leydig cells were fixed in 4% (w/v) paraformaldehyde (PFA), blocked with 2% BSA (w/v), and incubated at 4°C overnight with primary antibodies (Supplementary Table S1). They were then washed with phosphate-buffered saline (PBS), and probed with secondary antibodies for 1 h at RT. All of the slides mentioned above were covered with VECTASHIELD mounting medium with DAPI (VECTOR, Burlingame, CA, USA). Sections were analyzed under a confocal laser microscope (Zeiss LSM800, Carl Zeiss, Oberkochen, Germany).
Flow cytometry analysis
For cell cycle analysis, cells were harvested and fixed with cold ethanol overnight at 4°C. The cell suspension was centrifuged and collected pellets washed with PBS and re-suspended in 500 μl PBS then stained in the dark with propidium iodide (PI) for 30 min. For cell proliferation assay, cells were pre-treated with 20 μM EdU for 2h, fixed and washed with 4% (w/v) PFA and 0.5% Triton X-100 in PBS, respectively, before incubation with 1X Click-iT EdU reaction buffer for 30 minutes at RT. Apoptosis of cells was detected using an Annexin V-FITC/PI kit (Vazyme, Nanjing, China), according to the manufacturer’s instructions. Briefly, cells were harvested and suspended in 100 μl Binding Buffer. The cells were incubated for 10 minutes after addition of 5 μl of Annexin V-FITC and 5 μl of PI Stain. Lastly, 400 μl Binding Buffer was added in each of the samples and kept on ice. The cell samples were analyzed by FACS caliber flow cytometer (Becton Dickinson, Heidelberg, Germany).
TUNEL assay
Apoptotic cells were detected by a TUNEL BrightRed Apoptosis Detection Kit (Vazyme, Nanjing, China), according to our previous procedure [Citation33]. Here, cells were fixed with 4% (w/v) PFA and treated with proteinase K (10 μg/ml) for 10 min at RT, followed by incubation with BrightRed Labeling Buffer for 45 min at 37°C. Cells were washed with PBS and analyzed by a confocal laser microscope (Zeiss LSM800, Carl Zeiss, Oberkochen, Germany).
Cellular ROS analysis
Cells were cultured on a 96 well plate and incubated with 25 μM 2ʹ,7ʹ–dichlorofluorescin diacetate (DCFDA, Invitrogen, USA) for 45 min at 37°C. Cells were then washed once in PBS and fluorescence intensities were measured immediately on a fluorescent plate reader.
Statistical analysis
Quantitative data are presented as mean ± SD from at least three independent experiments. Student’s t-test and One-way ANOVA were used to determine significant differences with * p < 0.05; **p < 0.01; ***p < 0.001.
Results
Levels of BMI1 in testis and Leydig cells of mice
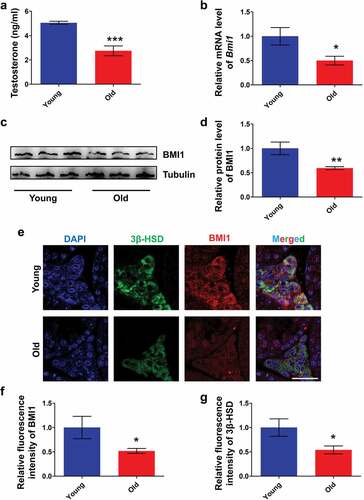
We first examined the levels of serum testosterone and testicular BMI1 in young (12 wk old) and old mice (60 wk old). To our respect, levels of serum testosterone in old group were significantly lower than in young group ()). Accordingly, data from quantitative PCR ()) and western blot (,d)) showed that levels of BMI1 in testes of old mice were low compared with young mice. In order to determine the relationship between BMI1 and Leydig cells, we performed a co-immunostaining of 3β-HSD, a Leydig cell marker [Citation34], and BMI1 in testes from young and old mice. The results revealed that BMI1 in Leydig cells of old mice was markedly reduced, compared with young mice as shown in ,f). It also should be noted that a measurable decrease of 3β-HSD expression in Leydig cells was found in old group (,g)), thus, further supporting an aged status of Leydig cells in old mice. The above results suggest that the expression of BMI1 in mouse Leydig cells is age-related.
Figure 1. Expression pattern of BMI1 in mouse testis. (a) Serum testosterone levels in young (12 wk of old) and old (60 wk old) mice. Sample number = 6. (b) Real-time PCR analysis of expression levels of Bmi1 in testis from young and old mice. Sample number = 3. (c) Western blot analysis for BMI1 in testis from young and old mice. Sample number = 3. (d) Quantification of c. (e) Co-immunostaining of BMI1 and 3β-HSD in testis from young and old mice. (f) Quantification of e. (g) Quantification of e. Sample number = 3. Scale bar: 20 μm. * p < 0.05; **p < 0.01; ***p < 0.001, Student’s t-test.
Inhibition of BMI1 and attenuation of cell viability and testosterone production in MLTC-1 cells
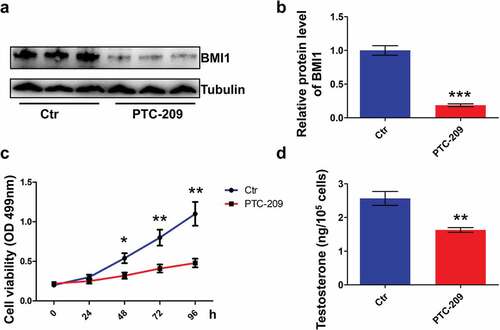
In the present study, MLTC-1 mouse Leydig cell line was used to study the role of BMI1 in steroidogenesis, due to stable and persistent production of testosterone by this type of cell [Citation35–Citation37]. By using small-molecule BMI1 specific inhibitor PTC-209 [Citation38,Citation39], we observed a drastic loss of BMI1 in MLTC-1 cells (,b)). Apparently, MTT assay showed that MLTC-1 cells treated with PTC-209 for 48 h afterward had decreased viability ()). Concomitantly, testosterone production was notably decreased in PTC-209-treated cells for 48 h ()). These results indicate that BMI1 is indispensable for testosterone production in MLTC-1 cells.
Figure 2. BMI1 is required for cell survival and testosterone production in MLTC-1 cells. (a) Western blot results for MLTC-1 cells treated with 10 μM PTC-209 for 48 h. Sample number = 3. (b) Quantification of a. (c) MTT assay for MLTC-1 cells treated with DMSO (Ctr) or 10 μM PTC-209 for the indicated time points. Sample number = 6. (d) Testosterone levels in MLTC-1 cells treated with DMSO (Ctr) or 10 μM PTC-209 for 48 h. Sample number = 6. * p < 0.05; **p < 0.01; ***p < 0.001. For (b,d), Student’s t-test; for (c), one-way ANOVA.
PTC-209 inhibition of cell cycle and promotion of apoptosis in MLTC-1 cells
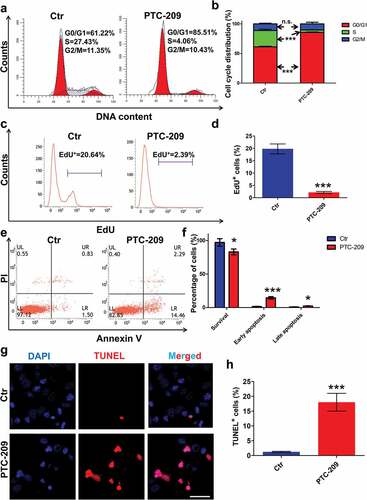
To further determine the effects of PTC-209 on MLTC-1 cells, we first examined the distribution of cell cycle by flow cytometry after treatment with PTC-209 for 48 h. As shown in ,b), PTC-209-treated cells were arrested at G0/G1 phase, with an obvious decline at S phase, whereas cells at G2/M phase did not differ between the two groups. Accordingly, cell proliferation assay via EdU incorporation displayed a significant reduce of EdU positive population in PTC-209-treated cells, compared with control (Ctr) group (,d)). Meanwhile, flow cytometry analysis of apoptosis through Annexin V-FITC/PI revealed an apparent early and slightly late apoptosis in PTC-209-treated cells in comparison with Ctr (,f)). In line with this, terminal in situ nick end labeling (TUNEL) assay also revealed a drastic elevation of cell apoptosis in PTC-209-treated group (,h)). Taken together, these results demonstrate that BMI1 is essential for proliferation and survival of MLTC-1 cells.
Figure 3. Effects of PTC-209 on cell proliferation and apoptosis in MLTC-1 cells. (a) Flow cytometry-based propidium iodide (PI) staining of MLTC-1 cells treated with 10 μM PTC-209 or DMSO (Ctr) for 48 h. (b) Quantification of a. Sample number = 3. (c) Flow cytometry-based EdU incorporation test of MLTC-1 cells treated with 10 μM PTC-209 or DMSO for 48 h. (d) Quantification of c. Sample number = 3. (e) Flow cytometry-based Annexin V-FITC/PI staining of MLTC-1 cells treated with 10 μM PTC-209 or DMSO for 48 h. (f) Quantification of e. Sample number = 3. (g) TUNEL assay for MLTC-1 cells treated with 10 μM PTC-209 or DMSO for 48 h. (h) Quantification of g. Sample number = 3. Scale bar: 20 μm. * p < 0.05; ***p < 0.001; n.s.: no significance, Student’s t-test.
PTC-209 triggers oxidative stress and p16/p19 signaling in MLTC-1 cells
To evaluate whether BMI1-deficent MLTC-1 cells undergo oxidative stress, we first examined the amount of ROS in PTC-209-treated cells ()). The result showed that ROS level in PTC-209-treated group was significantly accelerated, compared with Ctr. Meanwhile, ATP content was markedly declined in PTC-209-treated cells ()), suggesting impaired mitochondrial function after depletion of BMI1.
Figure 4. PTC-209 activates ROS generation and p16/p19 signaling in MLTC-1 cells. (a) Level of ROS in MLTC-1 cells treated with DMSO (Ctr) or 10 μM PTC-209 for 48 h. Sample number = 6. (b) Relative ATP levels in MLTC-1 cells treated with DMSO or 10 μM PTC-209 for 48 h. Sample number = 6. (c) Immunostaining of γ-H2AX in MLTC-1 cells treated with DMSO or 10 μM PTC-209 for 48 h. (d) Quantification of c. Sample number = 3. (e) Immunostaining of 8-OHdG in MLTC-1 cells treated with DMSO or 10 μM PTC-209 for 48 h. (f) Quantification of e. (g) Western blot analysis for p16 and p16 in MLTC-1 cells treated with DMSO or 10 μM PTC-209 for 48 h. (h,i) Quantification of g. Sample number = 3. Scale bar: 20 μm. **p < 0.01; ***p < 0.001, Student’s t-test.
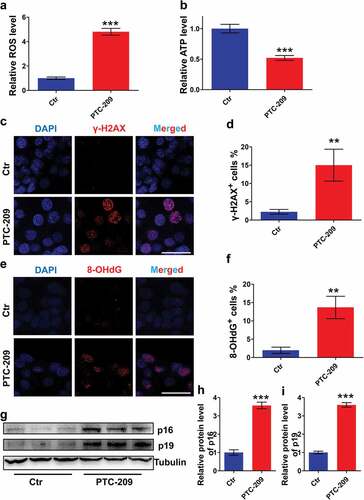
Oxidative stress always trigger activation of DNA damage [Citation40]. To determine whether excessive oxidative stress in PTC-209-treated cells showed this effect, we therefore performed an immunostaining of MLTC-1 cells using γ-H2AX (a maker of DNA double strand break (DSB)) [Citation41] and 8-OHdG (a maker of DNA oxidation) [Citation42] antibodies, respectively. We observed that percentages of γ-H2AX (,d)) and 8-OHdG (,f)) positive cells were increased notably in PTC-209-treated cells compared with Ctr group. To identify whether the changes in proliferation and apoptosis in PTC-209-treated cells were involved in the activation of p16/p19 signaling, protein levels of p16 and p19 were examined by western blot. It was revealed that expression of p16 and p19 were markedly up-regulated in PTC-209-treated cells (-i)). Altogether, these findings indicate that oxidative stress and p16/p19 signaling are activated in BMI1-deficent MLTC-1 cells.
ROS, but not the p16/p19 signaling, was the major repressor of BMI1 mediated steroidogenesis in MLTC-1 cells
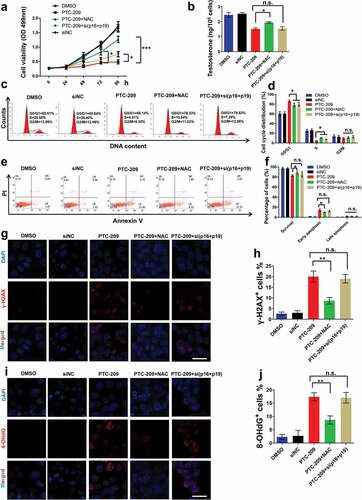
It has been well established that ROS and p16/p19 pathways are two major downstreams of BMI1, as a consequence of rescue effects on the altered phenotypes in BMI1 null mouse by treatment with antioxidant scavenger N-acetylcysteine (NAC) or knock-out of p16/p19 [Citation27,Citation43]. Therefore, we sought to address whether ROS and/or p16/p19 contribute to altered phenotypes in PTC-209-treated MLTC-1 cells. By treatment with NAC or siRNA mediated p16/p19 silencing (si(p16+ p19)) (Supplementary Figure S1) in PTC-209-treated cells, we observed that NAC could significantly rescue the cell viability from treatment with PTC-209 for 72 h, whereas p16/p19-siRNA only showed a slight rescue effect after treatment with PTC-209 for 96 h ()). To our respect, testosterone production was partly restored after a 96 h treatment with NAC in PTC-209-treated MLTC-1 cells, while there was no difference in testosterone level in PTC-209-treated cells regardless of the presence of p16/p19-siRNA ()). This finding suggests that ROS plays a pivotal role in depressing testosterone synthesis in BMI1-deficent MLTC-1 cells. To further support our hypothesis, we analyzed the effects of NAC and p16/p19-siRNA on cell cycle (,d)), apoptosis (,f)) and DNA damage (-j)) in PTC-209-treated cells for 96 h. The results revealed that NAC could largely recover cell cycle, apoptosis, as well as DNA damage in PTC-209-treated cells, whereas p16/p19-siRNA only recovered cell cycle in the same set of cells. These results cement the role of ROS in repressing BMI1 mediated steroidogenesis in MLTC-1 cells, and that antioxidant scavenger NAC can efficiently rescue altered phenotypes in PTC-209-treated cells.
Figure 5. Effects of NAC and p16/p19 silencing in PTC-209-treated MLTC-1 cells. (a) Cell viability in MLTC-1 cells treated with DMSO, negative control siRNA (siNC) 10 μM PTC-209, 500 μM NAC or co-transfection of siRNA against p16 and p19 (50 nM) for the indicated time points. Sample number = 6. (b) Testosterone levels in MLTC-1 cells treated with DMSO, siNC, 10 μM PTC-209, 500 μM NAC or co-transfection of siRNA against p16 and p19 (50 nM) for 96 h. Sample number = 6. (c) Flow cytometry-based PI staining of MLTC-1 cells treated with DMSO, siNC, 10 μM PTC-209, 500 μM NAC or co-transfection of siRNA against p16 and p19 (50 nM) for 96 h. (d) Quantification of c. Sample number = 3. (e) Flow cytometry-based Annexin V-FITC/PI staining of MLTC-1 cells treated with DMSO, siNC, 10 μM PTC-209, 500 μM NAC or co-transfection of siRNA against p16 and p19 (50 nM) for 96 h. (f) Quantification of e. Sample number = 3. (g) Immunostaining of γ-H2AX in MLTC-1 cells treated with DMSO, siNC, 10 μM PTC-209, 500 μM NAC or co-transfection of siRNA against p16 and p19 (50 nM) for 96 h. (h) Quantification of g. Sample number = 3. (i) Immunostaining of 8-OHdG in MLTC-1 cells treated with DMSO, siNC, 10 μM PTC-209, 500 μM NAC or co-transfection of siRNA against p16 and p19 (50 nM) for 96 h. (j) Quantification of i. Sample number = 3. Scale bar: 20 μm. * p < 0.05; **p < 0.01; n.s.: no significance, one-way ANOVA.
Antioxidant NAC restores steroidogenesis in PTC-209-treated primary mouse Leydig cells
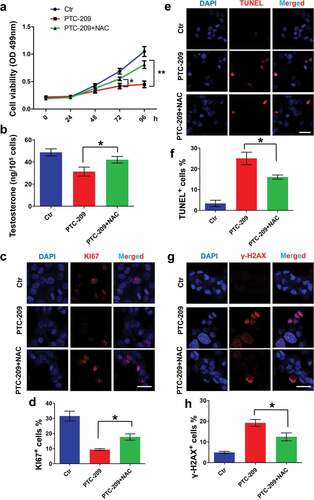
Finally, primary mouse Leydig cells were used in order to further support our findings in MLTC-1 cells. In accordance with findings in MLTC-1 cells, treatment with NAC could significantly restore cell viability ()) and testosterone level ()) in PTC-209-treated primary mouse Leydig cells. Furthermore, quantitative PCR showed that levels of 3β-HSD and 17β-HSD in PTC-209-treated group were significantly reduced compared with Ctr group (Supplementary Figure S2). In addition, cell proliferation, apoptosis and DNA damage were assayed by immunostaining of KI67 (a maker of cell proliferation) (,d)) [Citation44], TUNEL (,f)), and immunostaining of γ-H2AX (,h)). The results showed that PTC-209 markedly inhibited cell proliferation and promoted cell apoptosis and DNA damage. With addition of NAC, altered phenotypes mentioned above were obviously rescued. Combined with our findings from MLTC-1 cells, we conclude that BMI1 play a crucial role in steroidogenesis mainly through maintaining oxidative stress but not p16/p19 signaling.
Figure 6. Effects of NAC in PTC-209-treated primary mouse Leydig cells. (a) MTT assay in primary mouse Leydig cells treated with DMSO (Ctr), 10 μM PTC-209 and 500 μM NAC for the indicated time points. Sample number = 6. (b) Testosterone levels in primary mouse Leydig cells treated with DMSO, 10 μM PTC-209 and 500 μM NAC for 96 h. Sample number = 6. (c) Immunostaining of KI67 in primary mouse Leydig cells treated with DMSO, 10 μM PTC-209 and 500 μM NAC for 96 h. (d) Quantification of c. Sample number = 3. (e) TUNEL assay for primary mouse Leydig cells treated with DMSO, 10 μM PTC-209 and 500 μM NAC for 96 h. (f) Quantification of e. Sample number = 3. (g) Immunostaining of γ-H2AX in primary mouse Leydig cells treated with DMSO, 10 μM PTC-209 and 500 μM NAC for 96 h. (h) Quantification of g. Sample number = 3. Scale bar: 20 μm. * p < 0.05; **p < 0.01, one-way ANOVA.
Discussion
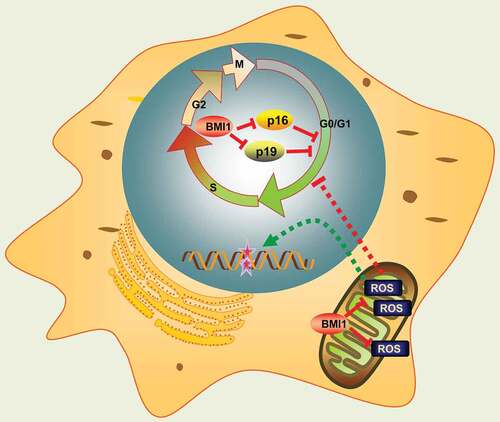
Nuclear BMI1 has been shown to repress p16 and p19 cell cycle inhibitors, thus promoting progression of cell cycle [Citation43,Citation45]. In nuclei, BMI1 cooperates with RING1B to monoubiquitinate histone H2A at lysine119, repressing transcription of the associated gene by blocking RNA polymerase II [Citation46–Citation48]. However, emerging evidences imply several BMI1 associated pathways that are independent of p16/p19. For instance, Liu et al. reported that BMI1-deficent mice had impaired mitochondrial function, aberrant increase of ROS and subsequent DNA damage. Moreover, many of the phenotypes observed in BMI1 null mice could be largely rescued after treatment with NAC or knock-out of Chk2, a DNA damage response factor [Citation27]. More recently, Mustafi et al. revealed a mitochondrial distribution of BMI1 in CP20, OV202, OSE and COS7 cells. They found that mitochondrial BMI1 cooperated with polynucleotide phosphorylase (PNPase) to maintain mitochondrial metabolism, enhance ATP synthesis and prevent aberrant ROS generation [Citation49]. Consistent with these findings, in this study, inhibition of BMI1 by PTC-209 in MLTC-1 cells also depicted cell cycle arrest and apoptosis, as a consequence of the activation of ROS-DNA damage and p16/p19 pathways (). Intriguingly, oxidative stress and p16/p19 affected cell survival differently in our study. Treatment of antioxidant NAC largely rescued cell cycle arrest, apoptosis and DNA damage, and finally restored steroidogenesis in PTC-209-treated cells, whereas down-regulation of p16/p19 only showed a slight rescue of arrested cell cycle and failed to restore steroidogenesis. Therefore, these results indicate that redox homeostasis is more critical for relaying BMI1 function in MLTC-1 cells.
Figure 7. Schematic representation of BMI1 function. Mitochondrial BMI1 inhibits ROS generation through maintaining bioenergetics homeostasis in cells, thus preventing DNA damage, apoptosis and cell cycle arrest. On the other hand, nuclear BMI1 transcriptionally represses p16 and p19 expression and prevents cell cycle arrest.
Oxidative stress is known to be a common cause of male infertility [Citation50–Citation52]. In both sexes, ROS and antioxidants imbalances affect the entire reproductive lifespan [Citation53]. Leydig cells from aged rats generate more ROS than cells from young rats [Citation54]. Aging in Leydig cells is always accompanied with reduction of several antioxidants, including glutathione peroxidase (GPX-1), glutathione (GSH), glutathione (GSH), and microsomal glutathione S-transferase (MGST1), thus elevating oxidative stress [Citation54,Citation55]. Study from Abidi et al. indicated that prolonged treatment with antioxidant vitamin E delayed age-related decreases in steroidogenesis, whereas deficiency of vitamin E had the opposite effect [Citation56]. However, mechanistic studies designed to go beyond correlation to establish a cause-and-effect relationships were scarcely reported, except for a gene knockout study in Nrf2 null mice. Males with deficiency of Nrf2, which regulated enzymes essential for antioxidation, showed age-related reduction of Leydig cell steroidogenic function and antioxidant capacity [Citation57]. Here, we uncovered a novel pathway that links oxidative stress, aging and steroidogenesis. We found that in mice testes and Leydig cells, the expression of BMI1 decreased with aging. Moreover, PTC-209-treated MLTC-1 and primary mouse Leydig cells displayed premature aging, exhibited by cell senescence, excessive oxidative stress and DNA damage. Aging associated phenotypes substantially contributed to the impaired steroidogenesis, since antioxidant NAC largely alleviated defects of BMI1-deficient MLTC-1 and primary mouse Leydig cells.
Previous findings have demonstrated that ROS induces the activation of DNA damage response [Citation40]. In the present study, we observed that DNA damage response occurred in PTC-209-treated MLTC-1 and primary mouse Leydig cells, which included marked accumulation of γ-H2AX and 8-OHdG, and cellular senescence and apoptosis. Our results were similar to those induced by redox imbalance [Citation23,Citation27,Citation42,Citation58], indicating that excessive ROS generation because of BMI1 deficiency activates DNA damage response in mouse MLTC-1 and Leydig cells.
NAC, an endogenous antioxidant, alleviates ROS generation by replenishing intracellular glutathione stores [Citation59]. In BMI1 null mice, NAC supplementation can slow organ aging and extend lifespan [Citation23]. In addition, in clinical trials, NAC significantly restores lung injury in patients with chronic obstructive pulmonary disease, couples with clearing ROS [Citation60,Citation61], which highlights potential benefit of ROS-directed therapy. Combined with these findings, our results delineate BMI1-ROS axis in steroidogenesis, and as such provide potential therapeutic targets in treatment of hypogonadism.
In conclusion, findings of this research reveal that impaired steroidogenesis in BMI1-deficent mouse MLTC-1 and Leydig cells is associated with ROS mediated cellular senescence and DNA damage, whereas these alterations are largely rescued by NAC supplementation. Therefore, BMI1 plays an essential role in promoting steroidogenesis by maintaining redox homeostasis.
Supplemental Material
Download Zip (637 KB)Disclosure statement
No potential conflict of interest was reported by the authors.
Additional information
Funding
Related Research Data
References
- Harman SM, Metter EJ, Tobin JD, et al. Longitudinal effects of aging on serum total and free testosterone levels in healthy men. Baltimore longitudinal study of aging. J Clin Endocrinol Metab. 2001;86(2):724–731.
- Mohr BA, Guay AT, O’Donnell AB, et al. Normal, bound and nonbound testosterone levels in normally ageing men: results from the massachusetts male ageing study. Clin Endocrinol (Oxf). 2005;62(1):64–73.
- Araujo AB, Esche GR, Kupelian V, et al. Prevalence of symptomatic androgen deficiency in men. J Clin Endocrinol Metab. 2007;92(11):4241–4247.
- Bhasin S, Basaria S. Diagnosis and treatment of hypogonadism in men. Best Pract Res Clin Endocrinol Metab. 2011;25(2):2251–70.
- Surampudi PN, Wang C, Swerdloff R. Hypogonadism in the aging male diagnosis, potential benefits, and risks of testosterone replacement therapy. Int J Endocrinol. 2012;2012:625434.
- Wu FC, Tajar A, Beynon JM, et al. Identification of late-onset hypogonadism in middle-aged and elderly men. N Engl J Med. 2010;363(2):123–135.
- Huhtaniemi IT. Andropause–lessons from the European male ageing study. Ann Endocrinol (Paris). 2014;75(2):128–131.
- Finkle WD, Greenland S, Ridgeway GK, et al. Increased risk of non-fatal myocardial infarction following testosterone therapy prescription in men. PLoS One. 2014;9(1):e85805.
- Vigen R, O’Donnell CI, Baron AE, et al. Association of testosterone therapy with mortality, myocardial infarction, and stroke in men with low testosterone levels. JAMA. 2013;310(17):1829–1836.
- Xu L, Freeman G, Cowling BJ, et al. Testosterone therapy and cardiovascular events among men: a systematic review and meta-analysis of placebo-controlled randomized trials. BMC Med. 2013;11(1):108.
- Bosland MC. Testosterone treatment is a potent tumor promoter for the rat prostate. Endocrinology. 2014;155(12):4629–4633.
- Pavlovich CP, King P, Goldstein M, et al. Evidence of a treatable endocrinopathy in infertile men. J Urol. 2001;165(3):837–841.
- Ramasamy R, Stahl PJ, Schlegel PN. Medical therapy for spermatogenic failure. Asian J Androl. 2012;14(1):57–60.
- Kaprara A, Huhtaniemi IT. The hypothalamus-pituitary-gonad axis: tales of mice and men. Metabolism. 2018;86:3–17.
- Miller WL, Bose HS. Early steps in steroidogenesis: intracellular cholesterol trafficking. J Lipid Res. 2011;52(12):2111–2135.
- Rone MB, Fan J, Papadopoulos V. Cholesterol transport in steroid biosynthesis: role of protein-protein interactions and implications in disease states. Biochim Biophys Acta. 2009;1791(7):646–658.
- Biehs B, Hu JK, Strauli NB, et al. BMI1 represses Ink4a/arf and hox genes to regulate stem cells in the rodent incisor. Nat Cell Biol. 2013;15(7):846–852.
- Li B, Chen Y, Wang F, et al. BMI1 drives hepatocarcinogenesis by repressing the TGFbeta2/SMAD signalling axis. Oncogene. 2020;39(5):1063–1079.
- Park IK, Morrison SJ, Clarke MF. BMI1, stem cells, and senescence regulation. J Clin Invest. 2004;113(2):175–179.
- Molofsky AV, Pardal R, Iwashita T, et al. Bmi-1 dependence distinguishes neural stem cell self-renewal from progenitor proliferation. Nature. 2003;425(6961):962–967.
- Park IK, Qian D, Kiel M, et al. Bmi-1 is required for maintenance of adult self-renewing haematopoietic stem cells. Nature. 2003;423(6937):302–305.
- Zhang HW, Ding J, Jin JL, et al. Defects in mesenchymal stem cell self-renewal and cell fate determination lead to an osteopenic phenotype in Bmi-1 null mice. J Bone Miner Res. 2010;25(3):640–652.
- Jin J, Lv X, Chen L, et al. Bmi-1 plays a critical role in protection from renal tubulointerstitial injury by maintaining redox balance. Aging Cell. 2014;13(5):797–809.
- Huang Y, Chen N, Miao D. Biological effects of pyrroloquinoline quinone on liver damage in Bmi-1 knockout mice. Exp Ther Med. 2015;10(2):451–458.
- Wang R, Xue X, Wang Y, et al. BMI1 deficiency results in female infertility by activating p16/p19 signaling and increasing oxidative stress. Int J Biol Sci. 2019;15(4):870–881.
- Bracken AP, Kleine-Kohlbrecher D, Dietrich N, et al. The polycomb group proteins bind throughout the INK4A-ARF locus and are disassociated in senescent cells. Genes Dev. 2007;21(5):525–530.
- Liu J, Cao L, Chen J, et al. BMI1 regulates mitochondrial function and the DNA damage response pathway. Nature. 2009;459(7245):387–392.
- Dai X, Zhang Q, Yu Z, et al. BMI1 deficient mice exhibit male infertility. Int J Biol Sci. 2018;14(3):358–368.
- Zheng B, Zhou Q, Guo Y, et al. Establishment of a proteomic profile associated with gonocyte and spermatogonial stem cell maturation and differentiation in neonatal mice. Proteomics. 2014;14(2–3):274–285.
- Zheng B, Yu J, Guo Y, et al. Cellular nucleic acid-binding protein is vital to testis development and spermatogenesis in mice. Reproduction. 2018;156(1):59–69.
- Shen C, Yu J, Zhang X, et al. Strawberry Notch 1 (SBNO1) promotes proliferation of spermatogonial stem cells via the noncanonical Wnt pathway in mice. Asian J Androl. 2019;21(4):345–350.
- Shen C, Zhang K, Yu J, et al. Stromal interaction molecule 1 is required for neonatal testicular development in mice. Biochem Biophys Res Commun. 2018;504(4):2111–2135.
- Zhao D, Shen C, Gao T, et al. Myotubularin related protein 7 is essential for the spermatogonial stem cell homeostasis via PI3K/AKT signaling. Cell Cycle. 2019;18(20):2800–2813.
- Zheng B, Zhao D, Zhang P, et al. Quantitative proteomics reveals the essential roles of stromal interaction molecule 1 (STIM1) in the testicular cord formation in mouse testis. Mol Cell Proteomics. 2015;14(10):2682–2691.
- Zhang B, Ma W, Zhu Q, et al. The SET protein promotes androgen production in testicular Leydig cells. Andrology. 2018;6(3):478–487.
- Xu W, Zhu Q, Liu S, et al. Calretinin participates in regulating steroidogenesis by PLC-Ca(2+)-PKC pathway in Leydig cells. Sci Rep. 2018;113(1):7403.
- Mendoza-Villarroel RE, Robert NM, Martin LJ, et al. The nuclear receptor NR2F2 activates star expression and steroidogenesis in mouse MA-10 and MLTC-1 Leydig cells. Biol Reprod. 2014;914(1):26.
- Kong Y, Ai C, Dong F, et al. Targeting of BMI-1 with PTC-209 inhibits glioblastoma development. Cell Cycle. 2018;17(10):1199–1211.
- Zhu S, Zhao D, Li C, et al. BMI1 is directly regulated by androgen receptor to promote castration-resistance in prostate cancer. Oncogene. 2020;39(1):17–29.
- Lombard DB, Chua KF, Mostoslavsky R, et al. DNA repair, genome stability, and aging. Cell. 2005;120(4):497–512.
- Staples CJ, Barone G, Myers KN, et al. MRNIP/C5orf45 interacts with the MRN complex and contributes to the DNA damage response. Cell Rep. 2016;16(10):2565–2575.
- Yin Y, Xue X, Wang Q, et al. BMI1 plays an important role in dentin and mandible homeostasis by maintaining redox balance. Am J Transl Res. 2016;8(11):4716–4725.
- Molofsky AV, He S, Bydon M, et al. Bmi-1 promotes neural stem cell self-renewal and neural development but not mouse growth and survival by repressing the p16Ink4a and p19Arf senescence pathways. Genes Dev. 2005;19(12):1432–1437.
- Ignatiadis M, Azim HA Jr., Desmedt C, et al. The genomic grade assay compared with Ki67 to determine risk of distant breast cancer recurrence. JAMA Oncol. 2016;2(2):217–224.
- Bruggeman SW, Valk-Lingbeek ME, van der Stoop PP, et al. Ink4a and Arf differentially affect cell proliferation and neural stem cell self-renewal in BMI1-deficient mice. Genes Dev. 2005;19(12):1438–1443.
- Chagraoui J, Hebert J, Girard S, et al. An anticlastogenic function for the polycomb group gene BMI1. Proc Natl Acad Sci U S A. 2011;108(13):5284–5289.
- Wang H, Wang L, Erdjument-Bromage H, et al. Role of histone H2A ubiquitination in polycomb silencing. Nature. 2004;431(7010):873–878.
- Zhou Y, Wang L, Vaseghi HR, et al. BMI1 is a key epigenetic barrier to direct cardiac reprogramming. Cell Stem Cell. 2016;18(3):382–395.
- Banerjee Mustafi S, Aznar N, Dwivedi SK, et al. Mitochondrial BMI1 maintains bioenergetic homeostasis in cells. Faseb J. 2016;30(12):4042–4055.
- Tremellen K. Oxidative stress and male infertility–a clinical perspective. Hum Reprod Update. 2008;14(3):243–258.
- Clyne M. Male factor infertility: effects of ROS and vitamin E on sperm. Nat Rev Urol. 2012;9(2):62.
- Moustafa MH, Sharma RK, Thornton J, et al. Relationship between ROS production, apoptosis and DNA denaturation in spermatozoa from patients examined for infertility. Hum Reprod. 2004;19(1):129–138.
- Adeoye O, Olawumi J, Opeyemi A, et al. Review on the role of glutathione on oxidative stress and infertility. JBRA Assist Reprod. 2018;22(1):61–66.
- Chen H, Cangello D, Benson S, et al. Age-related increase in mitochondrial superoxide generation in the testosterone-producing cells of brown Norway rat testes: relationship to reduced steroidogenic function? Exp Gerontol. 2001;36(8):1361–1373.
- Cao L, Leers-Sucheta S, Azhar S. Aging alters the functional expression of enzymatic and non-enzymatic anti-oxidant defense systems in testicular rat Leydig cells. J Steroid Biochem Mol Biol. 2004;88(1):2682–2691.
- Abidi P, Leers-Sucheta S, Azhar S. Suppression of steroidogenesis and activator protein-1 transcription factor activity in rat adrenals by vitamin E deficiency-induced chronic oxidative stress. J Nutr Biochem. 2004;15(4):210–219.
- Chen H, Jin S, Guo J, et al. Knockout of the transcription factor Nrf2: effects on testosterone production by aging mouse Leydig cells. Mol Cell Endocrinol. 2015;409:113–120.
- Shao L, Li H, Pazhanisamy SK, et al. Reactive oxygen species and hematopoietic stem cell senescence. Int J Hematol. 2011;94(1):24–32.
- Small DM, Coombes JS, Bennett N, et al. Oxidative stress, anti-oxidant therapies and chronic kidney disease. Nephrology (Carlton). 2012;17(4):311–321.
- Bulacio RP, Anzai N, Ouchi M, et al. Organic anion transporter 5 (Oat5) urinary excretion is a specific biomarker of kidney injury: evaluation of urinary excretion of exosomal Oat5 after N-Acetylcysteine prevention of cisplatin induced nephrotoxicity. Chem Res Toxicol. 2015;28(8):1595–1602.
- Cazzola M, Calzetta L, Page C, et al. Influence of N-acetylcysteine on chronic bronchitis or COPD exacerbations: a meta-analysis. Eur Respir Rev. 2015;24(137):451–461.