
ABSTRACT
The Ran GTPase plays critical roles in multiple cellular processes including interphase nucleocytoplasmic transport and mitotic spindle assembly. During mitosis in mammalian cells, GTP-bound Ran (Ran-GTP) is concentrated near mitotic chromatin while GDP-bound Ran (Ran-GDP) is more abundant distal to chromosomes. This pattern spatially controls spindle formation because Ran-GTP locally releases spindle assembly factors (SAFs), such as Hepatoma Up-Regulated Protein (HURP), from inhibitory interactions near chromosomes. Regulator of Chromatin Condensation 1 (RCC1) is Ran’s chromatin-bound exchange factor, and RanBP1 is a conserved Ran-GTP-binding protein that has been implicated as a mitotic regulator of RCC1 in embryonic systems. Here, we show that RanBP1 controls mitotic RCC1 dynamics in human somatic tissue culture cells. In addition, we observed the re-localization of HURP in metaphase cells after RanBP1 degradation, consistent with the idea that altered RCC1 dynamics functionally modulate SAF activities. Together, our findings reveal an important mitotic role for RanBP1 in human somatic cells, controlling the spatial distribution and magnitude of mitotic Ran-GTP production and thereby ensuring the accurate execution of Ran-dependent mitotic events.
Abbreviations
AID: Auxin-induced degron; FLIP: Fluorescence loss in photobleaching; FRAP: Fluorescence recovery after photobleaching; GDP: guanosine diphosphate; GTP: guanosine triphosphate; HURP: Hepatoma Up-Regulated Protein; NE: nuclear envelope; NEBD: Nuclear Envelope Breakdown; RanBP1: Ran-binding protein 1; RanGAP1: Ran GTPase-Activating Protein 1; RCC1: Regulator of Chromatin Condensation 1; RRR complex: RCC1/Ran/RanBP1 heterotrimeric complex; SAF: Spindle Assembly Factor; TIR1: Transport Inhibitor Response 1 protein; XEE: Xenopus egg extract.
Introduction
Ran (Ras-related nuclear protein) is a small GTPase that controls multiple cellular processes, including nucleocytoplasmic transport, mitotic spindle assembly, cell-cycle progression and post-mitotic nuclear envelope (NE) assembly [Citation1]. Ran’s nucleotide-binding state is controlled by its cytoplasmic GTPase-activating protein, RanGAP1, and its chromatin-bound nucleotide exchange factor, RCC1. RanGAP1 and RCC1 are critical because Ran’s intrinsic rates of nucleotide hydrolysis and exchange are slow [Citation2]. During interphase, GTP-bound Ran (Ran-GTP) is concentrated within the nucleus where RCC1 is localized, while GDP-bound Ran (Ran-GDP) is predominant in the cytosol where RanGAP1 is dominant. This asymmetrical distribution drives nucleocytoplasmic trafficking through controlled cargo binding and release by Karyopherins, a family of Ran-GTP-binding proteins that mediate nucleocytoplasmic transport of proteins and RNAs [Citation3]. After mitotic NE breakdown (NEBD), RCC1 generates Ran-GTP near mitotic chromosomes, while the majority of Ran distal to chromosomes is GDP-bound [Citation4]. The presence of a mitotic Ran-GTP gradient directs proper spindle assembly by releasing spindle assembly factors (SAFs) from Karyopherins in a spatially regulated manner [Citation5].
RanBP1 is a Ran-GTP-binding protein found in many eukaryotes, including yeast and vertebrates, although not found in some invertebrate species, such as flies and worms [Citation1]. Within in vitro assays using purified proteins, RanBP1 stimulates RanGAP1’s activity roughly 10-fold [Citation6], and it promotes Ran-GTP release from Karyopherins, thereby further enhancing RanGAP1-activated GTP hydrolysis on Ran [Citation7,Citation8]. RanBP1 also forms a stable heterotrimeric complex with Ran and RCC1 in vitro (RRR complex), inhibiting RCC1’s nucleotide exchange activity [Citation6]. Xenopus laevis Egg Extracts (XEEs), a well-established ex vivo model system for cell-cycle studies, possess large amounts of free RCC1 protein because it is stockpiled in eggs to facilitate early development. RRR complex formation in XEEs is essential because it determines RCC1’s partitioning between its chromatin bound and soluble forms and inhibits the exchange activity of soluble RCC1 [Citation9]. On the other hand, there is less free RCC1 in somatic cells and most RCC1 localizes on or near chromosomes throughout mitosis in non-embryonic systems, raising the question of whether RRR complex formation has a significant impact on mitotic RCC1 dynamics outside of early development. Nevertheless, RanBP1 depletion by RNAi disrupts mitotic progression in mammalian tissue culture cells [Citation10,Citation11]. Notably, the dynamics for chromosome-bound mammalian RCC1 are not uniform as tissue culture cells progress through mitosis, with higher rates of exchange prior to anaphase onset [Citation12]. Because the mechanisms that modulate mitotic RCC1 chromatin association in somatic cells have not been well characterized, we wondered whether RanBP1 might be important in this context and how it might control mitotic Ran-GTP gradients within somatic cells.
To understand the cellular roles of RanBP1 and particularly how it contributes toward the mitotic dynamics and regulation of RCC1 in mammalian cells, we systematically varied RanBP1 levels in human colorectal carcinoma tissue culture cells (HCT116 and DLD1) through overexpression or fusion with Auxin-induced degron (AID) tags. We observed that altering RanBP1 concentrations substantially altered RCC1 dynamics on metaphase chromosomes. Moreover, we found dramatic re-localization of the spindle assembly factor Hepatoma Up-Regulated Protein (HURP) during metaphase in direct correspondence to changes in RCC1 dynamics, confirming changes in Ran-GTP levels and SAF activity near chromosomes that correlate to the altered RCC1 behavior. Together, our findings reveal an important mitotic role in human somatic cells for RanBP1 in controlling RCC1 dynamics and determining the accurate the spatial distribution and magnitude of the Ran-GTP gradients, thus ensuring the accurate execution of Ran-dependent mitotic events.
Materials and methods
Cell culture
Human colorectal carcinoma tissue culture cells HCT116 were cultured in McCoy’s 5A (ATCC) supplemented with heat-inactivated 10% FBS (Atlanta Biologicals) and antibiotics (100 IU/ml penicillin and 100 μg/ml streptomycin) in 5% CO2 atmosphere at 37°C. Human colorectal carcinoma tissue culture cells DLD-1 were cultured in DMEM (Life Technologies) supplemented with heat-inactivated 10% FBS (Atlanta Biologicals), antibiotics (100 IU/ml penicillin and 100 μg/ml streptomycin) and 2 mM GlutaMAX (Life Technologies) in 5% CO2 atmosphere at 37°C.
Plasmid construction
CRISPR/Cas9 gene-editing technique was utilized to tag genes at their endogenous loci. All gRNA plasmids were generated with the following primers ordered from IDT, according to CRISPR Design Tools (http://crispr.mit.edu:8079 and https://figshare.com/articles/CRISPR_Design_Tool/1117899). RanBP1: 5ʹ-caccgATGATCATGCCGAAAAAG-3ʹ, 5ʹ- aaacCTTTTTCGGCATGATCATc-3ʹ, 5ʹ-caccgATCATGCCGAAAAAGTGG-3ʹ, 5ʹ- aaacCCACTTTTTCGGCATGATc-3ʹ; RCC1: 5ʹ-caccGACACAGATAAGACCACA-3ʹ, 5ʹ- aaacTGTGGTCTTATCTGTGTC-3ʹ, 5ʹ-caccgCTTATCTGTGTCCAGCGG-3ʹ, 5ʹ- aaacCCGCTGGACACAGATAAGc-3ʹ. RanGAP1: 5ʹ-caccgGGATTCCAGGGCGCTGTTGGG-3ʹ, 5ʹ-aaacCCCAACAGCGCCCTGGAATCCc-3ʹ, 5ʹ-caccgTGACCCCTCTTTCCCCGCAGG-3ʹ, 5ʹ- aaacCCTGCGGGGAAAGAGGGGTCAc-3ʹ. Tubulin 1A: 5ʹ-aaacCCCAACAGXXXXXXGAATCCc-3ʹ, 5ʹ-caccgTGACCCCXXXXXXCAGG-3ʹ, 5ʹ- aaacCCTGCGGGXXXXAGAGGGGTCAc-3ʹ. Annealed gRNA duplexes were ligated into pX330 (Addgene #42230) vector according to Zhang Lab General Cloning Protocol [Citation13]. pEGFP-N1 vector (Clontech) was used to generate a backbone donor vector (pCassette) to introduce desired DNA sequences into CRISPR/Cas9-cleaved genomic regions via homology-mediated recombination: pEGFP-N1 vector was cut by Nhe1 and Not1 (NEB), and a new multiple cloning site was inserted to replace the sequences for CMV promoter and EGFP protein. The sequences of corresponding homology arms were amplified from genomic DNA extracted from HCT116 and DLD1 cells. TIR1 sequence was amplified by PCR from plasmid pBABE TIR1-9Myc (Addgene #47328) [Citation14]. DNA sequences corresponding to codon regions of NeonGreen fluorescent protein, minimal functional AID tag (68 amino-acid) [Citation15] and micro-AID degron (44 amino-acid) [Citation16] were codon-optimized and synthesized by IDT company. All PCR reactions were performed using Hi-Fi Taq (Invitrogen) or Herculase II Fusion (Agilent) DNA polymerases.
Transfection and construction of cell lines
Ten thousand cells/well were plated in 12-well plates a day before transfection. Plasmids for transfection were purified using the NucleoSpin buffer set (Clontech) and VitaScientific columns. Plasmids were not linearized before transfection. Cells were transfected with 500 ng of donor and gRNA plasmids in ratio 1:1 using ViaFect (Promega) transfection reagent according to the manufacturer’s instruction. Cells were seeded on 10-cm dishes with the selective antibiotics (hygromycin 200 μg/ml, blasticidin 10 μg/ml, zeocin 10 μg/ml or puromycin 3 μg/ml) in complete medium after 72 hours post-transfection and cultured until clones were visualized on a plate. Clones were picked and propagated in regular complete media without selective antibiotics.
To establish DLD1 or HCT116 cell lines that stably express TIR1 ligase at low levels, genomic loci corresponding to either RCC1 (Gene ID: 1104) or Ran-binding protein 1 (RanBP1, Gene ID: 5902) were chosen. To establish HCT116RanBP1-μAID and HCT116RanGAP1−3mAID cell lines, we first used CRISPR/Cas9 to tag the C-terminus of RCC1 with sequences encoding infra-red fluorescent protein (iRFP670, Addgene #45466) and TIR1-9Myc, separated by a P2A sequence. The RCC1iRFP670/P2A/TIR1−9xmyc fusion protein is cleaved during translation to yield RCC1iRFP670 and TIR1-9myc. Sequences encoding µAID and 3mAID were then added using CRISPR/Cas9 to RanBP1 or RanGAP1 genomic loci, respectively. DLD1RanBP1-Neon−3mAID-FLAG was constructed similarly to HCT116RanBP1-μAID, starting from a DLD1 parental cell line and adding a Neon-3mAID-FLAG tag. For HCT116RCC1-μAID cells, we tagged the C-terminus of RanBP1 with sequences encoding P2A-TIR1-9Myc. The RanBP1P2A/TIR1/9xmyc fusion protein yields RanBP1 and TIR19xmyc. Sequences encoding µAID were then added to the RCC1 genomic locus.
We chose the genomic locus corresponding to Tubulin 1A (Gene ID: 7846) to establish HCT116 Tub>RanBP1 cell line. We tagged the C-terminus with the sequences encoding: P2A-RanBP1-P2A-antibiotic selection marker.
Genotyping
Cellular DNA was extracted with Wizard® Genomic DNA Purification Kit (Promega). For RanBP1-tagged cells, clones were genotyped by PCR for homozygous insertion of desired tags with primers: 5ʹ-CCCCCACTTTCAGATAGGCTG-3ʹ and 5ʹ-GGACAGGCCTGGACATACACC-3ʹ. For RCC1-tagged cells, clones were genotyped with primers: 5ʹ-GGGTGTGATGTCCACTCTC-3ʹ and 5ʹ-GTTAGGGACAGGAAAGGGGC-3ʹ. For RanGAP1-tagged cells, clones were genotyped with primers: 5ʹ-GATATTGAGGGCAACAACAGCCAG-3ʹ and 5ʹ-CCGAGACTATCCCGCTTTCAGTGAG-3ʹ. For TUB1A-tagged cells, clones were genotyped with primers: 5ʹ-GCTGGAAATAGAGCTTGCTCTG-3ʹ and 5ʹ-AATCTGGACACCAGCCTG-3ʹ.
Time-lapse fluorescence microscopy
DLD1 cells were grown on 4-well glass-bottom chambers (Ibidi) for 2–3 d, then imaged on the Eclipse Ti2 inverted microscope (Nikon), equipped with an Ultraview spinning disk confocal system (Ultraview Vox Rapid Confocal Imager; PerkinElmer) and controlled by Volocity software (PerkinElmer) utilizing Nikon CFI60 Plan Apochromat Lambda 60x/1.4 oil immersion objective lens with D-C DIC slider 60x II, and 40x/1.3 oil Nikon PlanFluor immersion objective lens. Cells were imaged in FluoroBrite DMEM (ThermoFisher) media. The microscope was equipped with temperature-, CO2- and humidity-controlled chamber that maintained 5% CO2 atmosphere and 37°C. NeonGreen fluorescent protein signals were excited with a 488-nm (20% of power was applied) laser line. A series of 0.5 µm optical sections were acquired. Images were captured and analyzed using Volocity (PerkinElmer) and Image J (National Institutes of Health) softwares. Images represent maximum intensity projections of entire z-stacks.
Mitotic analysis
Cells were imaged every 3 min. Z-stacks of 10-sections were acquired with 1 µm interval. Specific time points were recorded when nucleus starts losing its spherical shape and condensed chromatin started to move (nuclear envelope breakdown, NEBD), chromosomes aligned at the spindle equator (metaphase), or the onset of chromosomes-to-pole movement (anaphase). We also counted the number of lagging chromosomes during anaphase.
Crystal violet assay
Three thousand cells/well were plated in 96-well plates. Culture medium was removed and cells were washed with PBS at RT. Cells were then incubated with 0.5% crystal violet solution for 15 minutes. Cells were then gently washed with water 3 times (avoiding washing off cells). Ten percent acetic acid was then added to solubilize the stained cells by gentle agitation on orbital shaker. Absorbance was read at 570 nm.
Immunoprecipitation
Cells were grown on 15 cm culture dishes until 80% confluency. Cells were washed in PBS, harvested, pelleted down at 300 g for 5 min and lysed in lysing buffer (1X XB buffer (10 mM HEPES, pH 7.7, 100 mM KCl, 1 mM MgCl2, 0.1 mM CaCl2) containing 0.02% Digitonin and Protease inhibitors cocktail (Leupeptin, Pepstatin A and Chymostatin), 5 μg/ml each) by passing several times through 22 gauge needle, followed by centrifugation at 10 000 g for 5 min. Five percent of the supernatant of lysed cells was collected and boiled in 1X SDS sampling buffer (input) and the remaining supernatant was mixed with anti-HA magnetic beads (ThermoFisher) and rotated gently overnight at 4°C. Magnetic beads were then washed with TBS-T 3 times. The eluent was then boiled in 1X SDS sample buffer.
Immunofluorescence staining
Ten thousand cells were seeded on coverslips in 12-well plates and grown for 2 d. Cells were washed with PBS, pH 7.4 and then fixed with 4% paraformaldehyde in PBS at RT for 15 min. Cells were then permeabilized with 0.5% Triton X-100 for 10 min and then blocked with 10% horse serum for 30 min. The fixed cells were then stained by specific primary antibodies and AlexaFluor-conjugated secondary antibodies for 1 h at RT. The nuclei were visualized with Hoechst (Invitrogen). Images were acquired using an Olympus IX71 inverted microscope (Olympus America Incorporation), equipped with an Ultraview spinning disk confocal system (Ultraview ERS Rapid Confocal Imager; PerkinElmer) and controlled by Volocity software (PerkinElmer) utilizing an Olympus UPlanSApo 100x/1.4 oil objective. Analysis of images was performed by Volocity software (PerkinElmer). We measured the length of the spindle-associated HURP and the length of microtubules, stained with Tubulin. The length of HURP signal was then divided into that of Tubulin signal in each cell to obtain normalized spread of HURP signal on microtubules, and the data were then plotted and analyzed using Prism software. The significances in difference were analyzed by t test.
Protein extraction and Western blot
Pellets of HCT116 and DLD1 cells were resuspended and lysed in 2X Laemmli sample buffer at 98°C for 15 min. The lysed cells were then centrifuged at 117,000 g for 10 min at 16°C to remove insoluble material. SDS-PAGE and Western blotting were performed as described [Citation17]. The protein samples were separated using 4–20% SDS-PAGE or Bolt™ 8% Bis-Tris gels (Invitrogen) and then blotted onto PVDF membrane. The membrane was blocked in 5% nonfat milk for 1 h before incubation with the primary antibody overnight at 4°C. Then, membrane was rinsed and probed for 1 h with the secondary anti-mouse or anti-rabbit antibodies conjugated to HRP with dilution 1:10,000 in 5% nonfat milk for 1 h. Detection of the signal was performed using ChemiDoc Imaging System with ECL Prime Western Blotting substrate (GE Healthcare).
Antibodies
For Western blot analysis, specific primary antibodies against RanBP1 and HURP were purchased from Cell Signaling (#8780) and Bethyl (A300-853A) respectively. Antibodies against RCC1 and RanGAP1 were produced in rabbits using full-length recombinant RCC1 and RanGAP1 as antigens. Secondary HRP-conjugated anti-rabbit antibodies were purchased from Sigma-Aldrich. For immunostaining analysis, anti-mouse (A28175) and anti-rabbit (A11034) AlexaFluor-488 conjugated antibodies (Invitrogen); anti-mouse (A11004) and anti-rabbit (A11011) AlexaFluor-568 conjugated antibodies (Invitrogen); anti-mouse (A27042) AlexaFluor-680 conjugated antibodies (Invitrogen) were used.
Fluorescence Photobleaching (FRAP and FLIP)
HCT116 cell lines were cultured on 4-well glass-bottom chambers (Ibidi) with CO2 Independent Medium (Gibco) supplemented with heat-inactivated 10% FBS (Atlanta Biologicals) and antibiotics (100 IU/ml penicillin and 100 μg/ml streptomycin) at 37°C prior to analysis. Zeiss LSM 780 (Microscopy and Imaging Core, NICHD) confocal microscope with 633 nm laser line and 63x/1.4 Plan-Apochromat (o) objective lens was used for both FRAP and FLIP. Zeiss LSM 780 was equipped with thermal control unit so that the chamber temperature remained at 37°C throughout the entire experiment. For fluorescence recovery after photobleaching (FRAP) experiments, five images of the cell were captured prior to bleaching, the laser was focused to a diffraction-limited spot, and spot bleaching was performed with a single 20 ms stationary pulse. Thirty post-bleach images were captured over the subsequent 30 s. Fluorescent intensity of the ROI was normalized: Fn = (FROI-F0), where FROI is the measured fluorescence of the ROI, F0 is the background fluorescence. Relative fluorescent intensities were then calculated as F = Fni/Fn0, where Fn is the normalized fluorescent intensity at time 0 after photobleaching (Fn0) and at the given time point during the recovery phase (Fni). The data collected after photobleaching were processed using Prism software and plotted using “one-phase association model” with the only constraint given to the initial value (Y0), and the information regarding apparent t1/2 (t1/2app) and plateau was retrieved. The “immobile fraction” was calculated as Fi = ((F(max plateau)-F(plateau))/100-Fn0)*100, where F(max plateau) is the normalized fluorescent intensity of the asymptote (plateau of the one-phase decay model) of the fluorescence intensity of the region of the mitotic chromosomes in the same cell, opposite to the ROI.
For fluorescence loss in photobleaching (FLIP) experiments, five prebleach images of each cell were taken, and then 55 cycles of laser bleaching (20 ms) and imaging were performed. Signal intensities within the defined region of interest (chromosome and cytosol distal to chromosome) at different time points were determined. Fluorescent intensity of the ROI was normalized: Fn = (FROI-F0)/r, where FROI is the measured fluorescence of the ROI, F0 is the background fluorescence, r is the photobleaching rate (r = Fci/Fc0, where Fc is the measured fluorescence of the control region, i.e. the nucleus of the neighboring cell, before (Fc0) and after (Fci) photobleaching of the ROI). Relative fluorescent intensities were then calculated as F = Fni/Fn0, where Fn is the normalized fluorescent intensity at time 0 (Fn0) and at the given time point (Fni). The data collected after photobleaching were fit into “one phase decay” model using Prism software, and the information regarding apparent t1/2 (t1/2app) was retrieved.
Protein transport assay
The nuclear transport assay was adapted from the protocol outlined in Niopek et al. [Citation18]. RanBP1-AID cell lines were seeded on Ibidi µ-Slide four well glass bottom slides in complete DMEM media. Cells were then changed toFluoroBrite DMEM (ThermoFisher) media and transfected with 500 ng of NLS-mCherry-LEXY plasmid (pDN122) which was a gift from Barbara Di Ventura & Roland Eils (Addgene plasmid # 72655; RRID: Addgene_72655) using ViaFect (Promega) transfection reagent according to the manufacturer’s protocol. After transfection, cells were kept in the dark for 24 h prior to imaging. Imaging was conducted using the Eclipse Ti2 inverted microscope (Nikon), equipped with an Ultraview spinning disk confocal system (Ultraview Vox Rapid Confocal Imager; PerkinElmer), equipped with a chamber that maintains 5% CO2 atmosphere and 37°C, and controlled by Volocity software (PerkinElmer) utilizing Nikon CFI60 Plan Apochromat Lambda 60x/1.4 oil immersion objective lens with D-C DIC slider 60x II. NLS-mCherry-LEXY positive cells were first excited with a 561 nm (20% of power was applied) laser line with 30 ms exposure and imaged every 30 seconds for 10 minutes. Next, the cells were then exposed to 405-nm (20% of power was applied) laser line with 1 s exposure every 30 seconds to induce nuclear export of model substrate, which was monitored for 15 minutes. A 405-nm laser was then shut off to induce nuclear import of model substrate, which was monitored for 20 minutes. The cells were then exposed to 405-nm laser again to induce another round of nuclear export of model substrate for 15 minutes. During the course of the experiment, cells were imaged every 30 seconds using 561-nm laser to follow mCherry signal of the model substrate.
Image analysis was performed on Volocity (PerkinElmer) and ImageJ (National Institutes of Health) software with Time Series Analyzer V3 plugin and ROI Manager dialog box. We measured fluorescent intensity from three points in both the cytoplasm and the nucleus of each cell to obtain the average intensity. Adjusted nuclear and cytoplasmic values were then calculated by subtracting their respective average values by the value of the background (a point near each measured cell without fluorescent protein signal). Relative Fluorescence intensity was then calculated by the quotient of the adjusted fluorescence intensity divided by the sum of the adjusted nuclear and cytoplasmic values. Lastly, values were normalized by averaging the first 20 values obtained in the initial 10-min exposure to find an individualized normalization constant. This constant was subtracted by all of the values for its respective data set.
Results
RanBP1 modulates RCC1 chromatin binding in somatic mammalian cells
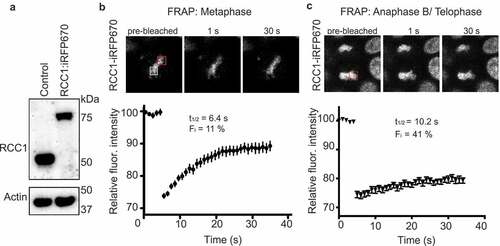
Previous examination of RCC1 dynamics on mitotic chromosomes in human tissue culture cells utilized overexpression of exogenous RCC1 fused to green fluorescent protein (RCC1-GFP) [Citation12,Citation19]. These reports concluded that RCC1 turnover rates vary through mitosis, being more rapid during metaphase and slower after the onset of anaphase. To determine whether RCC1 would behave the same way when expressed at endogenous levels, we employed CRISPR/Cas9 to biallelically insert sequences encoding an infrared red fluorescent protein tag (iRFP670) into the gene encoding RCC1 in HCT116 cells. We verified insertion using PCR (Sup. ,), and Western blotting showed that the resultant RCC1-iRFP670 fusion protein (RCC1iRFP670) migrated with a slower mobility on SDS-PAGE, as anticipated ()). To assess RCC1iRFP670 dynamics quantitatively, we used a Fluorescence Recovery After Photobleaching (FRAP)-based assay [Citation12], in which we bleached a region of the chromosomes and then monitored fluorescence recovery. By calculating the time of apparent half-maximal fluorescence recovery (t1/2app) and the immobile fraction (Fi) [Citation20] (,c)), we observed that endogenous chromatin-bound RCC1iRFP670 was highly mobile during metaphase (t1/2app = 6.4 ± 1.6 s; Fi = 11 ± 0.5%) and there was a marked decrease in its mobility during Anaphase B/telophase (t1/2app = 10.2 s; Fi = 41 ± 0.8%). These results are consistent with the earlier reports [Citation12], and support the conclusion that RCC1 is highly mobile on chromosomes during metaphase but undergoes a transition during anaphase toward significantly slower rates of chromatin turnover.
Figure 1. Dynamics of endogenous RCC1 on mitotic chromatin. (a) Western blotting with anti-RCC1 antibodies of parental HCT116 cells (left lane) and in cells in which endogenous RCC1 is tagged with iRFP670-P2A-TIR1 (second lane). Note the RCC1 mobility shift after insertion. Actin is shown as a loading control (lower panel). (b, c) Fluorescence Recovery after Photobleaching (FRAP) analysis of RCC1 in HCT116RCC1-iRFP670 cells during metaphase (b) or anaphase B/telophase (c). White square indicates the position of analyzed region. Red square indicates the region used for estimation of Fmax (see Materials and Methods). Results are expressed as an average from a total of 12 measurements recorded from 3–4 independent experiments. Note that RCC1 is highly mobile during metaphase.
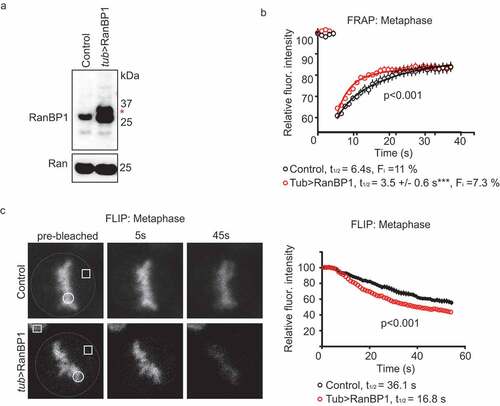
Increasing the concentration of Xenopus RanBP1 (xRanBP1) in metaphase XEE progressively reduces the concentration of Xenopus RCC1 (xRCC1) bound to chromatin [Citation9]. To test whether RanBP1 might modulate RCC1 dynamics on chromatin in somatic human cells, we employed CRISPR/Cas9 to develop cell lines wherein RanBP1 was stably over-expressed in HCT116 cells using the endogenous α-tubulin promoter (tub>RanBP1), and RCC1 was biallelically expressed from its endogenous locus as an RCC1iRFP670 fusion protein. RanBP1 overexpression in these cells was confirmed by PCR and Western blotting (); Sup. Figure 1c,d), and we used both FRAP and Fluorescence Loss in Photobleaching (FLIP) assays to assess endogenous RCC1 dynamics in the resultant cells during metaphase. In the FRAP assay, we observed faster rates of RCC1iRFP670 recovery on bleached chromosomes in the cells overexpressing RanBP1 (t1/2app = 3.5 ± 0.6 s; Fi = 7.3 ± 0.4%) than in control cells with unperturbed RanBP1 levels ()). In the FLIP assay, we constantly photobleached a region of the cell distal to chromosomes and monitored changes in chromosome-bound RCC1iRFP670 over time. We observed that the fluorescence intensity on chromosomes dropped faster in the cell line where RanBP1 is over-expressed than in control cells (t1/2app = 36 ± 3.6 s and t1/2app = 16.8 ± 1.5 s, respectively) ((c)). Results of the FRAP and FLIP assays both indicated that RanBP1 overexpression increases the dynamics of RCC1 exchange between metaphase chromosomes and cytoplasm.
Figure 2. Over-expression of RanBP1 increases RCC1 dynamics on chromatin during metaphase. (a) Western blotting with anti-RanBP1 antibodies of parental HCT116 cells (left lane) and cells in which RanBP1 is over-expressed by using endogenous alpha-tubulin promoter (tub>RanBP1, right lane). Ran is shown as a loading control (lower panel). (b) FRAP analysis of cells overexpressing RanBP1 (red). The graph representing dynamics of RCC1 in parental cells (black) is the same as shown in ). (c) Fluorescence Loss in Photobleaching (FLIP) analysis of cells, as in (B). White dash line outlines the mitotic cell, white square indicates the bleached region and white circle indicates the ROI. Yellow square denotes the position of control ROI in neighboring interphase cell, used for measuring nonspecific loss of fluorescence during experiment (Fc). Results are expressed as an average ± SEM from a total of 12 measurements recorded from 3–4 independent experiments. p < 0.001 (F test).
Regulation of RanBP1 levels using an Auxin-inducible degron (AID) degron tag
To ascertain how the loss of endogenous RanBP1 modulates RCC1 dynamics, we biallelically inserted sequences encoding an Auxin-inducible degron (AID) tag into the endogenous RanBP1 gene of HCT116 or DLD1 cells. In the presence of the TIR1 protein, an SCF ubiquitin ligase adaptor subunit, AID-tagged proteins are specifically recognized and ubiquitinated after the addition of the plant hormone Auxin, leading to rapid, tightly regulated proteasomal degradation of AID-tagged substrates [Citation14,Citation21,Citation22] ()). Two different AID tagging configurations were used for RanBP1: In the first, RanBP1 was tagged in HCT116 cells with sequences encoding one copy of a micro AID (μAID) and a HA tag (Sup. )). Successful biallelic tagging was confirmed by PCR (Sup. )). As predicted, the resultant RanBP1-μAID-HA fusion protein (RanBP1μAID-HA) migrates with a slower mobility on SDS-PAGE than untagged RanBP1 in HCT116 cells ()). In the second configuration, RanBP1 was tagged in DLD1 cells with sequences encoding a fluorescent protein (NeonGreen), three copies of a minimal AID and a FLAG tag (Sup. Figure 1e). Successful biallelic tagging was again confirmed by PCR (Sup. )) and Western blotting of the resultant RanBP1-Neon-3xminiAID-FLAG fusion protein (RanBP1Neon/3mAID/FLAG, Sup. Figure 2(a)). As anticipated, RanBP1Neon/3mAID/FLAG localized within the cytosol of interphase cells [Citation23] ((c)). Interestingly, RanBP1Neon/3mAID/FLAG concentrated on spindles during mitosis ((c), left column); this localization was different than the diffuse RanBP1 localization in mitotic DLD1 cells (Sup. Figure 2(e)) or NIH3T3 cells [Citation24], potentially reflecting different technical approaches (e.g., fixed versus live samples).
Figure 3. Depletion of RanBP1 using an Auxin-induced degron (AID) system. (a) A schematic diagram illustrating AID system. (b) Western blotting with anti-RanBP1 antibodies of parental HCT116 (control, left lane) and HCT116RanBP1-μAID/HA cells that were incubated without (middle lane) or with (right lane) 1 mM Auxin for 3 h. Note efficient degradation of RanBP1-µAID-HA upon Auxin addition. Actin is shown as a loading control (lower panel). (c) Images of DLD1RanBP1-Neon/3mAID/FLAG cells, in which both endogenous RanBP1 and RCC1 are tagged (RanBP1 is tagged with fluorescent protein (Neon), three copies of a minimal AID (3 x mini-AID) and a FLAG tag (RanBP1-Neon-3mAID-FLAG) and RCC1 is tagged with infrared fluorescent protein: RCC1-iRFP670::TIR1). Cells are shown before (left column) and after (right column) addition of 1 mM Auxin for 3 h. Note localization of RanBP1 to mitotic spindle. Scale bars = 10 μm.
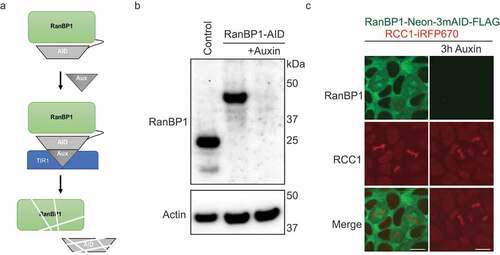
In cells with both configurations of RanBP1 tags, we used CRISPR/Cas9 to tag the C-terminus of RCC1 with sequences encoding iRFP670 and TIR1 separated by a P2A sequence, which confers autocatalytic cleavage between iRFP670 and TIR1. Nine copies of the Myc tag were also added on the C-terminus of TIR1. The RCC1-iRFP670-P2A-TIR1-9xmyc fusion protein cleaves to provide RCC1iRFP670 and TIR19xmyc, which is competent to degrade AID fusion proteins. The final cell lines will be called HCT116RanBP1-μAID/HA and DLD1RanBP1-Neon/3mAID/FLAG, respectively. Importantly, cell morphology and growth rates of both HCT116RanBP1-μAID/HA and DLD1RanBP1-Neon/3mAID/FLAG cells were similar to the HCT116 and DLD1 parental cells ()), Sup. Figure 2(b,c), indicating that the introduced tags were not deleterious to cell growth or viability. Western blotting showed that RanBP1μAID/HA was efficiently degraded within 3 hours of Auxin addition ()). RanBP1Neon/3mAID/FLAG was similarly degraded within 2 hours after the addition of Auxin, which was monitored by Western blotting or live imaging ((c); Sup. Figure 2(a,d)).
Figure 4. RanBP1 is dispensable for cell growth and nucleo-cytoplasmic transport of a model substrate. (a) Crystal violet assay of HCT116RanBP1-μAID/HA and parental HCT116 cells grown with or without Auxin (1 mM) for 4 d. Quantification of the number of cells are shown on the right. (b) Left: HCT116RanBP1-μAID/HA cells, expressing a model NLS-NES-containing substrate (NLS-mCherry-LEXY). In this system, exposure of cells to UV light induces nuclear export, while switching off light induces nuclear import. White circle indicates the region of fluorescent intensity measurements. Right: Quantification of nucleocytoplasmic transport in HCT116RanBP1-μAID/HA cells without (n = 6) and with 1 mM Auxin (n = 4). Note similar dynamics of both nuclear import and export in cells with or without RanBP1. N.s., non-significant (t-test).
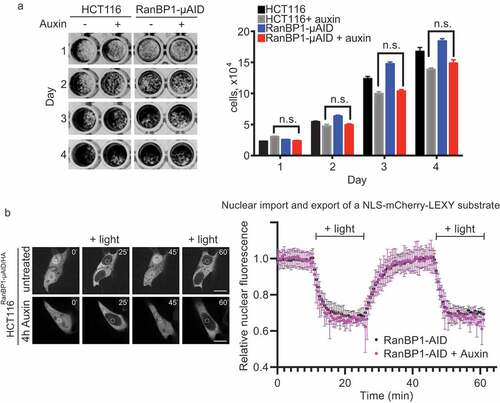
Both cell lines continued to grow in the presence of Auxin, suggesting that RanBP1 is not essential for HCT116 and DLD1 cell viability (), Sup. Figure 3A). The capacity of cells to grow without RanBP1 differs from previous reports wherein siRNA-mediated depletion of RanBP1 blocked mitotic progression in mammalian tissue culture cells [Citation10,Citation11]. This difference could either reflect differences between cell lines in their sensitivity to RanBP1 depletion or the different technical approaches used to deplete RanBP1. Importantly, our results indicating the capacity of HCT116 and DLD1 cells to survive without RanBP1 are consistent with the viability of RanBP1 knockout mice [Citation25].
We also quantitively assessed whether protein transport between nucleus and cytoplasm was affected in cells lacking RanBP1. We tested Importin-β dependent import and Crm1-dependent export using model substrate [Citation18]. Three hours after the Auxin addition, HCT116RanBP1-μAID/HA cells showed no detectable inhibition of both import and export ()). Our findings are consistent with earlier experiments that found no difference in nuclear import after RanBP1 depletion from HeLa cells by RNAi [Citation10]. Notably, these findings also indicate that any function of RanBP1 in activating RanGAP1 [Citation6] or promoting Ran-GTP release from Karyopherins [Citation7,Citation8] is either not essential in vivo or may be redundant with other mammalian proteins, such as RanBP2.
RanBP1 depletion suppresses RCC1 chromosome turnover during metaphase but not anaphase
We then examined how the loss of RanBP1 altered mobility of RCC1 on chromosomes within mitosis. To address this question, we again used FRAP- and FLIP-based assays to quantitatively assess endogenous RCC1iRFP670 dynamics in metaphase HCT116RanBP1-μAID/HA cells 3 hours after Auxin addition, when RanBP1μAID/HA had been fully degraded. In FRAP experiments, we observed the fluorescence intensity of bleached chromosomes recovered more slowly in Auxin-treated cells (t1/2app = 12.0 ± 3.1 s; Fi = 37 ± 0.9%) than in the absence of Auxin (t1/2app = 9.5 ± 1.6 s; Fi = 11.1 ± 0.8%) ()). Similarly, we observed in the FLIP assay that the RCC1iRFP670 fluorescence intensity on chromosomes dropped more slowly in the presence of Auxin than that in the absence of Auxin (t1/2app = 46.4 ± 6.1 s and t1/2app = 33.1 ± 3.0 s, respectively) ()). As before (), FRAP assays showed that RCC1 dynamics were slower after anaphase onset ((c)). Interestingly, these rates were similar between Auxin-treated and non-treated cells, indicating that RanBP1 concentrations do not determine RCC1 mobility during anaphase B/telophase.
Figure 5. Depletion of RanBP1 decreases RCC1 dynamics. (a) FRAP analysis of RCC1 dynamics on metaphase chromatin in HCT116RanBP1-μAID/HA cells expressing RCC1-iRFP670::TIR1 and RanBP1-µAID-HA treated with (blue) or without (black) 1 mM Auxin for 3 h. (b) FLIP analysis cells, as in (A). (c) FRAP analysis of RCC1 dynamics on chromatin during anaphase B/telophase. Results are expressed as an average from a total of 12 measurements recorded from 3 independent experiments. (significance was assessed by F test). (d) RanBP1 was immunoprecipitated from mitotic lysates of control or Auxin-treated HCT116RanBP1-μAID/HA cells that express RanBP1-µAID-HA and RCC1-iRFP670 using HA antibody. Proteins were separated by SDS-PAGE and analyzed by immunoblotting with antibodies against RCC1, RanBP1, Ran, HA and RanBP3. Total lysate of parental HCT116 cells is shown in the first lane, for comparison purposes. Note both efficient interaction of RCC1 and RanBP1 (lane 4) and its specificity (lane 5).
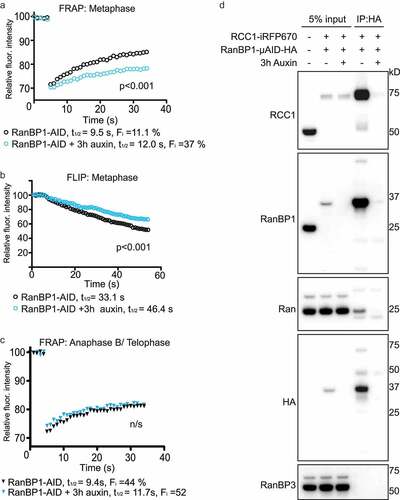
Notably, Auxin itself had no measurable effect on the mitotic progression of HCT116 cells that had been engineered to express RCC1-iRFP670-P2A-TIR1-9xmyc fusion protein without tagging of RanBP1, as we found no effect of this drug on either mitotic timing, percentage of chromosomal missegregation or RCC1 dynamics (Sup. Figure 3).
Together with the RanBP1 overexpression experiments (), our results consistently show that the turnover rate of chromosome-bound RCC1 in metaphase in human somatic HCT116 cells is correlated with RanBP1 concentrations. These findings indicate that RRR complex formation can control the partitioning of RCC1 between its chromatin-bound and soluble forms in somatic mammalian cells during metaphase, as it does in the embryonic XEE system. To verify that the RRR complex exists in somatic cells, we immunoprecipitated HA-RanBP1 from lysates of Nocodazole-arrested HCT116RanBP1-μAID/HA cells. Consistent with our prior observations in XEE system, we found that RanBP1 efficiently precipitated both Ran and RCC1 ()), strongly indicating that RanBP1, Ran and RCC1 are interacted to form RRR complex during mitosis, in both embryonic or somatic cell systems [Citation9].
We observed consistent changes in mitotic timing after RanBP1 depletion, with elongation of the time of the overall mitotic progression (from NEBD to anaphase onset) in both HCT116RanBP1-μAID/HA and DLD1-RanBP1Neon/3mAID/FLAG cells (), Sup. Figure 3F). Upon more detailed analysis, we observed that this phenotype was due to persisted delay of RanBP1-depleted cells in metaphase (,c)). These changes in timing were accompanied by an increase in the percentage of cells that showed the obvious presence of lagging chromosomes during anaphase (,e)). In contrast to the case of RanBP1 loss, HCT116 cells with RanBP1 overexpression displayed shortened NEBD-to-anaphase transition time ((f)). However, the detailed analysis revealed that this phenotype was due to the shortened timing that these cells spent during chromosome congression to the metaphase plate. Interestingly, RanBP1-overexpressed cells demonstrated no delay or acceleration of anaphase onset, and no changes in the levels of chromosome missegregation ((g-i)). Altogether, these results suggest that RanBP1 may have a role during the establishment of mitotic spindle apparatus. We hypothesized that disruption of mitotic gradient and RCC1 dynamics after RanBP1 perturbations might alter the Ran-GTP gradient, resulting in defects in either spindle assembly or mitotic checkpoint regulation.
Figure 6. RanBP1 regulates mitotic progression. In all results shown in panels A-F, 1 mM Auxin was added where indicated for 4 h before recording of the cells. (a) Timing of mitotic progression (NEBD to anaphase) of HCT116RanBP1-μAID/HA cells without (t = 33.48 ± 7.31 mins, n = 40) and with Auxin (t = 40.35 ± 15.10 mins, n = 40). (b) Timing of NEBD-to-metaphase without Auxin (16.65 ± 5.08 mins, n = 40) and with Auxin (14.33 ± 3.43 mins, n = 40). (c) Timing of metaphase-to-anaphase transition without (16.83 ± 5.99 mins, n = 40) and with Auxin (26.03 ± 14.98 mins, n = 40). (d) Quantification of percentage of lagging chromosomes in anaphases without (12.50 ± 3.42%, n = 40) and with Auxin (23.0 ± 5.60%, n = 40). (e) Images of HCT116RanBP1-μAID/HA cells before and after addition of Auxin. Note chromosome misalignments during metaphase and lagging chromosomes during anaphase after depletion of RanBP1. Scale bars = 10 μm. (f) Timing of NEBD-to-anaphase progression of control (HCT116) (t = 32.27 ± 6.90 mins, n = 41) and HCT116Tub>RanBP1 cells (t = 28.24 ± 5.32 mins, n = 41). (g) Timing of NEBD-to-metaphase of control (t = 14.10 ± 2.37 mins, n = 41) and HCT116Tub>RanBP1 cells (t = 11.49 ± 2.50 mins, n = 41). (h) Timing metaphase-to-anaphase of control (t = 18.15 ± 6.71 mins, n = 41) and HCT116Tub>RanBP1 cells (t = 16.76 ± 5.20 mins, n = 41). (i) Quantification of percentage of lagging chromosomes in anaphases of control (10.75 ± 2.99%, n = 41) and HCT116Tub>RanBP1 cells (10.00 ± 4.08%, n = 41). Bars indicate mean ± SD from more than 3 independent experiments. N.s., non-significant; * p < 0.05; ** p < 0.01; *** p < 0.001 (Mann–Whitney t test).
RanBP1 modulates spindle assembly factor HURP localization
To test this hypothesis, we wished to determine how RanBP1 depletion and other manipulation of the Ran gradient impact downstream SAFs. Using a strategy similar to the construction of HCT116RanBP1-μAID/HA cells, we employed CRISPR/Cas9 to produce cell lines, where the levels of RCC1 or RanGAP1 can be controlled by Auxin to this end, we tagged the C-terminus of RanBP1 with sequences encoding TIR1 separated by a P2A sequence, which confers autocatalytic cleavage between RanBP1 and TIR1. Nine copies of the Myc tag were also added on the C-terminus of TIR1. The RanBP1-P2A-TIR1-9xmyc fusion protein cleaves to provide RanBP1 and TIR19xmyc. Then, we introduced AID tag to C-terminus of RCC1 or RanGAP1, and the resultant cell lines will be called HCT116RCC1-μAID and HCT116RanGAP1−3mAID, respectively. Auxin treatment of these cells causes rapid (2–5 h) depletion of corresponding proteins and subsequent arrest of cell proliferation, as expected (Sup. -F).
We examined HCT116RanBP1-μAID/HA cells that had been incubated for 3 hours in the presence or absence of Auxin by immunofluorescent staining with antibodies against HURP (Sup. Figure 5a), an important Ran-regulated SAF [Citation26,Citation27] that is sensitive to RanBP1 loss [Citation11]. We observed a striking change in HURP staining, which we quantitated by assessing the extension of HURP from the plus end of the microtubule at the kinetochore along the spindle fibers. We expressed the change of HURP distribution as the ratio between this measurement and the total distance between the MT plus end and the centrosome. In untreated HCT116RanBP1-μAID/HA, HCT116RCC1-μAID and HCT116RanGAP1−3mAID cells, HURP localized to the central domain of the spindle (, b)), with HURP to tubulin ratios of 0.53, 0.58 and 0.53, respectively. Auxin treatment of HCT116RCC1-μAID cells caused the formation of substantially shorter spindles ()). At the same time, HURP relocalized from spindle fibers to cytosol, indicating that Ran-GTP generation is essential for its association with spindles (), Sup. Figure 5(b)). Loss of RCC1 also led to shortened mitotic timing, accompanied by increased chromosome errors in anaphase (Sup. Figure 5(c and d)). On the other hand, auxin treatment of HCT116RanGAP1−3mAID cells caused less dramatic changes in spindle morphology. Nonetheless, in RanGAP1-depleted cells HURP was distributed along the entire length of spindle fibers (HURP to Tubulin ratio = 0.96) ( and b)). These results indicate that HURP localization on metaphase spindles is proportional to the depth of the Ran-GTP gradient. Auxin-treated HCT116RanBP1-μAID/HA cells showed extended HURP staining in comparison to non-treated cells (HURP to Tubulin ratio = 0.78). This observation would be consistent with a deeper Ran-GTP gradient after RanBP1 depletion.
Figure 7. RanBP1 regulates mitotic HURP localization. (a) Immuno-staining with HURP and Tubulin antibodies in HCT116RCC1-µAID−3xFLAG, HCT116RanGAP1−3mAID and HCT116RanBP1-µAID-HA cells treated with or without 1 mM Auxin for 5, 2 and 3 h, respectively. White dashed lines represent the length of HURP signal (top row). Bottom: graphical representations of the expected distribution of the RanGTP gradient under indicated conditions. (b) Quantification of HURP signal normalized by Tubulin staining on the spindle in (A). Bars indicate mean ± SD from a total of 10 cells in more than 3 independent experiments. *** (p < 0.001, t-test). Scale bars = 10 μm.
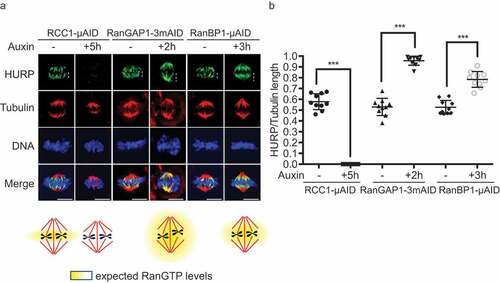
Together, these results indicate that HURP distribution along spindle fibers is sensitive to the dynamic range of the Ran-GTP gradient, with a response that is more analogous to rheostat than a simple switch. This behavior should make HURP and other SAFs particularly sensitive to modulations that could be produced through altering RanBP1 activity during mitotic progression through phosphorylation [Citation9] or degradation [Citation24].
Discussion
We have systematically altered RanBP1 levels in human colorectal carcinoma tissue culture cells through overexpression or fusion with Auxin-induced degron (AID) tags. After treating HCT116RanBP1-μAID/HA cells with Auxin, the cells remained viable in the absence of RanBP1, with rates of population doubling similar to Auxin-treated parental cells ()) and with no detectable difference in rates of nucleocytoplasmic transport of a model substrate ()). However, we observed that Auxin-treated HCT116RanBP1-μAID/HA and DLD1RanBP1-Neon/3mAID/FLAG cells progressed through mitosis more slowly than control cells (-d), Sup. Figure 3(f)), prompting us to examine the mitotic role of RanBP1 closely, particularly with respect to mitotic regulation of RCC1. We found that RCC1 showed greater mobility on chromatin in metaphase cells as RanBP1 levels increased, while showing reduced mobility when cells were depleted of RanBP1 ( and ). Moreover, localization of the Ran-dependent SAF HURP spread along metaphase spindle fibers toward spindle poles after RanBP1 depletion, consistent with the idea that stable association of active RCC1 to metaphase chromatin deepens Ran-GTP gradients (). The slower mitotic progression without RanBP1 may indicate that additional time is required for accurate spindle assembly when the Ran gradient is altered in HCT116 and DLD1 cells, but the apparently normal growth of HCT116RanBP1-μAID/HA and DLD1RanBP1-Neon/3mAID/FLAG cells in the presence of Auxin (), Sup. Figure 2B) argues that the RanBP1’s mitotic function is either not essential or can be bypassed through other means.
The Ran gradient is highly regulated during mitosis. Our data demonstrate that RanBP1 is important for control of RCC1 mitotic mobility. Notably, RCC1 becomes more dynamic in its association with chromatin with increasing levels of RanBP1. This finding is consistent with the idea that mammalian RCC1 is partitioned between its chromatin-bound and soluble form, with the latter being controlled by RRR complex assembly ()), reminiscent of the situation in XEE [Citation9]. During the late stages of mitosis in HeLa and U2OS cells, the dynamics of RCC1 chromatin exchange becomes slower [Citation12]. This was also true in HCT116 cells (). Moreover, we observed that RCC1 dynamics were influenced by changing concentrations of RanBP1 in metaphase but not telophase (,c); 5(a,c)), suggesting that the capacity of RanBP1 to mobilize RCC1 from mitotic chromatin may be lost as cells progress through this transition. RanBP1 is thus able to control RCC1 dynamics during mitosis, likely in conjunction with other mechanisms, such as N-terminal α-methylation [Citation28,Citation29] and mitotic phosphorylation by the CDK1/cyclin B kinase [Citation12,Citation19]. In addition, RanBP1 may also promote Ran-GTP hydrolysis through release from karyopherins [Citation7,Citation8] or enhancement of RanGAP1 activity [Citation6], although neither of these activities are required for interphase nuclear trafficking of a model NLS-NES substrate ()). However, similar to reduced RCC1 inhibition through RRR complex assembly after RanBP1 loss, reduced enhancement of RanGAP1 activity would be predicted to elevate Ran-GTP levels, consistent with observed changes in SAF activity ().
siRNA directed against RanBP1 causes a prolonged mitotic delay followed by apoptosis in U2OS cells [Citation11], while disrupted spindle assembly and checkpoint function were observed after RanBP1 depletion in HeLa cells [Citation10]. We do not observe either of these phenotypes after RanBP1 depletion from HCT116RanBP1-μAID/HA and DLD1RanBP1-Neon/3mAID/FLAG cells; this difference may reflect the alternative methods used for depletion or differences between the cell lines. However, the absence of a severe mitotic phenotype and capacity of HCT116RanBP1-μAID/HA and DLD1RanBP1-Neon/3mAID/FLAG cells to grow in the presence of Auxin (, Sup. Figure 3F) appears consistent with the fact that mice lacking RanBP1 are viable, albeit male infertile [Citation25]. As noted above, the multiple overlapping regulatory mechanism controlling mitotic Ran-GTP levels may provide sufficient compensation to allow mitosis to proceed successfully in at least some systems. This redundancy may also help account for the absence of RanBP1 in metazoan species like C. elegans and D. melanogaster [Citation1]. It is interesting to note that kinetochore composition can diverge extensively between metazoan species; for example, C. elegans and D. melanogaster both lack homologues of the CCAN complex found in other eukaryotes [Citation30]. We speculate that evolutionary pressures similar to those that prompted flies and worms to minimize the complexity of their kinetochores might have selected for simplification of mitotic Ran regulation through the loss of RanBP1. Alternatively, RanBP1’s capacity to shape Ran-GTP gradients may be required only under a limited set of physiological conditions, such as male gamete production [Citation25], explaining its evolutionary conservation despite the capacity of cells to survive in its absence. In this case, metazoan organisms lacking RanBP1 may have evolved adaptive mechanisms that bypass the requirements for RanBP1 during spermatogenesis.
Overall, our findings suggest while RanBP1 is not essential for either nuclear transport or cell proliferation in HCT116 and DLD1 cells, it is likely to promote accurate chromosome segregation through maintenance of optimal Ran-GTP gradients during mitosis in mammalian cells. This function would be important because chromosome mis-segregation leads directly to aneuploidy, the condition of having an imbalanced number of chromosomes, with significant consequences for human health [Citation31–Citation33]. Aneuploidy is a leading cause of mental retardation and spontaneous miscarriages, as well as being prevalent in both solid tumors and hematopoietic cancers. Interestingly, RanBP1 overexpression in breast cancers is associated with chromosome instability and poor patient prognosis [Citation34]. RanBP1 is also downregulated in aging cells [Citation35,Citation36], which show relatively shallow mitotic Ran-GTP gradients [Citation37]. Our results and these findings suggest the possibility that RanBP1 misregulation may contribute toward mitotic defects under some physiological conditions, potentially contributing toward their oncogenic potential.
In summary, we have assessed the cellular role of the RanBP1 protein, with a particular focus on its capacity to control the localization and activity of Ran’s nucleotide exchange factor, RCC1, during metaphase. Our findings suggest that while RanBP1 is not essential for cell proliferation, it plays an important role in fine-tuning spindle assembly through the Ran gradient ().
Figure 8. Graphic overview of how RanBP1 regulates mitotic HURP localization. RCC1 retains the ability to interact with chromosome in mitosis after nuclear envelope breakdown, catalyzing conversion of Ran-GDP to Ran-GTP near chromosomes. Interaction of RCC1 with chromosomes is dynamic, and cytosolic RCC1 is trapped into inactive RanBP1-Ran-RCC1 complex (RRR), which is also dynamic. Thus, RanBP1 concentrations control the amount of RCC1 on chromosomes and RanGTP production. Proteins of Importin α/β family bind and inhibit SAFs, a class of proteins promoting nucleation, formation and stabilization of spindle microtubule [Citation38], at low Ran-GTP concentrations throughout much of the mitotic cell. Near chromosomes, RCC1 generates an elevated concentration of Ran-GTP, locally disrupting inhibitory complexes and allowing full SAF activity.
![Figure 8. Graphic overview of how RanBP1 regulates mitotic HURP localization. RCC1 retains the ability to interact with chromosome in mitosis after nuclear envelope breakdown, catalyzing conversion of Ran-GDP to Ran-GTP near chromosomes. Interaction of RCC1 with chromosomes is dynamic, and cytosolic RCC1 is trapped into inactive RanBP1-Ran-RCC1 complex (RRR), which is also dynamic. Thus, RanBP1 concentrations control the amount of RCC1 on chromosomes and RanGTP production. Proteins of Importin α/β family bind and inhibit SAFs, a class of proteins promoting nucleation, formation and stabilization of spindle microtubule [Citation38], at low Ran-GTP concentrations throughout much of the mitotic cell. Near chromosomes, RCC1 generates an elevated concentration of Ran-GTP, locally disrupting inhibitory complexes and allowing full SAF activity.](/cms/asset/16da57ba-53c0-4263-b20a-d9c77a13e260/kccy_a_1782036_f0008_oc.jpg)
Supplemental Material
Download Zip (18.8 MB)Acknowledgments
These studies were supported by the Intramural Research Program of the Eunice Kennedy Shriver National Institute of Child Health and Human Development at the National Institutes of Health, USA (Intramural Project #Z01 HD008954).
Disclosure statement
The authors have no competing interests.
Supplemental material
Supplemental data for this article can be accessed here.
Additional information
Funding
Related Research Data
References
- Dasso M. The Ran GTPase: theme and variations. Curr Biol. 2002;12(14):R502–508.
- de Boor S, Knyphausen P, Kuhlmann N, et al. Small GTP-binding protein Ran is regulated by posttranslational lysine acetylation. Proc Natl Acad Sci U S A. 2015;112(28):E3679–3688.
- Stewart M. Molecular mechanism of the nuclear protein import cycle. Nat Rev Mol Cell Biol. 2007;8(3):195–208.
- Kalab P. Visualization of a Ran-GTP gradient in interphase and mitotic Xenopus egg extracts. Science. 2002;295(5564):2452–2456.
- Cavazza T, Vernos I. The RanGTP pathway: from nucleo-cytoplasmic transport to spindle assembly and beyond. Front Cell Dev Biol. 2015;3:82.
- Bischoff FR, Krebber H, Smirnova E, et al. Co-activation of RanGTPase and inhibition of GTP dissociation by Ran-GTP binding protein RanBP1. Embo J. 1995;14(4):705–715.
- Bischoff FR, Gorlich D. RanBP1 is crucial for the release of RanGTP from importin beta-related nuclear transport factors. FEBS Lett. 1997;419:249–254.
- Lounsbury KM, Macara IG. Ran-binding protein 1 (RanBP1) forms a ternary complex with Ran and karyopherin beta and reduces Ran GTPase-activating protein (RanGAP) inhibition by karyopherin beta. J Biol Chem. 1997;272:551–555.
- Zhang MS, Arnaoutov A, Dasso M. RanBP1 governs spindle assembly by defining mitotic Ran-GTP production. Dev Cell. 2014;31(4):393–404.
- Li HY, Ng WP, Wong CH, et al. Coordination of chromosome alignment and mitotic progression by the chromosome-based Ran signal. Cell cycle (Georgetown, Tex.). 2007;6(15):1886–1895..
- Tedeschi A, Ciciarello M, Mangiacasale R, et al. RANBP1 localizes a subset of mitotic regulatory factors on spindle microtubules and regulates chromosome segregation in human cells. J Cell Sci. 2007;120(21):3748–3761.
- Hutchins JRA, Moore WJ, Hood FE, et al. Phosphorylation regulates the dynamic interaction of RCC1 with chromosomes during mitosis. Curr Biol. 2004;14(12):1099–1104.
- Cong L, Ran FA, Cox D, et al. Multiplex genome engineering using CRISPR/Cas systems. Science. 2013;339(6121):819–823.
- Holland AJ, Fachinetti D, Han JS, et al. Inducible, reversible system for the rapid and complete degradation of proteins in mammalian cells. Proc Natl Acad Sci U S A. 2012;109(49):E3350–3357.
- Nishimura K, Kanemaki MT. Rapid depletion of budding yeast proteins via the fusion of an Auxin-Inducible Degron (AID). Curr Protoc Cell Biol. 2014;64:20.29.21–16.
- Morawska M, Ulrich HD. An expanded tool kit for the auxin-inducible degron system in budding yeast. Yeast. 2013;30:341–351.
- Blancher C, Jones A. SDS-PAGE and western blotting techniques. Methods Mol Med. 2001;57:145–162.
- Niopek D, Wehler P, Roensch J, et al. Optogenetic control of nuclear protein export. Nat Commun. 2016;7:10624.
- Li H-Y. Phosphorylation of RCC1 in mitosis is essential for producing a high RanGTP concentration on chromosomes and for spindle assembly in mammalian cells. Genes Dev. 2004;18(5):512–527.
- Neumuller RA, Richter C, Fischer A, et al. Genome-wide analysis of self-renewal in Drosophila neural stem cells by transgenic RNAi. Cell Stem Cell. 2011;8(5):580–593.
- Gray WM, Kepinski S, Rouse D, et al. Auxin regulates SCF(TIR1)-dependent degradation of AUX/IAA proteins. Nature. 2001;414:271–276.
- Nishimura K, Fukagawa T, Takisawa H, et al. An auxin-based degron system for the rapid depletion of proteins in nonplant cells. Nat Methods. 2009;6:917–922.
- Plafker K, Macara IG. Facilitated nucleocytoplasmic shuttling of the Ran binding protein RanBP1. Mol Cell Biol. 2000;20(10):3510–3521.
- Ciciarello M, Roscioli E, Di Fiore B, et al. Nuclear reformation after mitosis requires downregulation of the Ran GTPase effector RanBP1 in mammalian cells. Chromosoma. 2010;119:651–668.
- Nagai M, Moriyama T, Mehmood R, et al. Mice lacking Ran binding protein 1 are viable and show male infertility. FEBS Lett. 2011;585:791–796.
- Koffa MD, Casanova CM, Santarella R, et al. HURP is part of a Ran-dependent complex involved in spindle formation. Curr Biol. 2006;16(8):743–754.
- Sillje HH, Nagel S, Korner R, et al. HURP is a Ran-importin beta-regulated protein that stabilizes kinetochore microtubules in the vicinity of chromosomes. Curr Biol. 2006;16:731–742.
- Chen T, Muratore TL, Schaner-Tooley CE, et al. N-terminal alpha-methylation of RCC1 is necessary for stable chromatin association and normal mitosis. Nat Cell Biol. 2007;9:596–603.
- Tooley CE, Petkowski JJ, Muratore-Schroeder TL, et al. NRMT is an alpha-N-methyltransferase that methylates RCC1 and retinoblastoma protein. Nature. 2010;466(7310):1125–1128.
- van Hooff JJ, Tromer E, van Wijk LM, et al. Evolutionary dynamics of the kinetochore network in eukaryotes as revealed by comparative genomics. EMBO Rep. 2017;18(9):1559–1571.
- Bushman DM, Chun J. The genomically mosaic brain: aneuploidy and more in neural diversity and disease. Semin Cell Dev Biol. 2013;24:357–369.
- Sullivan AE, Silver RM, LaCoursiere DY, et al. Recurrent fetal aneuploidy and recurrent miscarriage. Obstet Gynecol. 2004;104(4):784–788.
- Weaver BA, Cleveland DW. The aneuploidy paradox in cell growth and tumorigenesis. Cancer Cell. 2008;14(6):431–433.
- Vaidyanathan S, Thangavelu PU, Duijf PH. Overexpression of Ran GTPase components regulating nuclear export, but not mitotic spindle assembly, marks chromosome instability and poor prognosis in breast cancer. Target Oncol. 2016;11:677–686.
- Ly DH, Lockhart DJ, Lerner RA, et al. Mitotic misregulation and human aging. Science. 2000;287:2486–2492.
- Pujol G, Soderqvist H, Radu A. Age-associated reduction of nuclear protein import in human fibroblasts. Biochem Biophys Res Commun. 2002;294(2):354–358.
- Hasegawa K, Ryu SJ, Kalab P. Chromosomal gain promotes formation of a steep RanGTP gradient that drives mitosis in aneuploid cells. J Cell Biol. 2013;200(2):151–161.
- Kalab P, Heald R. The RanGTP gradient - a GPS for the mitotic spindle. J Cell Sci. 2008;121(10):1577–1586.