
 ?Mathematical formulae have been encoded as MathML and are displayed in this HTML version using MathJax in order to improve their display. Uncheck the box to turn MathJax off. This feature requires Javascript. Click on a formula to zoom.
ABSTRACT
Solid tissues collected from patient-driven clinical settings are composed of both normal and cancer cells, which often precede complications in data analysis and epigenetic findings. The Purity estimation of samples is crucial for reliable genomic aberration identification and uniform inter-sample and inter-patient comparisons as well. Here, an effective and flexible method has been developed and designed to estimate the level of methylation, which infers tumor purity without prior knowledge from the other datasets. The comprehensive analysis of our approach on Illumina Infinium 450 k methylation microarray explains that TCGA Breast Cancer data exhibits improved performance for purity assessment. This assessment has a strong correlation with other advanced methods.
1. Introduction
DNA methylation is an epigenetic modification that plays a vital role in gene regulation, tumor growth, disease progression, and drug resistance induced by a family of DNA methyltransferases, which adds a methyl (CH3) group to the fifth position of cytosine [Citation1,Citation2]. Genomic methylation patterns in non-dividing somatic differentiated cells are generally stable and heritable. However, if the methylation patterns undergo significant changes, the phenotype may alter. DNA methylation patterns not only serve as essential cancer biomarkers and therapeutic targets but also provide insights into the mechanism of tumorigenesis and progression.
It has been observed in multiple types of cancer that some genes with promoter wide hypomethylation and hypermethylation are highly consistent in function. Hyper-methylation in promoter regions of tumor suppression genes is more recurrently discovered in various cancers. Promoter regions and promotor-specific hypermethylation are associated with overexpression in cancer and other diseases, which contributes the development and progression of cancer by regulating the gene expression patterns [Citation1,Citation4,Citation5]. The aberrant hypermethylation of CpG islands in promoter regions of genes that plays an essential role in the onset and progression of Breast cancer [Citation6]. Meanwhile, it is highly associated with human genomic features.
Global hypo-methylation was discovered in the development and progression of cancer through activations of oncogenes or the related pathway [Citation1]. Overall, the genome-wide scale tumor cells are prone to be hypermethylated in gene promoter regions and hypomethylated in gene body regions.
Tumor purity (TP) is the proportion of cancer cells in a tumor sample [Citation7]. Tumor tissues are not pure but contain unknown quantities of healthy cells. Uniform inter-sample and inter-patient comparisons of genomic profiles are possible due to tumor purity adjustments. It also provides a way to unmask sub-clonal effects [Citation8]. The samples collected from clinical settings are always a mixture of both cancer cells and normal cells, which often create complications of biased computational analysis. Erroneous findings can be generated if the admixture scenario is ignored.
Cancer-associated altered methylation exhibits profound deregulation of epigenetic transcription and promotes oncogenic pathways. DNA methylation pattern is divided into three categories according to the type of predicted target, i.e., for single CpG dinucleotide, for CpG island fragments, and for CpG island [Citation9]. Basically, aberrant DNA methylation is observed on global hypomethylation within CpG dense regions. CpG islands are located in gene promoters and closely related to the slicing of tumor suppressors [Citation10]. Differential methylated regions provide crucial insights into cancer biomarkers, progression, and tumor genesis infrastructure through variability analysis between cancer and normal samples.
To identify cancer subtype and purity assessment of tumors; analysis of global methylation patterns and differentially methylated regions is compelling and provides a way of alternative perception. For achieving relatively better performance of purity assessment, statistical variability study of frequently methylated CpG islands and CpG sites phenotype is used in methylation research.
There are a lot of emerging methods to estimate the tumor purity or the percentage of cancer cells in a solid tumor sample using gene expression, copy number variation, and methylation microarray data analysis. Because of extensive coverage across genome, low-cost Illumina’s 450 k array has been widely used in methylation studies and tumor purity estimation. But if methylation array, which is a mixture of cancer cells and adjacent normal tissues, stromal, and infiltrating immune cells are not correctly handled that could bias the downstream data analyses [Citation11].
Minfi is basically implemented for the differentially methylated region and it is not specialized for purity estimation of the sample. It is used for preprocessing, quality assessment, and detection of differentially methylated regions. The variance association of the methylation level of individual loci and continuous or categorical sites, minfi uses linear regression with F-test statistics [Citation12]. Minfi developed its algorithm based on average methylation and standard deviation (no coma) though the CpG. The CpG correlation is an important feature that cannot be ignored in methylation studies.
MethVisual allows the statistical and perceptive analysis of the methylation pattern. It also provides a method for inner relational visualization of neighboring and distant CpG. Moreover, Fisher’s exact test is applied to identify whether each CpG site has independent membership between the two groups [Citation13]. MethVisual uses Fisher exact test which is not adequate for a bigger sample size though the size of methylation Illumina’s 450 k array is huge.
Limma is designed for RNA sequencing and microarray analysis, and it is not explicitly intended for methylation arrays. Limma emphasizes each probe. It applies an empirical Bayes moderated t-test, which is an improved version t-test, except that the standard errors are handled in different manners [Citation14]. Though Limma fitted in complex models of RNA and microarray analysis, it required a larger sample size and does not show any significantly improved performance for a small sample size. In a previous study, it has been reported that there is a strong association between somatic copy number aberration,DNA methylation and gene expression [Citation3]. ESTIMATE method is a method based on the stromal and immune signature. The strength of this method is the association of different genomic data as copy number variation. ESTIMATE expressed the idea that gene expression signatures infer the fraction of admixture cells in tumor samples. ESTIMATE scores concordant with copy number variation-based tumor purity identification methods [Citation15]. But in this approach, we used Illumina 450 k as the density of the Illumina 450 k array is such large that it covers methylation to a reasonable degree.
PAMES [Citation16] extends purity estimation research not only on CpG sites but also gives more emphasis on the study of CpG islands. It also demonstrates the higher accuracy in a set of tumor data profiled in the previous studies. PAMES developed an approach on the basis of AUC score and only hypermethylated sites within 0.9 to 0.4 (0.9 < Beta < 0.4) and hypomethylated sites within 0.1 to 0.6 (0.1< Beta< 0.6) that have taken under consideration. It should be underlined that the threshold is completely relying on the data distribution of the dataset. So it is crucial to identify for each dataset [Citation17]. According to our experiments and dataset, we found that the beta value range can vary to 0.05 to 0.95.
Prior to this, DNA methylation – based on purity estimation was used by MethylPurify [Citation18] LUMP [Citation19] and InfiniumPurify [Citation20], which have a strong correlation between SCNA method’s estimated purity. MethylPurify assesses purity which is a method based on the idea of differentially methylated regions. MethylPurify is only applicable to WGBS or RRBS data. Another disadvantage of this method is that it only uses variance signal and ignores the mean signal when mean and variance signal both are a dominant factor in methylation studies.
LUMP (leukocytes unmethylation for purity) predicts the purity by averaging the methylation level (β values) of non-methylated immune-specific CpG sites. Contaminating adjacent normal cells is not measured by LUMP. It also shows considerably low tumor purity [Citation19].
According to InfiniumPurify [Citation20], methylation microarray data are highly correlated with tumor purity. The DNA methylation-based method calculates the purity by the distribution of the β values of differential DNA methylation sites. In InfiniumPurify, they only keep the DMP that has a variance greater than 0.005 in tumor samples than the control sample and use the Rank sum test, but when the difference between the groups is zero, the observations are discarded. Variance can differ in cancer type, but in this approach, the variance threshold is predefined for all cancer type.
In this method a new range of methylation beta value is established based on our dataset. In the previous studies, beta range was predefined to 0.1 to 0.9. But our analysis shows that it can extend to 0.05 to 0.95 which varies datasets to datasets. This method does not need any variance threshold to calculate the purity. The essence of mean, variance, and correlation statistics are also been taken in consideration. Including those advantages, we proposed a flexible approach to estimate tumor purity from Illumina Methylation 450 K data.
2. Methodology
The majority of DNA methylation studies of cancer-matched case–control study using tumor and normal adjacent tissues. It aims to find the cancer biomarkers which might be a trap. Molecular alterations presenting in both tumor and adjacent samples will not be identified as “abnormal” [Citation21]. BRCA (Breast invasive carcinoma) data from the TCGA and GEO tumor and normal pair are used to avoid the misinterpretation of the carcinogenic process. It is important to mention that the normal controls satisfy the criteria of age-matched cancer-free women.
Illumina methylation array asserts that the Beta-value is the ratio of the methylated probe intensity and the sum of methylated and unmethylated probe intensities. It can be varied 0 to 1; If the beta value is 0, there is no methylation at all; but if the value is 1, it is fully methylated. This phenomenon represented in . Beta value is convenient for biological interpretation, but statistically, M value is more significant to elaborate the statistical attributes.
Figure 1. Cell impurity on methylation perspective
In a study of tumor purity estimation and cancer subtype classification from DNA methylation data, Zhang used arcsine transformation. The reason behind this arcsine transformation is more linear in comparison to a beta value [Citation22].
M value can define as the log2 ratio of the intensities of the methylated probe versus the unmethylated probe. Since beta value, arcsine, and M value transformation have their own strengths and limitations. M-value is more preferable to use because it shows more significance in statistical interpretation [Citation23].
The detailed model of purity estimation from differential methylated sites from Illumina Infinium 450 k methylation data is depicted on . This model follows a matched case–control design. There are principally four steps in the proposed method.
Conversion of Beta Value to M value.
Normalized mean-variance Combined score calculation.
Rank the hypermethylated and hypomethylated CpG sites.
Purity estimation.
Figure 2. A model of purity estimation from methylation array using a mean-variance score-based statistical model
2.1 Conversion of beta value to M value
After consideration of individual strength of Beta, arcsine, and M value, M value has finally chosen for its additional statistical significance. transformation of the ratio of the methylated and unmethylated signal of each CpG sites modeled from EquationEquation (1)
(1)
(1) as follows:
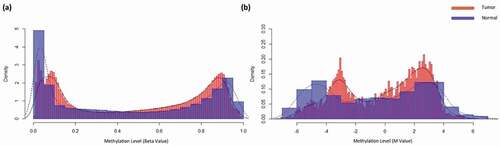
shows, the density comparison between normal samples beta value and M value against tumor samples. Converted beta value (M value) represented with associated information, A CpG object is constructed, which contains the CpG site’s id, beta value, chromosome, location, associated gene, and M value. The constructed object’s structures as follows:
Figure 3. Overall density distribution of methylation value of normal and tumor samples of TCGA BRCA. a) Density plot of normal sample and cancer samples beta value b) Density plot of normal sample and cancer samples M value
The constructed object contains all necessary information for additional filtering such as removal of CpG sites linked with X, Y chromosome, and CpG sites not separated from the threshold gap.
2.2 Normalized mean-variance combined score calculation
The distribution of stable CpG sites follows normal distribution on normal samples. Hence, for the normal distribution nature of the methylation data, parametric tests are used [Citation24]. To capture the significant statistical mean t-test is used between the normal and tumor sample group which is a type of inferential statistic. Though the only mean feature of methylation does not contain the variance attribute of methylation signal, the Pitman–Morgan test is used to capture the variance. Morgan–Pitman variance test incorporates correlation and ratio of variance which is crucial for the nature of methylation data [Citation25]. The classical Pitman – Morgan test is known to be optimal for testing equality of the variances of components of a bivariate normal vector. It is also optimal for a generalized model involving the spherical matrix distribution [Citation25]. Morgan – Pitman Test can be described from the equation (2) as follows:
The F-test is associated with the variance between the means of tumor and normal samples group. It was developed as an extension to the Z-test. The T-test, Morgan–Pitman test, and F-test have been combined to get the full essence of mean and variance statistics that discovers the significant CpG which was not identified on previous methods.
The mean-variance combined CpG score defined as:
EquationEquation (3)(3)
(3) provides the CpG score of each CpG site and
adds a positive or negative signature to the CpG score. It sets a signature, whether the concerned CpG site is hypermethylated or hypomethylated [Citation26]. A positive sign-on CpG score identified as hypermethylated CpG and negative sign on CpG score identified as hypomethylated CpG.
In EquationEquation (3)(3)
(3) , the site-level mean and variance signals score show different scale values. So, it is necessary to balance the contribution of signals to form the combined score. ∂ can be obtained from EquationEquation (4)
(4)
(4) as
∂ is the average parameter test statistics result across all sites from the whole genome, which provides an equal effect on each and single CpG combined score.
2.3 Rank hypermethylated and hypo-methylated CpG sites
Each CpG sites were ranked according to the CpG score. Due to the added signature either CpG score is positive or negative. Sorting in descending order sets the hypermethylated sites at the top of the list and hypomethylated sites at the bottom of the list. There are two conditions to meet to select the hyper or hypomethylated sites.
Firstly, The true methylation levels in most bins are similar between the two components and thus not informative to tumor purity inference or differential methylation analysis [Citation18]. The top-ranking CpG sites mapping within 300 bp from each other because the sequence surrounding a CpG site influences whether a CpG site is hypomethylated or hypermethylated [Citation27,Citation28]. To select informative sites threshold gap 300 bp is selected.
Secondly, after extensive analysis of density distribution methylation level of tumor sample against tumor samples that we imposed in the following methylation range is 0.05 to 0.95 as shown in . For the hypermethylated sites, we select the sites which methylation level (beta) is between 0.40 to 0.95 and for hypomethylated sites select the sites within the methylation level (Beta) of 0.05 to 0.60. To avoid the biased estimation, numbers of positive ranked CpG and negative ranked CpG were pre-defined on this method for the purity estimation. The outputs of this step are the indexes of hyper and hypo CpG sites which are used in the next level of the purity estimation method.
Figure 4. Differential density distribution of methylation level of tumor samples against normal samples showed deviation occurred within a range which establish the approximate range of differentially methylated sites of interest
2.4 Purity estimate
In previous steps, we determined the hypo/hyper-methylation status for all selected sites through combined scoring by mean and variance test of M value. M value is mapped with CpG sites, index of the site, Beta Value, and related genes. M value and beta value both related to tumor purity, for the next process of purity estimation previously described Beta Object is used.
Microarray beta-values were less dispersed than sequencing data but they all presented a rough bimodal profile [Citation29]. Beta values from differentially methylated positions follow a bimodal distribution location of the mode value is used to estimate purity [Citation20].
In both microarray and BS-seq data, a common characteristic can observe that the hypermethylated and hypomethylated sites showed a unimodal distribution which is approximately μ0+ μ1 = 1. It is solely based on real data observation. From the mapped index of previously identified high ranked differentially methylated CpG sites, the beta values for hypo-methylated converted to 1-β , and no transformation of beta value for hyper-methylated sites to transform into unimodal distribution from bimodal distribution.
The tumor purity of each sample is then estimated by:
According to EquationEquation (5)(5)
(5) , the tumor purity of each sample is then estimated by averaging the β for hyper-methylated sites and 1- β for hypo-methylated sites of the selected informative sites where n is the number of hypermethylated sites and m is the hypomethylated sites.
3. Results and discussion
3.1 Purity estimation
BRCA (Breast invasive carcinoma) tumor and normal data obtained from the TCGA and GEO, normal controls from age-matched cancer-free women. Before preprocessing the original dataset containing 485,578 CpG sites from 96 normal and cancer pairs, after preprocessing using standard quality control methods and finalize preprocessing with 381,240 CpG sites.
The M value is obtained from the log2 of the ratio of methylated intensity and unmethylated intensity which is used for statistical analysis and identification of the differentially methylated sites. Beta value is very useful for the interpretation of the result because the value range of methylation is 0 to 1 so Beta value is used for purity estimation. The methylation object contains the site id, location, chromosome, Beta value, and M value because of location, chromosome is used for the additional filtering process and M value is used for identification of differentially methylated sites and Beta value is used for purity estimation.
Identification of informative sites is one of the most vital steps of purity estimation. The only mean or variance test has not shown significant improvement in the identification of informative CpG sites. A combined score method is used to smooth the p-value score obtained from the two-sided standard paired T-Test, F Test, and Pitman–Morgan test. Theoretically , it provides a way to add a positive or negative signature to decide either the specific sites, a hypermethylated or hypomethylated site.
When we examined the distribution of Beta values of the tumor and normal sample, we observed a clear differentiation on tumor and normal sample on the range of 0.05< Beta < 0.95. For some tumor samples density distribution difference with normal samples shows on the range of 0.1< Beta < 0.9. For the flexibility concern, both criteria are used. Later on, we restricted our study of beta values on the range of 0.05< Beta < 0.95 for purity estimation.
Hypermethylated and hypomethylated sites are identified using four different settings. shows identified hypermethylated and hypomethylated sites using different parameters. Those settings are based on the previously explained ranges of beta value, and the number of CpG sites is concerned as a field of interest.
Table 1. Identified CpG sites using our proposed method with different settings and InfiniumPurify
After the selection of informative sites based on setting two, we identified 840 hypermethylated sites and 790 hypomethylated sites in total 1630 CpG sites, which show a much higher variance than normal samples from the top and bottom of the sorted list.
Hypomethylated CpG sites and hypermethylated CpG sites are obtained by mean variance score calculated from M value which is mapped with beta value. On account of identified CpG sites binomial distribution nature over the samples purity is calculated from , where
is the number of hypermethylated CpG sites and m is the number of hypomethylated CpG sites. The estimated purity of different TCGA BRCA samples and tumor purity calculated from InfiniumPurify, ABSOLUTE, PAMES, and LUMP method on supplementary TABLE 1.1.
shows the scatter plot estimated from our method against InfiniumPurify, ABSOLUTE, LUMP, PAMES for samples of BRCA. Predicted tumor purity compared to Infinium Purify shows a higher correlation (0.81) and the lower correlation with ABSOLUTE (0.65) and LUMP (0.48). The overall consistency of tumor purity among the proposed method and other states of art is quite high and satisfactory, so it can be interpreted as a formal justification of this proposed method, and it also provides a very accurate estimation of tumor purity.
Figure 5. Scatter plots showing a comparison of purities for TCGA BRCA tumor samples from our proposed method with InfiniumPurify, ABSOLUTE, PAMES and LUMP
3.2 Gene analysis from literature
Therefore, it has been observed that methylation has a strong association with overall risk, the prognosis of metastatic diffusion, tumor stage, hormone/growth receptor status, and clinical outcomes [Citation30,Citation31]. Each composite element CpG bound to some genes of a specific type, position, and chromosome. Identification of informative hyper and hypomethylated sites can provide a closer insight of suppressor and promoter region and gene body because they are directly involved in higher methylation measures of the tumor sample.
Differential expressed genes have more chances to be located near differentially methylated regions than CpG. In this study, we used bumphunter to find a differentially methylated region based on the calculated combined score. According to the combined score of each hyper and hypomethylated sites and differentially methylated regions, we identified a number of differentially methylated genes (DMG) including protein-coding, non-coding RNA genes and miRNA genes from our study.
The high methylation levels in candidate gene’s promoter regions are frequently observed in our analysis. CpG sites located in the differentially methylated regions mapped with genes such as DAPK1, P53, MDGI, DNMT, BRCA1, P15, RBM19, CCND1, PGR, SH3PXD2A, SYK, THBS1, MSH, PGR, PRKCDBP, APAF1, CALCA, FABP3, PAX5, RARB, RANKL, DNAJC15, RARß, BRCA2, HIN1, and CCND2 shows high combined signal score which interpreted as highly differentially methylated genes. We also found genes such as APC, RASSF1A, TWIST, ERα, CDH1, Cyclin D2, those genes have positive correlation with key variables such as tumor stage, hormone and growth receptor status, and a history of recurrent or metastatic disease [Citation32]. In previous studies, these genes proclaimed as have a strong influence over cancer development and also found in the DMG set.
Sites covered by differentially methylated regions and promoter regions also related to some miRNA genes. In this research, genes such as MIR449B; MIR449A, MIR124-3, MIR124-2, MIR124-2, MIR137, MIR184, MIR181 C, MIR520 C; MIR526A1, MIR129-2, MIR548 G, MIRLET7I are identified which resides on the differentially methylated regions.
Identified genes are involved in cell proliferation and apoptosis, p53 interactors, signaling kinases, drivers of tumor development. Those protein-encoding genes and miRNA genes are also introduced in other breast cancer studies. The first significant gene associated with hereditary breast cancer was BRCA1, located on chromosome 17. This gene was identified in 1990 using linkage analysis in families with suggestive pedigrees [Citation33]. In 1994, BRCA2 was mapped to chromosome 13 [Citation34]. A mutation in either BRCA1 or BRCA2 confers an increased risk of breast and other cancers. Large rearrangements and deletions in BRCA1 or BRCA2 can also alter the function of BRCA, resulting in an identical clinical syndrome to that seen in carriers of mutations in these genes [Citation35]. Death-associated protein kinase 1 (DAPK1) is an essential regulator of cell death and autophagy, which acts as a critical component in the ER stress-induced cell death pathway [Citation36].
Both p16 and p15, encoded by genes located on chromosome 9p21, are inhibitors of cyclin-dependent kinases 4/6 (CDK4/6) and upstream regulators of RB function and set up the RB/p16 tumor-suppressive pathway [Citation37]. The APC gene provides instructions for making the APC protein, which plays a critical role in several cellular processes. The APC protein acts as a tumor suppressor. The adenomatous polyposis coli (APC) gene is a crucial tumor suppressor gene [Citation38].
miRNAs regulated by CpG probes localized in island regions were involved in multiple pathways related to cancer, adherent junctions, estrogen signaling pathways, etc. MiR-124-2 was significantly overexpressed in BCVY samples (p-value < 0.05) compared with older patients. Important in methylation analysis, 38 miRNAs, and 5 of them presented different expressions (miR-196a-1, miR-184, miR-345, miR-212, and miR-211) [Citation31].
With the available literature assay’s identified protein and miRNA genes showed a higher percentile similarity with our proposed method. The number of pathway genes also found in our analysis, from the identified genes functionality, showed us those genes have a significant impact on cell proliferation and apoptosis, p53 interactors, signaling kinases, drivers of tumor development.
3.3 Gene set enrichment analysis of identified genes
The gene ontology and gene annotation of Homo sapiens were used to understand cellular components (CC), molecular function (MF), and biological process (BP) in breast cancer under the consideration of cutoff. Here, comprehensive analysis using gene ontology helped a better understanding of the molecular and biological relevance of the predicted genes. The GO enrichment was done by the DAVID database [Citation39]. The enriched GO terms of combined hypermethylated and hypomethylated genes are listed in supplementary Table 1.2 and supplementary Table 1.3. In addition to many terms with respect to developmental and biological regulation and several terms are directly related to cancer.
Kappa similarity score is also available in supplementary Table 1.4. Kappa results range from 0 to 1. The higher the value of Kappa, the stronger the agreement. If Kappa = 1, then there is perfect agreement [Citation40].
Deciphering gene-disease association is a crucial step in designing therapeutic strategies against diseases. Gene associated with the disease are shown in , the gene-disease association also identified from David bioinformatics resource (https://david.ncifcrf.gov/)
Table 2. Gene disease association
Individual tumors often have multiple genes from these pathways in a hypermethylated state, suggest that the sum of these methylation events provide an even stronger tumor-promoting force than DNA methylation occurred at single genes [Citation41]. Methylation events can lead to regulation and dysregulation of genes functioning in pathways. Top 6 KEGG pathways associated with identified are presented in .
Table 3. KEGG enriched pathways
Conclusion
The change of methylation can often lead to the development of cancer biomarkers and therapeutic. In cancer genomics, purity shows perplex effect in past several methylation studies, and purity of the sample often raises the complication of methylation analysis, so tumor purity estimation from the mixed sample became a field of interest.
There are a number of statistical and bioinformatics tools to calculate methylation status and purity. We have accorded an adequate and straightforward technique to provide tumor purity from varying samples without any prior knowledge of reference purity. The method is being used here, does not contradict with existing methods such as InfiniumPurify, LUMP, PAMES, or ABSOLUTE. On the other hand, it shows a high correlation with those methods with higher percentages of purity.
Although most of the recent studies of tumor purity based on tumor tissue used bisulfite sequencing data and Illumina Infinium assay to measure the methylation levels in selected regions. Beta value as methylation level is the most widely used to identify tumor purity but in here, we have introduced M value which extends the statistically significant of microarray data.
The mean, variance score-based approach that has been demonstrated is not a common practice; other purity analysis mostly depends on AUC, variance, or range of beta values. The expansion or logarithmic transformation of beta value improves the possibilities of identification of more differentially methylated sites that are not identified on other available methylation studies. Moreover, the method is also focused on tumor tissues, the use of this technique on the more highly heterogeneous sample is theoretically attainable.
As a result of conducting methylation analysis, it is assumed that the exploration of differentially methylated sites and islands, including protein and miRNA genes, could provide a direction to new targeted therapies and consideration of the development of epigenetics.
Furthermore, the joint model, including gene expression, copy number variation, methylation, mutation, and other genetic data, can improve the purity estimation performance and can provide better accuracy.
Supplemental Material
Download MS Word (95.3 KB)Disclosure statement
The authors declare that they have no conflict of interest.
Supplementary material
Supplemental data for this article can be accessed here.
Additional information
Funding
References
- Wang F, Zhang N, Wang J, et al. Tumor purity and differential methylation in cancer epigenomics. Brief Funct Genomics. 2016;15(6):408–419.
- Robertson KD. DNA methylation and human disease. Nat Rev Genet. 2005 Aug;6(8):597–610.
- Sun W, Bunn P, Jin C, et al. The association between copy number aberration, DNA methylation and gene expression in tumor samples. Nucleic Acids Res. 2018 Apr;46(6):3009–3018.
- Wong HK, Gibson H, Hake T, et al. Promoter-specific hypomethylation is associated with overexpression of PLS3, GATA6, and TWIST1 in the sezary syndrome. J Invest Dermatol. 2015 Aug;135(8):2084–2092.
- Jeong HM, Kwon MJ, Shin YK. Overexpression of cancer-associated genes via epigenetic derepression mechanisms in gynecologic cancer. Front Oncol. 2014 Feb;4:12.
- Lv J, Su J, Wang F, et al. Detecting novel hypermethylated genes in Breast cancer benefiting from feature selection. Comput Biol Med. 2010;40(2):159–167.
- Locallo A, Prandi D, Fedrizzi T, et al. TPES: tumor purity estimation from SNVs. Bioinformatics. 2019;35(21):4433–4435.
- Petralia F, Wang L, Peng J, et al. A new method for constructing tumor specific gene co-expression networks based on samples with tumor purity heterogeneity. Bioinformatics. 2018 Jul;34(13):i528–i536.
- Zhou X, Li Z, Dai Z, et al. Prediction of methylation CpGs and their methylation degrees in human DNA sequences. Comput Biol Med. 2012;42(4):408–413.
- Song M-A, Tiirikainen M, Kwee S, et al. Elucidating the landscape of aberrant DNA methylation in hepatocellular carcinoma. PLoS One. 2013 Feb;8(2):e55761.
- Maksimovic J, Gagnon-Bartsch JA, Speed TP, et al. Removing unwanted variation in a differential methylation analysis of Illumina Human Methylation 450 array data. Nucleic Acids Res. 2015;43(16). DOI:https://doi.org/10.1093/nar/gkv526
- Aryee MJ HK, Jaffe AE, Corrada-Bravo H, et al. Minfi: a flexible and comprehensive Bioconductor package for the analysis of Infinium DNA methylation microarrays. Bioinformatics. 2014;30:1363–1369.
- Zackay A, Steinhoff C. MethVisual - visualization and exploratory statistical analysis of DNA methylation profiles from bisulfite sequencing. BMC Res Notes. 2010 Dec;3(1):337.
- Matthew GKS, Ritchie E, Phipson B, et al. limma powers differential expression analyses for RNA-sequencing and microarray studies. Nucleic Acids Res. 2015 Apr; 43(7):e47.
- Yoshihara K, Shahmoradgoli M, Martínez E, et al. Inferring tumour purity and stromal and immune cell admixture from expression data. Nat. Commun. 2013 Dec;4(1):2612.
- Benelli M, Romagnoli D, Demichelis F. Tumor purity quantification by clonal DNA methylation signatures. Bioinformatics. 2018;34(10):1642–1649.
- Du P, Zhang X, Huang -C-C, et al. Comparison of Beta-value and M-value methods for quantifying methylation levels by microarray analysis. BMC Bioinformatics. 2010 Dec;11(1):587.
- Zheng X, Zhao Q, Wu H, et al. MethylPurify: tumor purity deconvolution and differential methylation detection from single tumor DNA methylomes. Genome Biol. 2014;15(8):419.
- Aran D, Sirota M, Butte AJ. Systematic pan-cancer analysis of tumour purity. Nat Commun. 2015;6:1–11.
- Zhang N, Wu HJ, Zhang W, et al. Predicting tumor purity from methylation microarray data. Bioinformatics. 2015;31(21):3401–3405.
- Wang Y, Qian M, Ruan P, et al. Detection of epigenetic field defects using a weighted epigenetic distance-based method. Nucleic Acids Res. 2019 Jan;47(1):1–13.
- Zheng X, Zhang N, Wu HJ, et al. Estimating and accounting for tumor purity in the analysis of DNA methylation data from cancer studies. Genome Biol. 2017;18(1):1–14.
- Xie C, Leung Y-K, Chen A, et al. Differential methylation values in differential methylation analysis. Bioinformatics. 2019 Apr;35(7):1094–1097.
- Bandyopadhyay S, Mallik S, Mukhopadhyay A. A Survey and comparative study of statistical tests for identifying differential expression from microarray data. IEEE/ACM Trans Comput Biol Bioinforma. 2014 Jan;11(1):95–115.
- Mudholkar GS, Wilding GE, Mietlowski WL. Robustness properties of the pitman–morgan test. Commun Stat - Theory Meth. 2003;32(9):1801–1816.
- Wang Y, Teschendorff AE, Widschwendter M, et al. Accounting for differential variability in detecting differentially methylated regions. Brief Bioinform. 2019 Apr:20(1):47–57.
- Ghorbani M, Themis M, Payne A. Genome wide classification and characterisation of CpG sites in cancer and normal cells. Comput Biol Med. 2016 Jan;68:57–66.
- Hodges E, Smith AD, Kendall J, et al. High definition profiling of mammalian DNA methylation by array capture and single molecule bisulfite sequencing. Genome Research. 2009;19(9):1593–1605.
- Nonell L, González JR. Are methylation beta-values simplex distributed? biorxiv. 2019.https://doi.org/https://doi.org/10.1101/753459.
- Ramazzotti D, Lal A, Wang B, et al. Multi-omic tumor data reveal diversity of molecular mechanisms underlying survival. bioRxiv. 2018;2018:267245.
- Oltra SS, Peña-Chilet M, Vidal-Tomas V, et al. Methylation deregulation of miRNA promoters identifies miR124-2 as a survival biomarker in Breast Cancer in very young women. Sci. Rep. 2018;8(1):1–12.
- Swift-Scanlan T, Vang R, Blackford A, et al. Methylated genes in breast cancer. Cancer Biol Ther. 2011;11(10):853–865. May.
- Hall JM, Lee M, Newman B, et al. Linkage of early-onset familial breast cancer to chromosome 17q21. Science. 1990;250(4988):1684–1689.
- Wooster R, Neuhausen SL, Mangion J, et al. Localization of a breast cancer susceptibility gene, BRCA2, to chromosome 13q12-13. Science. 1994;265(5181):2088–2090.
- Shiovitz S, Korde LA. Genetics of breast cancer: a topic in evolution. Ann Oncol. 2015;26(7):1291–1299.
- Gade DV, Manjegowda P, Nallar SB, et al. Regulation of the death-associated protein kinase 1 expression and autophagy via ATF6 requires apoptosis signal-regulating kinase. Mol Cell Biol. 2014;1(34):4033–4048.
- Shu-Xia Guoa Tomohiko Takia HYP, Ohnishia H. Hypermethylation of p16 and p15 genes and RB protein expression in acute leukemia. Leuk Res. 2000;24(1):39–46.
- Aoki K, Taketo MM. Adenomatous polyposis coli (APC): a multi-functional tumor suppressor gene. J Cell Sci. 2007;120(19):3327–3335.
- Huang DW, Sherman BT, Lempicki RA. Systematic and integrative analysis of large gene lists using DAVID bioinformatics resources. Nat Protoc. 2009 Jan;4(1):44–57.
- Huang DW, Sherman BT, Lempicki RA. Bioinformatics enrichment tools: paths toward the comprehensive functional analysis of large gene lists. Nucleic Acids Res. 2009 Jan;37(1):1–13.
- Pfeifer GP. Defining driver DNA methylation changes in human cancer. Int J Mol Sci. 2018;19(4):1–13.