
ABSTRACT
To explore mechanisms underlying the discrepancy in anti-tumor effects of metformin on pancreatic cancer cells PANC-1 under different glucose conditions. We cultured PANC-1 cells in 25 mM and 5 mM glucose media, then treated with or without metformin. It showed that metformin significantly inhibited proliferation and viability, induced apoptosis of PANC-1 cells, which was more pronounced in low-glucose than in high-glucose group. Metformin up-regulated the expression of miR-210-5p in low glucose, but not in high glucose. miR-210-5p mimic inhibited the viability of PANC-1 cells and further enhanced the inhibitory effect of metformin. miR-210-5p down-regulated the expression of PFKFB2, a predicted target gene of miR-210-5p, reduced the activity of PFK1 and LDH. Metformin significantly inhibited the expression of phosphorylation-PFKFB2(p-PFKFB2) in the low-glucose group and inhibited the LDH activity both in the low and high glucose groups, thus inhibiting anaerobic glycolysis and inducing energy stress. Cells in the high glucose group could make a compensatory adaptation to the energy stress induced by metformin through increasing glucose consumption. However, due to the limited glucose supply and high dependence on anaerobic glycolysis of cells in the low glucose group, they couldn’t make effective adaptive compensation. Therefore, cells in the low-glucose group were more vulnerable to the toxicity of metformin. In conclusion, the enhanced inhibitory effect of metformin on PANC-1 cells cultured in low glucose may be due to the up-regulation of the expression of miR-210-5p, then inhibiting anaerobic glycolytic flux and inducing energy stress via repressing the expression of p-PFKFB2 and activity of LDH.
Abbreviations
PC: pancreatic cancer; DM: diabetes mellitus; PFKFB2: 6-phosphofructo-2-kinase/fructose-2,6-bisphosphatase2; PFK1: phosphofructokinases; LDH: lactate dehydrogenase; F-2,6-BP: fructose 2,6-bisphosphate
Introduction
Pancreatic cancer (PC) remains the fourth leading cause of cancer death worldwide, with a 5-year survival less than 9% [Citation1]. It is generally believed that surgical resection is the only potentially curative treatment for PC patients [Citation2]. However, due to the occult and asymptomatic onset, more than half of PC patients were diagnosed at an advanced stage with distant metastasis [Citation1], thus losing the chance of radical operation. Therefore, early detection and effective treatment strategies are urgently needed to improve the high death rates and poor prognosis of this disease.
Diabetes mellitus (DM) is associated with an increased risk of a variety of cancers, including PC [Citation3,Citation4]. Hyperglycemia, hyperinsulinemia, and chronic inflammation are possible mechanisms that link DM and cancer [Citation5]. PC is particularly closely related to DM, as DM is not only a well-established risk factor of PC but also may be a consequence of PC [Citation6]. Up to 85% of patients with PC have impaired glucose tolerance or DM when they are diagnosed [Citation7]. A pooled analysis showed that the diagnosis of DM was associated with a 90% increase in the risk of PC (OR = 1.9, 95%CI 1.72–2.09), and the risk persisted even after two decades of diagnosis with DM (OR = 1.3, 95%CI 1.03–1.63) [Citation8]. According to a meta-analysis, the risk of PC increased 14% with per 0.56 mmol/L increase in fasting blood glucose [Citation9]. What’s more, not only DM itself but also some anti-diabetic drugs may have an impact on the risk of PC [Citation10,Citation11].
Metformin, one of the most commonly used anti-diabetic drugs, is currently considered as one of the promising anti-tumor drugs. Convincing data have shown that energy metabolism plays a vital role in the mechanism of metformin’s action in diabetes and cancer [Citation12]. Various mechanisms have been proposed, among which the inhibition of complex I and activation of AMP-activated protein kinase (AMPK) is generally accepted [Citation13–Citation15]. Some researchers have reported that the inhibition of mitochondrial respiration by metformin could result in energetic stress and a compensatory increase in glycolysis [Citation16,Citation17]. While other studies suggest that metformin might inhibit glycolysis via downregulating the expression of critical enzymes in the glycolytic pathway [Citation18,Citation19]. In vivo study has shown that activation of AMPK, a key regulator of energy homeostasis, could suppress tumor growth via inhibiting aerobic glycolysis [Citation20], supporting the possibility that metformin might inhibit glycolysis through activation of AMPK. Moreover, it has been suggested that cancer cells rely mostly on glycolysis for energy production rather than mitochondrial oxidative phosphorylation, which is widely known as “the Warburg effect” [Citation21–Citation25]. Therefore, inhibition or reversal of the Warburg effect might be a potential therapeutic method for the treatment of cancer [Citation26,Citation27]. Several studies have shown that the low glucose might enhance the anti-tumor effect of metformin on certain types of cancer cells, including ovarian cancer [Citation28,Citation29], thyroid cancer [Citation30] and breast cancer [Citation31,Citation32]. Thus, providing potential benefits of metformin for cancer patients without diabetes. However, the mechanisms underlying the discrepancy of the inhibitory effect of metformin on cells cultured in different concentrations of glucose remain poorly understood, especially on PC cells. Hence, a better understanding of the impact and mechanisms of metformin on the energy metabolism of PC cells cultured in different glucose conditions may lead to better and individualized treatments for cancer, with or without diabetes.
MicroRNAs (miRNAs), which are approximately 21- nucleotide-long noncoding RNAs, have emerged as vital post-transcriptional regulators of gene expression. A growing body of evidence has shown that miRNAs exert pivotal function in the development and progression of cancer and metabolic disorders by involvement in multiple cellular functions via repressing their target genes, thus showing potential therapeutic benefit [Citation33–Citation35]. Here, we show that the expression of miR-210-5p changed towards differently in PC cells cultured in high and low glucose conditions. Studies have shown that the expression of miR-210 is lower in PC tissues than those of para-cancerous tissues and is negatively correlated with tumor size and TNM stage of PC [Citation36]. What’s more, a higher expression of miR-210 is significantly associated with better survival of PC [Citation37]. Yet, little known is obtained about the function and mechanism of miR-210 and its isoform, miR-210-5p, on the growth of PC.
In this study, we intended to explore the different impacts of metformin on the growth of PC cells under low and high glucose conditions, as well as whether miR-210-5p and energy metabolic change is involved in the potential mechanisms.
Materials and methods
Cell culture
The human PC cell line PANC-1 was purchased from the National Infrastructure of Cell Line Resource, Beijing, China. PANC-1 cells were cultured in Dulbecco’s modified Eagle’s medium (DMEM) supplemented with high glucose (25 mM) or low glucose (5 mM) and 10% fetal bovine serum (FBS) at 37°C and 5% CO2 in a humidified incubator.
Cell proliferation assay
Cell proliferation was detected by a 5-ethynyl-2ʹ-deoxyuridine (EdU) incorporation assay using a Cell-LightTM EdU Cell Proliferation Assay Kit (RiboBio, Guangzhou, China) according to the manufacturer’s instructions. Briefly, PANC-1 cells were plated at a density of 5 × 10⁴ cells/mL in 96-well plates (Corning, New York, USA) for 24 h. The cells were treated with or without metformin (5/10/20 mM, Sigma-Aldrich, St. Louis, MO) for 48 h. After that, cells were incubated with 50 µM EdU for 2 h, washed with phosphate-buffered saline (PBS) and fixed with 4% formaldehyde for 30 min. Cell nuclei were stained with Hoechst 33,342 for 30 min in the dark and then washed twice with PBS. The cell proliferation rate was assayed with an Acumen X3 cytometer and calculated by dividing the number of proliferative cells by the number of total cells.
Cell viability assessment
PANC-1 cells were seeded at a density of 5 × 10⁴ cells/mL in 96-well plates for 24 h, and metformin (0/5/10/20 mM) was then added to each well. Cell viability was performed with Cell Counting Kit-8 (Dojindo, Japan) according to the manufacturer’s instructions. Briefly, PANC-1 cells were seeded into 96-well plates overnight at a density of 1 × 10⁵ cells per well in 100 μl of DMEM with 5 mM or 25 mM glucose. Cells were then treated with varying concentrations of metformin for 24 h, 48 h, 72 h. Then 10 µL of the CCK-8 solution was added to each well, and the cells were incubated at 37°C for 90 min. Then, the cell viability was quantified by detecting the absorbance value at 450 nm using a microplate absorbance reader (Multiskan; Thermo Fisher Scientific, Waltham, MA, USA).
Cell apoptosis assay
Cell apoptosis was assessed using the Annexin V, FITC Apoptosis Detection Kit (Dojindo, Japan), and flow cytometry according to the manufacturer’s instructions. Briefly, PANC-1 cells were seeded into 24-well plates at a density of 1 × 10⁶/ml and incubated overnight, then treated with metformin (0/5/10/20 mM) for 48 h. Cells were collected by centrifugation and resuspended in 500 µL binding buffer, then incubated with Annexin V-FITC and propidium iodide (PI) for 15 min at room temperature in the dark. Apoptotic cells were quantitated by flow cytometry (Becton-Dickinson, Franklin Lakes, NJ, USA).
RNA isolation and real-time quantitative PCR assay
Total RNA was isolated from PANC-1 cells using the miRNeasy Mini Kit (Qiagen, 217004, Hilden, USA) according to the manufacturer’s protocol. The concentrations of RNA were measured with NanoDrop Spectrophotometry (Thermo Fisher, USA). The OD260/280 ratios of all samples were between 1.9 and 2.1. Complementary DNA (cDNA) was synthesized using 1 µg of total RNA and miScript II RT kit (Qiagen, 218161) according to the manufacturer’s protocol. miR-210-5p was quantified using real-time quantitative PCR with miScript SYBR Green PCR Kit (Qiagen, 218073) according to the manufacturer’s instructions. U6, a small nuclear RNA, was used as a control to determine relative miRNA expression. The primer sequences used for RT-qPCR were as follows: miR-210-5p (forward primer): AATAGTAGCCCCTGCCCACC, U6 (forward primer): AATAGTAGCCCCTGCCCACC. The relative miRNA levels were calculated using the comparative Ct method (ΔΔCt).
Small RNA transfection
PANC-1 cells were cultured with DMEM containing 25 mM or 5 mM glucose overnight, then transfected with 50 nM miR-210-5p mimics or mimic NC, 100 nM miR-210-5p inhibitor or inhibitor NC (RiboBio, Guangzhou, China) using LipofectamineTM3000 (Invitrogen, USA), according to the manufacturer’s instructions. After 24 h of transfection, the cells were treated with or without 10 mM metformin for 48 h. Then, cell viability and apoptosis were detected as described above.
Specific miRNA function prediction
The potential target genes of miR-210-5p were predicted using four databases: miRDB, miRWalk, TargetScan, and miRTarBase. Gene ontology (GO) terms and Kyoto Encyclopedia of Genes and Genomes (KEGG) pathways were used to identify the potential functions and related pathways of target genes.
Western blot
After harvesting cells transfected with miR-210-5p mimic or inhibitor, treated with or without metformin, cells were washed with cold PBS and incubated with ice-cold RIPA buffer for 30 min on ice. After centrifugation at 12,000 g for 15 min, the supernatant was collected. Protein concentration was detected using the BCA Protein Assay Kit (Beyotime Biotechnology, Shanghai, China). Equal amounts of proteins per well were separated by SDS-PAGE electrophoresis (80 V × 30 min→120 V × 60 min) using BeyoGelTM Plus PAGE (Tris-Gly, 10%, P0455S, Beyotime Biotechnology, Shanghai, China) and transferred onto PVDF membranes (300 mA × 2 h), which were subsequently blocked in TBST (150 mM NaCl, 10 mM Tris-HCl [pH 7.6], and 0.05% Tween 20) containing 5% nonfat dry milk for 60 min at room temperature. After that, the membranes were incubated overnight at 4 °C with PFKFB2 (1:1000; #13029, Cell Signaling Technology, Inc., Beverly, MA, USA), Phospho-PFKFB2 (Ser 483)(1:1000; #13064, Cell Signaling Technology, Inc., Beverly, MA, USA), beta-actin (1:1000; #4970, Cell Signaling Technology, Inc., Beverly, Ma, USA). After incubated with horseradish peroxidase-conjugated secondary antibody (1:2000; Cell Signaling Technology, USA) at room temperature for 60 min, the membranes were washed 3 times with TBST. The blots were visualized using an ultra-sensitive ECL chemiluminescence detection kit (Proteintech Group, Inc., Rosemont, IL, USA). Protein levels were quantified using the ImageJ software V2.0.0.
Glucose, pyruvate, lactate, and ATP measurement
Cells were plated in 12-well plates overnight in DMEM containing 5 mM or 25 mM glucose. Then cells were transfected with miR-210-5p mimic or NC for 24 h and subsequently treated with or without 10 mM metformin for 48 h. After the treatment with metformin, the media was collected. The glucose concentration was measured by the glucose oxidase method. Glucose consumption was calculated by deducting the concentration of glucose in the medium without cells. The concentration of pyruvate was measured using a pyruvate assay kit (A081-1-1, Nanjing Jiancheng Bioengineering Institute, China) with a colorimetric detection method according to the manufacturer’s instructions. The consumption of pyruvate was calculated using a similar formula as the consumption of glucose. The production of lactate was determined using the lactic acid assay kit (A019-2, Nanjing Jiancheng Bioengineering Institute, China) via colorimetric detection according to the manufacturer’s protocol. The ATP Assay Kit (A095-1, Nanjing Jiancheng Bioengineering Institute, China) was used to test the level of ATP in the medium according to the manufacturer’s protocol. All the values were normalized to protein concentration.
The activity of PFK1 and LDH assay
Cell supernatant was collected after transfected with miRNA as well as treatment with metformin. The activity of phosphofructokinases (PFK1) was assayed using the spectrophotometric method with the PFK test kit (A129-1, Nanjing Jiancheng Bioengineering Institute, China), according to the manufacturer’s recommendation. The activity of lactate dehydrogenase (LDH) was detected with the LDH assay kit (A020-1, Nanjing Jiancheng Bioengineering Institute, China) using the colorimetric method according to the manufacturer’s instructions. The values were normalized to protein concentration.
Statistical analysis
The data are shown as the mean ± standard error. Comparisons between the control and metformin treatment groups in the contexts of different concentrations of glucose were analyzed by two-way ANOVA followed by Tukey or Dunnet post hoc test. Statistical analysis were performed with GraphPad Prism 8.0 (GraphPad Software, San Diego, CA, USA). P < 0.05 was considered statistically significant.
Results
Metformin inhibited the growth of PANC-1 cells, which was more profound in low glucose than in high glucose
The viability of PANC-1 cells cultured in 5 mM glucose was lower than those in 25 mM glucose. Metformin treatment inhibited the proliferation and viability of PANC-1 cells in a concentration-dependent way. High dose of metformin induced apoptosis of PANC-1 cells cultured both in high and low glucose. The inhibitory effect of metformin on cell growth is more pronounced in cells cultured with low glucose than those with high glucose. For example, treatment with 10 mM and 20 mM metformin induced apoptosis in up to 90% of cells in the low-glucose group, however, the apoptotic cell ratio was less than 60% in the high glucose group ().
Figure 1. Effects of metformin on proliferation, viability, and apoptosis of PANC-1 cells cultured in high and low glucose conditions.
Metformin increased the expression of miR-210-5p in PANC-1 cells cultured in low glucose but not in high glucose
Without metformin, the expression of miR-210-5p is lower in cells cultured in low glucose comparing to those in high glucose. However, when treated with metformin, the expression of miR-210-5p is increased significantly in cells cultured in 5 mM glucose, but not in those cultured in 25 mM glucose. Conversely, metformin treatment decreased the expression of miR-210-5p in cells cultured in 25 mM glucose, though without statistical significance. Besides, compared with cells cultured in high glucose, the expression of miR-210-5p is significantly higher in those cultured in low glucose with metformin treatment ().
Figure 2. Relative expression of miR-210-5p in PANC-1 cells treated with metformin in high and low glucose conditions.
miR-210-5p inhibited cell viability but didn’t induce cell apoptosis of PANC-1 cells
PANC-1 cells transfected with miR-210-5p mimic showed a significant reduction of viability both in high and low glucose, compared to cells transfected with the mimic NC. The inhibitory effect of miR-210-5p mimic on cell viability is more pronounced in cells cultured in low glucose than in high glucose. When combined with miR-210-5p mimic, the inhibitory effect of metformin on cell viability is more substantial in both high and low glucose when compared with mimic NC group. The miR-210-5p mimic does not affect the apoptosis of PANC-1 cells significantly, whether treated with metformin or not ().
Figure 3. Effects of miR-210-5p mimic and inhibitor on the viability of PANC-1 cells cultured in high and low glucose conditions.
miR-210-5p down-regulated the expression of PFKFB2 and inhibited lactate production of PANC-1 cells
6-phosphofructo-2-kinase/fructose-2,6-bisphosphatase2 (PFKFB2) is predicted to be a potential target of miR-210-5p. Western blot results showed that miR-210-5p mimic inhibits the expression of PFKFB2 both in high and low glucose when compared to the mimic NC group. The expression of p-PFKFB2 seemed to be reduced with transfection of miR-210-5p mimic, but without statistical significance (). What’s more, miR-210-5p mimic reduced the activity of PFK1 and LDH significantly. Besides, miR-210-5p mimic decreased the lactate content in cellar supernatant of cells cultured in high glucose treated with 10 mM metformin. However, miR-210-5p didn’t affect the consumption of glucose and pyruvate, as well as ATP content significantly ().
Figure 4. Effects of miR-210-5p mimic combined with or without metformin on the expression of PFKFB2 and p-PFKFB2 in PANC-1 cells.
Figure 5. Effects of miR-210-5p mimic combined with or without metformin on glycolysis related enzyme and products in PANC-1 cells.
Cells in the low glucose group are highly dependent on anaerobic glycolysis
It can be seen from that, without the treatment of metformin, the PFK1 activity of the cellar supernatant in the low glucose group was significantly lower than that in the high glucose group, while the LDH activity was significantly higher than that in the high glucose group. Additionally, cells in the low glucose group consume less glucose and more pyruvate than those in the high glucose group. Although the glucose consumption of cells in the low glucose group was significantly reduced, actually the glucose in the culture medium had been completely consumed (5 mM). That’s why the flux of glycolysis from glucose to pyruvate is reduced while the flux of anaerobic glycolysis from pyruvate to lactate was enhanced, which is also supported by the enhanced consumption of pyruvate. Therefore, the lower activity of PFK1 and the higher activity of LDH in the low glucose group might be a reflection of high dependence on anaerobic glycolysis when the supply of glucose is insufficient. Nevertheless, the lactate production and ATP content in the low glucose group was still significantly lower than those in the high glucose group, indicating a relative insufficiency in energy supply ().
Metformin inhibited the expression of p-PFKFB2 and activity of LDH in low glucose
Metformin treatment almost completely inhibited the expression of p-PFKFB2 in PANC-1 cells cultured in the low glucose group. Yet, in cells cultured under high glucose conditions, metformin increased the expression of p-PFKFB2, though without statistical significance (). In addition, metformin treatment significantly reduced LDH activity both in high and low glucose groups, thus inhibiting anaerobic glycolytic flux. However, a combination of miR-210-5p and metformin significantly enhanced metformin’s inhibitory effect on LDH activity only in the low glucose group. With the treatment of metformin, cells in the high glucose group showed increased consumption of glucose and production of lactate compared with those without treatment of metformin (). This might be a compensatory response to the energy stress induced by metformin via inhibiting the activity of LDH and anaerobic glycolysis. However, this adaptive response wasn’t observed in the low glucose group. One important reason is that, without treatment of metformin, the glucose consumption of cells in the low glucose group had reached the upper limit of the medium, and cells are highly dependent on anaerobic glycolysis, as mentioned above. What’s more, Treatment of metformin and miR-210-5p significantly inhibited expression of p-PFKFB2 and activity of LDH, further inhibiting the flux of anaerobic glycolysis. Therefore, the consumption of pyruvate didn’t increase to produce more lactate and ATP to adapt to the energy stress induced by metformin. The contents of lactate and ATP were still significantly lower than those in the high glucose group ().
Discussion
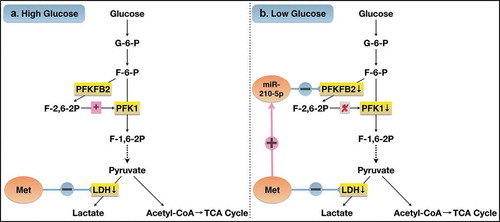
This study showed that metformin inhibited cell proliferation and cell viability, induced cell apoptosis of PANC-1 cells, both in high and low glucose groups. Whereas, the inhibitory effect of metformin on cell growth was more pronounced in cells cultured under low glucose conditions than those under high glucose conditions. Metformin treatment increased the expression of miR-210-5p in cells cultured in low glucose group, but not in the high glucose group. miR-210-5p mimic inhibited cell viability and enhanced the inhibitory effect of metformin on the viability of PANC-1 cells. PFKFB2 might be one of the potential target genes of miR-210-5p, whose expression was reduced in cells transfected with miR-210-5p mimic. In addition, miR-210-5p mimic significantly reduced the activity of PFK1 and LDH, two key enzymes in the downstream pathway of glycolysis. Metformin inhibited LDH activity both in high and low glucose, but significantly inhibited the expression of p-PFKFB2 only in cells cultured with low glucose, which might be mediated by up-regulation of miR-210-5p. Cells cultured under high glucose conditions increased consumption of glucose and production of lactate as a compensatory response to energy stress induced by metformin treatment. However, due to the complete consumption of glucose of cells cultured under low glucose conditions, this phenomenon wasn’t observed in the low glucose group. Additionally, cells in the low glucose group suffered more severe energy stress induced by metformin, which makes them unable to make adaptive compensation by increasing pyruvate consumption. Hence, the ATP content is still significantly lower than that in the high-glucose group. Collectively, these results suggest that the more pronounced inhibitory effect of metformin on PANC-1 cells in the low glucose conditions is probably due to up-regulating the expression of miR-210-5p in the low-glucose, which in turn inhibits glycolysis through PFKFB2 ().
Figure 6. Possible mechanism of the difference in the effect of metformin on PANC-1 cells cultured in high and low glucose.
Previous studies have indicated that metformin could inhibit the growth of PC both in vitro and in vivo [Citation38–Citation40]. But the results of clinical studies are inconsistent: observational studies have shown reduced risk and better survival in PC patients treated with metformin than without metformin [Citation33,Citation41]. However, two RCT studies showed that advanced PC patients didn’t benefit from metformin treatment [Citation42,Citation43]. One possible reason is that the patients included were in an advanced stage with remote metastasis, as is shown in two meta-analyses [Citation44,Citation45]. The other possible reason is due to the low dose of metformin used in clinical trials than in pre-clinical trials [Citation46]. By exploring the mechanisms and targeting the critical molecules for treatment, the anti-tumor function of metformin will be enhanced, and the limitation of metformin’s clinical application will be improved.
Our study demonstrated that metformin inhibits proliferation and induce apoptosis of PANC-1 cells. The anti-tumor effect of metformin is more pronounced in cells cultured in high glucose than those in low glucose. Several studies have explored the impact of metformin in different glucose conditions on several other types of tumor cells. They also find out that low glucose enhances the anti-tumor effects of metformin, while high glucose may reduce the sensitivity to metformin. The possible mechanism may involve the activation of AMPK [Citation31], mitochondrial dysfunction, and endoplasmic reticulum stress [Citation28].
In this study, we found that the expression of miR-210-5p was significantly different between the high and the low glucose group after treatment with metformin, which may be a possible reason accounting for the difference in the effect of metformin. Metformin significantly enhanced the expression of miR-210-5p in the low glucose group but had no significant impact on the high glucose group. Cells transfected with miR-210-5p mimic had decreased viability compared to those transfected with NC. Moreover, miR-210-5p mimic further enhanced the inhibitory effect of metformin on tumor cell viability. Thus, we speculate that there might be a possibility that the increased expression of miR-210-5p might account for the enhanced anti-tumor effect of metformin on cells cultured in low glucose conditions. However, miR-210-5p mimic and inhibitor didn’t significantly affect cell apoptosis, suggesting that metformin exerts pro-apoptotic effects through other mechanisms.
Western blot results showed that miR-210-5p mimic could significantly inhibit the expression of PFKFB2, a predicted potential target gene of miR-210-5p. PFKFB2 catalyzes the synthesis and degradation of fructose 2,6-bisphosphate (F-2,6-BP), which is a potent allosteric regulatory activator of PFK1, a rate-limiting enzyme in glycolysis [Citation47,Citation48]. To clarify the effects and potential mechanisms of miR-210-5p on PANC-1 cells glucose metabolism, we examined the products of glycolysis, as well as the activity of PFK1 and LDH. LDH catalyzes the conversion of pyruvate to lactate, thus playing a pivotal role in regulating anaerobic glycolysis [Citation49]. It turned out that miR-210-5p mimic could significantly inhibit the activity of PFK1 and LDH. Therefore, it can be supposed that miR-210-5p might inhibit cell activity by down-regulating the expression of its potential target gene PFKFB2 and then inhibiting glycolysis by repressing the activity of PFK1 and LDH. However, other parameters related to glycolysis were not changed, possibly owing to the relatively low level of miR-210-5p in these cells.
In fact, in the absence of metformin, the activity and glucose metabolism of cells cultured in the high and low glucose conditions was different: cells in the low glucose group had lower cell viability, higher LDH activity, lower PFK1 activity, and lower ATP levels than those of high glucose. The lower activity of PFK1 in cells under low glucose conditions might reflect a relatively low flux of glycolysis, while a higher activity of LDH might be a reflection of sufficient reserve capacity of anaerobic glycolysis in cells cultured with low glucose. This might be a compensatory response to accommodate the energy stress and to satisfy the rapid growth of tumor cells when the energy supply is relatively inadequate under low glucose conditions. However, since glucose consumption has reached the maximum level, the cells try to proceed towards the direction of anaerobic glycolysis by enhancing the activity of LDH activity and increasing the consumption of pyruvate, to adapt to the lack of energy. Whereas, the ATP level is still low, which might be a good reason responsible for the lower viability of cells in low glucose than those in high glucose.
Treatment with metformin significantly inhibited the LDH activity of cells both in high and low glucose conditions, indicating that it had a significant inhibitory effect on anaerobic glycolysis. It is reported that LDH was dysregulated in several types of cancers and might be a potential therapeutic target in cancer [Citation49–Citation51]. Several previous studies have also drawn a similar conclusion that metformin treatment might inhibit LDH activity and glycolysis of certain types of cancer cells [Citation18,Citation19]. According to the Warburg effect, the rapid growth of tumor cells is highly dependent on anaerobic glycolysis, even when there is enough oxygen. Therefore, by inhibiting LDH activity and flux of anaerobic glycolysis metformin may lead to energy stress and less production of ATP. Cells in the high glucose group can compensate for energy stress induced by metformin via increasing the consumption of glucose, together with increased production of lactate as a consequence. So, the ATP content does not decrease significantly, and this might explain why the repressive function of metformin on cells cultured in high glucose conditions are relatively mild. However, due to the limited glucose supply, cells in the low glucose conditions compensate for energy stress by up-regulating LDH activity and consumption of pyruvate. The treatment of metformin not only inhibited LDH activity but also reduced expression of p-PFKFB2 in cells cultured under low glucose conditions, thus, further inhibiting glycolysis and aggravating the energy crisis. Whereas, on the basis that cells in the low glucose group have reached the upper limit of glucose consumption, they are unable to gain more energy by increasing the flux of glycolysis. That may explain why the cell activity is more severely inhibited, and the cells are more likely to undergo apoptosis under low glucose conditions.
Taken together, metformin significantly up-regulated the expression of miR-210-5p, down-regulated the expression of p-PFKFB2, and inhibited the activity of LDH in the low-glucose group. Additionally, miR-210-5p mimic significantly reduced the expression of PFKFB2, as well as the activity of PFK1 and LDH. Besides, it was observed that miR-210-5p mimic could reduce the content of lactate in the high-glucose group, together with the treatment of metformin. Although no significant decrease in lactate levels in the low-glucose group was observed, we still believe that there is a good reason to support the point that up-regulating expression of miR-210-5p and then inhibiting expression and activity of PFKFB2, PFK1 and LDH, thus inhibiting the flux of glycolysis may be one of the mechanisms of the enhanced inhibitory effect of metformin on cell growth in the low glucose conditions.
A limitation of this study is that we didn’t confirm the effect of metformin and miR-210-5p by using other pancreatic cancer cell lines other than PANC-1. In addition to in vitro experiments, tumor-induced mice models with or without diabetes is another way to better explore the effect of metformin as well as miR-210-5p on pancreatic cancer in different glucose conditions. Further experiments will be needed to confirm the findings of our study.
In conclusion, metformin has an inhibitory effect on the growth of pancreatic cancer cells, and the inhibitory effect is more evident on cells cultured in low glucose conditions. Metformin up-regulates the expression of miR-210-5p in the low glucose group, which inhibits the expression of the potential target gene PFKFB2, and then represses glycolysis via inhibiting the activity of PFK1 and LDH, essential enzymes of the downstream glycolytic pathway. This may be one of the mechanisms why metformin inhibits cell activity in the low glucose group more profoundly. Therefore, for PC patients without DM, taking metformin may be more beneficial, especially in combination with miR-210 analogs or glycolysis inhibitors may further increase the efficacy. However, for patients with PC and DM, due to high glucose impairs sensitivity to metformin by increasing glucose uptake and consumption to compensate for energy stress induced by metformin, a combination of glucose uptake inhibitors with metformin might be a choice. Further researches are needed to explore the mechanisms to find out more targeted and individualized therapeutic strategies for tumor patients with different glucose metabolism states.
Acknowledgments
Thank all the authors for their kind work.
Disclosure statement
The authors declare no conflict of interest.
Correction Statement
This article has been republished with minor changes. These changes do not impact the academic content of the article.
Additional information
Funding
References
- Siegel RL, Miller KD, Jemal A. Cancer statistics, 2019. CA Cancer J Clin. 2019;69(1):7–34.
- Kamisawa T, Wood LD, Itoi T, et al. Pancreatic cancer. Lancet. 2016;388(10039):73–85.
- Andersen DK. Diabetes and cancer: placing the association in perspective. Curr Opin Endocrinol Diabetes Obes. 2013;20(2):81–86.
- Szablewski L. Diabetes mellitus: influences on cancer risk. Diabetes Metab Res Rev. 2014;30(7):543–553.
- Gallagher EJ, LeRoith D. Obesity and diabetes: the increased risk of cancer and cancer-related mortality. Physiol Rev. 2015;95(3):727–748.
- Tsai HJ, Chang JS. Environmental risk factors of pancreatic cancer. J Clin Med. 2019;8:9.
- Pannala R, Leirness JB, Bamlet WR, et al. Prevalence and clinical profile of pancreatic cancer-associated diabetes mellitus. Gastroenterology. 2008;134(4):981–987.
- Bosetti C, Rosato V, Li D, et al. Diabetes, antidiabetic medications, and pancreatic cancer risk: an analysis from the international pancreatic cancer case-control consortium. Ann Oncol. 2014;25(10):2065–2072.
- Liao WC, Tu YK, Wu MS, et al. Blood glucose concentration and risk of pancreatic cancer: systematic review and dose-response meta-analysis. Bmj. 2015 jan 02;349(3):g7371–g7371. .
- Li D, Yeung SC, Hassan MM, et al. Antidiabetic therapies affect risk of pancreatic cancer. Gastroenterology. 2009;137(2):482–488.
- Bodmer M, Becker C, Meier C, et al. Use of antidiabetic agents and the risk of pancreatic cancer: a case-control analysis. Am J Gastroenterol. 2012;107(4):620–626.
- Foretz M, Guigas B, Bertrand L, et al. Metformin: from mechanisms of action to therapies. Cell Metab. 2014;20(6):953–966.
- Andrzejewski S, Siegel PM, St-Pierre J. Metabolic profiles associated with metformin efficacy in cancer. Front Endocrinol (Lausanne). 2018;9:372.
- Bridges HR, Jones AJ, Pollak MN, et al. Effects of metformin and other biguanides on oxidative phosphorylation in mitochondria. Biochem J. 2014;462(3):475–487.
- Zhou G, Myers R, Li Y, et al. Role of AMP-activated protein kinase in mechanism of metformin action. J Clin Invest. 2001;108(8):1167–1174.
- Sylvia Andrzejewski S-PG, Pollak M, St-Pierre J. Metformin directly acts on mitochondria to alter cellular bioenergetics. Cancer Metab. 2014;2(1):12.
- Song IS, Han J, Lee HK. Metformin as an anticancer drug: A Commentary on the metabolic determinants of cancer cell sensitivity to glucose limitation and biguanides. J Diabetes Investig. 2015;6(5):516–518.
- Wahdan-Alaswad RS, Edgerton SM, Salem HS, et al. Metformin targets glucose metabolism in triple negative breast cancer. J Oncol Transl Res. 2018;4:1.
- Tang D, Xu L, Zhang M, et al. Metformin facilitates BG45induced apoptosis via an antiWarburg effect in cholangiocarcinoma cells. Oncol Rep. 2018;39(4):1957–1965.
- Faubert B, Boily G, Izreig S, et al. AMPK is a negative regulator of the Warburg effect and suppresses tumor growth in vivo. Cell Metab. 2013;17(1):113–124.
- Vander Heiden MG, Cantley LC, Thompson CB. Understanding the Warburg effect: the metabolic requirements of cell proliferation. Science. 2009;324(5930):1029–1033.
- Kim JW, Dang CV. Cancer’s molecular sweet tooth and the Warburg effect. Cancer Res. 2006;66(18):8927–8930.
- Liberti MV, Locasale JW. The Warburg effect: how does it benefit cancer cells? Trends Biochem Sci. 2016;41(3):211–218.
- Cassim S, Raymond VA, Lacoste B, et al. Metabolite profiling identifies a signature of tumorigenicity in hepatocellular carcinoma. Oncotarget. 2018;9(42):26868–26883.
- Cassim S, Pouyssegur J. Tumor microenvironment: a metabolic player that shapes the immune response. Int J Mol Sci. 2019;21(1):1.
- Cassim S, Raymond VA, Dehbidi-Assadzadeh L, et al. Metabolic reprogramming enables hepatocarcinoma cells to efficiently adapt and survive to a nutrient-restricted microenvironment. Cell Cycle. 2018;17(7):903–916.
- Ždralević M, Brand A, Di IL, et al. Double genetic disruption of lactate dehydrogenases A and B is required to ablate the “Warburg effect” restricting tumor growth to oxidative metabolism. J Biol Chem. 2018;293(41):15947–15961.
- Ma L, Wei J, Wan J, et al. Low glucose and metformin-induced apoptosis of human ovarian cancer cells is connected to ASK1 via mitochondrial and endoplasmic reticulum stress-associated pathways. J Exp Clin Cancer Res. 2019;38(1):77.
- Litchfield LM, Mukherjee A, Eckert MA, et al. Hyperglycemia-induced metabolic compensation inhibits metformin sensitivity in ovarian cancer. Oncotarget. 2015;6(27):23548–23560.
- Bikas A, Jensen K, Patel A, et al. Glucose-deprivation increases thyroid cancer cells sensitivity to metformin. Endocr Relat Cancer. 2015;22(6):919–932.
- Zordoky BN, Bark D, Soltys CL, et al. The anti-proliferative effect of metformin in triple-negative MDA-MB-231 breast cancer cells is highly dependent on glucose concentration: implications for cancer therapy and prevention. Biochim Biophys Acta. 2014;1840(6):1943–1957.
- Wahdan-Alaswad R, Fan Z, Edgerton SM, et al. Glucose promotes breast cancer aggression and reduces metformin efficacy. Cell Cycle. 2013;12(24):3759–3769.
- Rupaimoole R, Calin GA, Lopez-Berestein G, et al. miRNA deregulation in cancer cells and the tumor microenvironment. Cancer Discov. 2016;6(3):235–246.
- Iorio MV, Croce CM. MicroRNA dysregulation in cancer: diagnostics, monitoring and therapeutics. A comprehensive review. EMBO Mol Med. 2012;4(3):143–159.
- Rottiers V, Naar AM. MicroRNAs in metabolism and metabolic disorders. Nat Rev Mol Cell Biol. 2012;13(4):239–250.
- Sun FB, Lin Y, Li SJ, et al. MiR-210 knockdown promotes the development of pancreatic cancer via upregulating E2F3 expression. Eur Rev Med Pharmacol Sci. 2018;22(24):8640–8648.
- Yu Q, Xu C, Yuan W, et al. Evaluation of plasma MicroRNAs as diagnostic and prognostic biomarkers in pancreatic adenocarcinoma: miR-196a and miR-210 could be negative and positive prognostic markers, respectively. Biomed Res Int. 2017;2017:6495867.
- Wheaton WW, Weinberg SE, Hamanaka RB, et al. Metformin inhibits mitochondrial complex I of cancer cells to reduce tumorigenesis. Elife. 2014;3:e02242.
- Ben Sahra I, Laurent K, Loubat A, et al. The antidiabetic drug metformin exerts an antitumoral effect in vitro and in vivo through a decrease of cyclin D1 level. Oncogene. 2008;27(25):3576–3586.
- Dowling RJ, Zakikhani M, Fantus IG, et al. Metformin inhibits mammalian target of rapamycin-dependent translation initiation in breast cancer cells. Cancer Res. 2007;67(22):10804–10812.
- Lee MS, Hsu CC, Wahlqvist ML, et al. Type 2 diabetes increases and metformin reduces total, colorectal, liver and pancreatic cancer incidences in Taiwanese: a representative population prospective cohort study of 800,000 individuals. BMC Cancer. 2011;11:20.
- Reni M, Dugnani E, Cereda S, et al. (Ir)relevance of metformin treatment in patients with metastatic pancreatic cancer: an open-label, randomized phase II trial. Clin Cancer Res. 2016;22(5):1076–1085.
- Kordes S, Pollak MN, Zwinderman AH, et al. Metformin in patients with advanced pancreatic cancer: a double-blind, randomised, placebo-controlled phase 2 trial. Lancet Oncol. 2015;16(7):839–847.
- Li X, Li T, Liu Z, et al. The effect of metformin on survival of patients with pancreatic cancer: a meta-analysis. Sci Rep. 2017;7(1):5825.
- Wan G, Sun X, Li F, et al. Survival benefit of metformin adjuvant treatment for pancreatic cancer patients: a systematic review and meta-analysis. Cell Physiol Biochem. 2018;49(3):I.
- He L, Wondisford FE. Metformin action: concentrations matter. Cell Metab. 2015;21(2):159–162.
- Okar DA, Manzano A, Navarro-Sabate A, et al. PFK-2/FBPase-2: maker and breaker of the essential biofactor fructose-2,6-bisphosphate. Trends Biochem Sci. 2001;26(1):30–35.
- Yalcin A, Telang S, Clem B, et al. Regulation of glucose metabolism by 6-phosphofructo-2-kinase/fructose-2,6-bisphosphatases in cancer. Exp Mol Pathol. 2009;86(3):174–179.
- Mishra D, Banerjee D. Lactate dehydrogenases as metabolic links between tumor and stroma in the tumor microenvironment. Cancers (Basel). 2019;11:6.
- Granchi C, Bertini S, Macchia M, et al. Inhibitors of lactate dehydrogenase isoforms and their therapeutic potentials. Curr Med Chem. 2010;17(7):672–697.
- Valvona CJ, Fillmore HL, Nunn PB, et al. The regulation and function of lactate dehydrogenase a: therapeutic potential in brain tumor. Brain Pathol. 2016;26(1):3–17.