
ABSTRACT
Different strategies of ovarian stimulation are widely used in IVF to retrieve mature metaphase II (MII) oocytes for fertilization. On average, approximately 70% of recovered oocytes are mature, while personalized administration of hCG and/or GnRH agonist trigger and in vitro maturation (IVM) management can further improve the maturation rate. However, even under such conditions, a complete absence of oocyte maturation is still observed sporadically. The probable causes for such maturation-deficient (MD) oocytes – which arrest abnormally at metaphase I (MI) stage – are still under investigation. In the present study, using single-cell transcriptomic RNA sequencing (RNA-seq) and differential expression analysis, we showed that gene expression profiles were aberrant, and alternative splicing (AS) patterns were changed in MD oocytes when compared with normally mature (MN) oocytes. Gene ontology (GO) enrichment demonstrated that the differently expressed genes (DEGs) were mostly correlated with pre-mRNA splicing, RNA transportation, RNA processing, and mRNA regulation. Subsequently, analysis of AS events revealed that genes with altered AS patterns were primarily associated with metabolism and cell cycle. With these findings, we have demonstrated aberrant gene expression in complete maturation-deficient oocytes, and we propose that alterations in post-transcriptional regulation constitute a potential underlying mechanism governing oocyte maturation.
Introduction
Intrauterine insemination (IUI), in vitro fertilization (IVF), intracytoplasmic sperm injection (ICSI), and other assisted reproductive techniques have helped many infertile couples to have their own babies, and now comprise 1–3% of all births [Citation1]. Different strategies of ovarian stimulation have been used according to a patient’s specific situation – including the long protocol, short protocol, and antagonist protocol. Although with individualized protocols and combined with in vitro maturation (IVM) techniques, we typically achieve 60–80% of oocytes maturing; in some rare cases, none of the recovered oocytes matures. These maturation-deficient (MD) oocytes may arrest abnormally at the germinal vesicle (GV) stage or metaphase of meiosis I (MI) stage, making it impossible to achieve insemination [Citation2]. Unfortunately, only a few genes and their related mechanisms of action have been identified as being responsible for human oocyte maturation arrest; most causes of complete oocyte maturation defects are currently unexplained and require further exploration.
Oocyte maturation is comprehensively regulated at transcriptional, translational, endocrinologic, and metabolic levels [Citation3,Citation4]. Oogenesis is initiated with primordial germ cells (PGCs) at the embryonic stage, and oocytes arrest at the diplotene stage of meiotic prophase I for several years. Meiotic progression then resumes with puberty and at each subsequent menstrual period [Citation5]. Hormonal signaling regulates menstrual cyclicity, while oocyte-gonadal somatic cell interactions control the timing of oocyte meiotic maturation [Citation6]. After first meiosis, oocytes are ovulated and enter a second arrest at metaphase II (MII) [Citation7]. Since transcriptional events are almost completed before full growth of GV oocytes occurs, and are relatively silenced thereafter [Citation8], meiotic resumption and maturation – including meiotic spindle assembly and cytoplasmic maturation – are principally based upon already-existing maternal transcripts [Citation9]. Therefore, integrated transcriptome maintainance is of great importance in oocyte development. Using single-cell RNA sequencing (RNA-seq), we and other groups have previously contributed to an expression atlas of human oocytes and embryos [Citation10–Citation13]. In addition, comparisons between in vivo and in vitro matured oocytes revealed alterations in energy metabolism [Citation14], and comparisons between young women and those at advanced maternal ages showed divergent expression patterns concerning mitochondria, cell cycle kinetics, and cytoskeleton [Citation15]. Recently, a study of failed-to-mature oocytes from rhesus monkeys indicated deficient transcriptional regulation [Citation16]; however, the transcriptomic landscape of meiotically incompetent human oocytes remains largely obscure.
Accordingly, pre-mRNA alternative splicing (AS) was implicated in providing cells with the capacity to respond to stimuli, and AS also contributes to transcriptome complexity [Citation17] – with any dysregulation resulting in aberrant phenotypes and diseases [Citation18]. Splicing is executed by the spliceosome, which is composed of 5 major U-rich small nuclear ribonucleoproteins (U1/U2/U4/U5/U6 snRNPs), NineTeen complex (NTC), NineTeen complex-related (NTR), and many other factors exemplified by serine/arginine-rich (SR) proteins and hetero-nuclear ribonucleoproteins (hnRNPs). In oocyte maturation as well as in spermatogenesis, spliceosomal proteins and AS play crucial roles in regulating stage-specific transcripts [Citation19]. For example, nuclear m6A (N6-methyladenosine) reader YTHDC1 regulates AS during oocyte development [Citation20], and the RNA-binding protein SRSF3 regulates AS to maintain transcriptome integrity [Citation21]. However, most AS regulators and their functions in oocyte maturation remain to be elucidated.
In the current study, by single-cell RNA sequencing analysis, we performed a detailed investigation into the transcriptional profiles and AS patterns of human MD oocytes, and compared them with normally mature (MN) oocytes. High-quality, single-cell RNA-seq analysis provided us with the opportunity to uncover aberrations in expressed genes and pathways, and we then specifically analyzed the altered AS events and splice variants. The present study thus clarifies the post-transcriptional regulation of genes as a mechanism subserving oocyte maturation.
Materials and methods
Ethical approval, participants, and human oocyte collection
The present study was reviewed and approved by the Institutional Review Board of Peking University Third Hospital (No. 2018013). All of the oocytes were voluntarily donated by IVF patients who had been clearly informed of our experimental aims and signed the appropriate informed consent forms.
MD oocytes (Y1, Y2, and Y3) were obtained from individual patients whose oocytes failed to mature completely. These MD oocytes used in this study were collected in the second or third IVF cycle as indicated. All the oocytes were retrieved at GV stage, remaining at MI after germinal vesicle breakdown (GVBD) until the third day of in vitro culture (Supplementary Figure 1). Such immature oocytes are usually discarded, but herein we collected them for transcriptomic analysis. MN oocytes (B1, B2, and B3) were voluntarily donated from individual IVF patients who underwent normal retrieval of MII oocytes that exhibited normal maturation rates. The MII stage oocytes were used for patient IVF treatments, whereas GV stage oocytes were cultured to MII and donated to our study and referred to as MN. No differences were found among patients regarding their demographics and baseline characteristics ().
Table 1. Primary physiologic indices of patient.
Clinical procedures and oocyte treatment were identical for both MD and MN patients. Ovarian stimulation was performed under an antagonist protocol after hCG (human chorionic gonadotropin) administration, which was then followed by ultrasound-guided needle aspiration of follicles 46 to 48 hours later. Both MN and MD oocytes were retrieved at GV stage (Day 0) and the cumulus cells were denuded 2 hours later. Mature MII oocytes from MN patients were used for their IVF treatments, and their remaining GV oocytes were cultured for another 24–48 hours (Day 1–2) to promote maturation to MII (MN oocytes). For MD patients, all their retrieved oocytes remained unmatured at the MI stage even on Day 3. Both MN and MD oocytes were ultimately collected and prepared for molecular analysis .
cDNA synthesis, library preparation, and sequencing
Cumulus cells were removed and individual oocytes were exposed to hyaluronidase to remove all remaining cumulus cells, and then washed several times with Ca2+/Mg2+-free PBS. Total RNA was isolated using the PicoPureTM RNA Extraction kit (Life Technologies, Carlsbad, CA, USA), including RNase-free DNase treatment. We then used oligo (dT) primers and template-switching oligo primers to synthesize first-strand cDNA. In situ PCR primer-guided PCR amplification was performed with a SMARTer Ultra Low Input RNA HV kit (Clontech, USA), following the manufacturer’s protocol. The quality and quantity of the resulting cDNA (after purification by AMPure XP Beads [A63882; Beckman Coulter Inc., USA]) was evaluated with a Qubit 3.0 fluorometer (Thermo Fisher Scientific, USA).
cDNA library preparation began with cDNA fractionation by ultrasonic waves using a Bioruptor® sonication system (Diagenode Inc., Belgium) followed by terminal repair, adaptor addition, and purification using AMPure XP Beads. Then, 200–300 bp DNA fragments were recovered with a CWBIO Gel Extraction Kit (CW2302A; Cwbiotech Inc., China) after 2% agarose gel electrophoresis. The insert size of the constructed cDNA library was evaluated with an Agilent 2100 Bioanalyzer (Agilent Technologies, CA, USA) and quantified by quantitative real-time PCR using Bio-Rad CFX 96. Finally, Illumina paired-end 150 bp sequencing was performed on a HiSeq 2500 (Illumina, USA). All sequencing data are available at the Gene Expression Omnibus (GSE129123).
Single-cell transcriptome analysis: expression profiling and pathway enrichment
After adaptor-moving and quality-control filtration of raw reads with NGSQC [Citation22], the remaining clean reads for each sample were mapped to the annotated human genome (hg19.ucsc.fa) with HISAT under default settings [Citation23]. We estimated mapping distribution, homogeneity, and saturation with online Picard (http://broadinstitute.github.io/picard/). Afterward, fragment counts normalized per kilobase of exon per million mapped fragments (FPKM) were estimated using Cuffquant and Cuffnorm in Cufflinks (v2.0.2) [Citation24]. Unsupervised hierarchical clustering was conducted using Cluster 3.0 and visualized using Java TreeView. Expression levels were estimated for all isoforms of a gene, and we determined differentially expressed genes (DEGs) using Cuffdiff in Cufflink, with |log2-fold change| ≥ 1 and a Q-value <0.05. The resulting DEGs were visualized by volcano plot.
For the annotation and enrichment of DEGs, Gene Ontology (GO) categories were classified by 2-sided Fisher’s exact probability test and Chi-squared test using DAVID (https://david.ncifcrf.gov/). Pathway enrichment analysis was performed using a similar method with reference to different databases, including the Kyoto Encyclopedia of Genes and Genomes (KEGG), Reactome, and BioCyc. The false discovery rate (FDR) was calculated to adjust the p-value, and GO terms or KEGG pathways were considered to be statistically significant with a FDR value <0.05.
Alternative splicing (AS) analysis and enrichment of differential AS genes
Alternative splicing events and global expression patterns of different exon-exon junction reads were analyzed using ASprofile [Citation25] for each sample. Briefly, all pairs of transcripts within a gene were compared to determine exon-intron structural differences that indicated an AS event. The FPKM of these events were calculated and splicing ratios across samples were compared, indicating the dynamics of AS profiles. Accordingly, 12 major types of AS events were implemented.
The classification of AS and evaluation of differentially alternatively spliced genes were analyzed using rMATS [Citation26] between MD and MN oocytes. We estimated all of the following 5 major types of AS: skipped exon, SE; alternative 5ʹ splice site, A5SS; alternative 3ʹ splice site, A3SS; mutually exclusive exons, MXE; and retained intron, RI. The inclusion level (IncLevel) of splicing sites was quantified by the mapped transcript ratio, and regarded as differential AS (DAS) events according to the likelihood-ratio test with a FDR value <0.05.
Pathway enrichment was performed for genes with at least 1 DAS, and the enrichment was similar for the DEGs described previously.
Results
Transcriptional profiles of single human MD and MN oocytes
Although we found no differences in patients’ physiologic indices and although patients were treated with similar IVF procedures, MD oocytes remained arrested at the MI stage while sharing similar sizes and morphologies with MN MII oocytes (, Supplementary Fig. S1A). From the 3 MD and 3 MN oocytes analyzed in our study, we obtained 6 individual, high-quality RNA-seq datasets after total RNA extraction, subsequent cDNA library construction, and sequencing. Approximately 67 million reads were detected for each sample, with a clean rate exceeding 99.7% (Supplementary Fig. S1B), and nearly 96% were mapped to the human genome on average (Supplementary Fig. S1C) – with over 60% constituting exonic reads (Supplementary Fig. S2A), thus displaying a high coverage. Alignment statistics also showed high homogeneity and saturation of sequencing (Supplementary Fig. S2B, S2C).
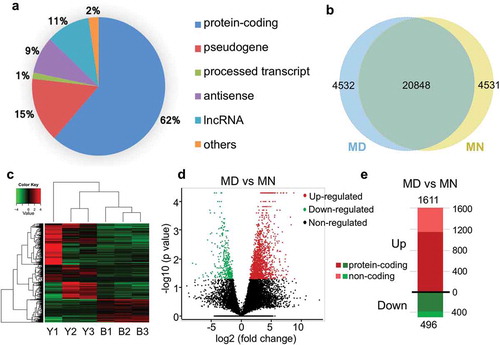
In total, 29,911 transcripts were detected as expressed, in which 62% were annotated as protein-coding genes, followed by pseudogenes (15%) and long non-coding RNA (lncRNAs) genes (11%) ()). Among these transcripts, 4531 were only detected in MD oocytes, 4532 were only expressed in MN oocytes, and 20,848 were jointly detected in samples from both groups ()). We displayed all 29,911 genes among 6 samples in a heatmap, and processed them by Spearman’s correlation analysis and hierarchical clustering ()). Altogether, 2107 genes were considered to be differentially expressed genes (DEGs) (|log2-fold change| ≥1 and FDR value <0.05) between the MD and MN groups. We considered 496 genes to be significantly downregulated and 1611 to be upregulated, and of these, 389 and 1151 were protein-coding genes, respectively (–e) and Supplementary Tables S1 & S2). We also included some pseudogenes and lncRNA transcripts (Supplementary Tables S1 & S2).
Figure 1. Characteristics and differences between transcriptomes from human MD and MN oocytes. (a) Statistics of expressed transcripts, with the majority being protein-coding genes and pseudogenes. Long non-coding RNAs (lncRNAs), processed transcripts, antisense RNAs and some other transcripts were also detected. (b) Venn diagram indicating the numbers of overlapping genes between MD and MN groups. (c) Unsupervised hierarchical clustering based on transcriptome characteristics. (d) A volcano plot depicting significantly upregulated or downregulated genes between the 2 groups. (e) Compared with the MN group, 1611 and 496 transcripts were upregulated (shown in red) and downregulated (shown in green) in MD oocytes, respectively. Dark colors represent protein-coding genes and light colors represent non-coding genes.
Dramatic changes in expression of spliceosomal proteins in MD oocytes
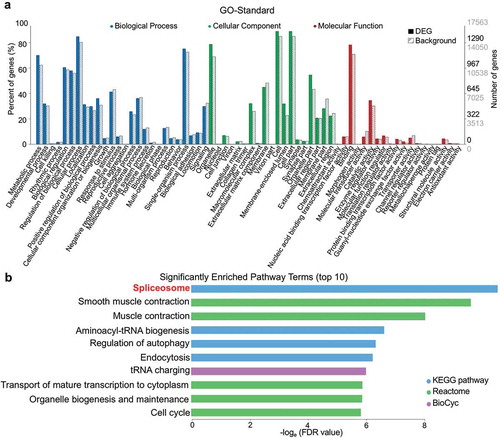
To elucidate the potential impact of DEGs, we performed pathway enrichment analysis by referring to the GO, KEGG, Reactome, BioCyc, and some other repositories. Of the 64 GO terms that differed between MD and MN groups, 19/19/26 were with cellular components, molecular functions, and biological processes, respectively () and Supplementary Table S3). For the database-combined pathway enrichment analysis, 72 pathways (both upregulated and downregulated) were enriched, and we delineate the top 10 in ). Notably, spliceosome (involving 33 DEGs) was the pathway that was most significantly different between MD and MN oocytes.
Figure 2. Enriched GO terms and pathways based on DEGs. (a) Distribution of 64 GO terms according to DEGs. Twenty-six terms of biological process, 19 terms of cellular component, and 19 terms of molecular function are colored blue, green, and red, respectively. Full bars represent the number of DEGs in the recent study; dashed bars represent the numbers of total expressed background genes. Right vertical axis, the numbers of DEGs and background genes; left vertical axis, the percentage of annotated GO-term genes relative to background genes. (b) The top-10 significantly enriched pathway terms (both upregulated and downregulated) according to FDR values.
Pre-mRNA splicing – especially pre-mRNA alternative splicing (AS) – is significantly elaborated in eukaryotes and contributes to increases in the complexity of the proteome, introducing additional layers for regulating gene expression in different cell types and during development [Citation27]. Composed of both proteins and RNAs, the spliceosome executes canonical pre-mRNA splicing by 2 sequential transesterification and splicing reactions ()). In addition to the 130 genes collected in KEGG, we searched over 200 spliceosomal proteins recorded in the literature [Citation28,Citation29]. In 236 detected genes, 49 were differentially expressed (nearly 21%), with 40 genes upregulated and 9 genes downregulated () and Supplementary Table S4).
Figure 3. Pre-mRNA splicing and differentially expressed spliceosomal proteins. (a) Cartoon of a representative splicing cycle. (b) DEGs belong to both core snRNP sub-complexes and regulatory splicing factors. Upregulated genes are presented in red and downregulated genes in green. (c-d) Expression of LSm8 and BRR2 (c), and of SR and hnRNP genes (d). For a clearer display, the vertical axis was adjusted to log2 FPKM, and the same adjustment was used below. Error bar, standard deviation. *, p <0.05. (e-f) Expression pattern of SR proteins (e) and hnRNPs (f) during early embryonic development. 2 C, 2-cell; 4 C, 4-cell; 8 C, 8-cell; M, morula; B, blastocyst. Expression values were calculated as RPKMs (reads per kilobase transcriptome per million reads), which were also used in the original literature.
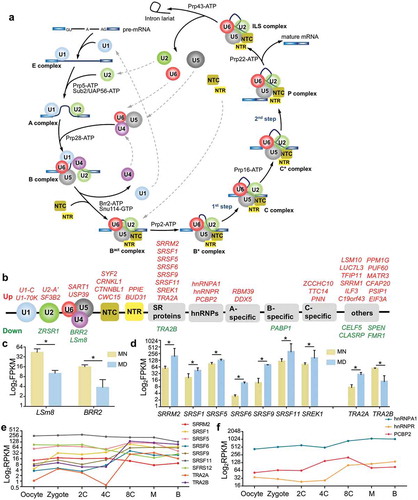
Among core components in constitutive splicing, LSm8/NAA38 was expressed at a 4-fold lower level in MD oocytes ()). LSm8 forms a hetero-heptameric ring with the other 6 LSm proteins in U6 snRNP, and prevents the degradation of the U6 small nuclear RNA (snRNA) by binding to its 3ʹ-end [Citation30]. Since U6 snRNA is the principle catalytic component of the splicing reaction, reduced LSm8 expression likely disturbs the stability of U6 snRNA and impedes the splicing rate. The expression of BRR2 – also termed SNRNP200, the core component of U5 snRNP – was also significantly attenuated (4-fold) in MD oocytes. As a major regulator of the constitutive splicing reaction, BRR2 ATPase unwinds base pairs between U4/U6 snRNAs to promote the activation of the spliceosome [Citation31]; thus, its downregulation would also eliminate the splicing process. In summary, the downregulation of constitutive spliceosomal components in the MD group indicated a dysregulation of pre-mRNA splicing at a global level.
The major regulators of AS are serine-arginine–rich (SR) proteins and heteronuclear ribonucleoproteins (hnRNPs). SR proteins bind to exonic and intronic splicing enhancers (ESEs and ISEs) to promote splice site selection, while hnRNPs recognize exonic and intronic splicing silencers (ESSs and ISSs) and function in an opposite manner [Citation32]. The reciprocal antagonistic actions of SR proteins and hnRNPs regulate the pattern and efficiency of AS. In our MD oocytes, SRRM2, SRSF1/5/6/9/11, SREK1, and TRA2A were expressed aberrantly ()). Interestingly, TRA2A and TRA2B (2 human homologs of Drosophila Tra) were expressed in an inverse fashion ()). In Drosophila, Tra is required for spermatogenesis in the male germ line [Citation33], while mammalian Tra2 proteins are sequence-specific splicing activators that participate in the control of cell-specific splicing patterns [Citation34]. However, whether there are any differences between TRA2A and TRA2B remains to be determined. Our data indicated a potential interoperable role for TRA2A and TRA2B in splicing regulation in oogenesis. Therefore, to further explore the probable functions of these splicing regulators during early embryonic development, we assessed their expression tendencies based upon their published expression profiles [Citation13] (–f)). Surprisingly, the expression of both TRA2A and TRA2B increased dramatically from the 4-cell (4 C) to 8-cell stages (8 C) during human embryonic development ()). This was also the case for hnRNPR ()) – coincident with zygotic genomic activation (ZGA) – suggesting its regulatory role in embryogenesis. AS regulation has been reported to occupy a crucial function in spermatogenesis, although a role in oogenesis has not yet been reported. By discovering the association between spliceosomal components/events and oogenesis, our study provided novel insights into the mechanisms underlying developmental regulation, and opened new areas for further investigation.
Genes with altered AS patterns are specifically associated with cell cycle and metabolic processes
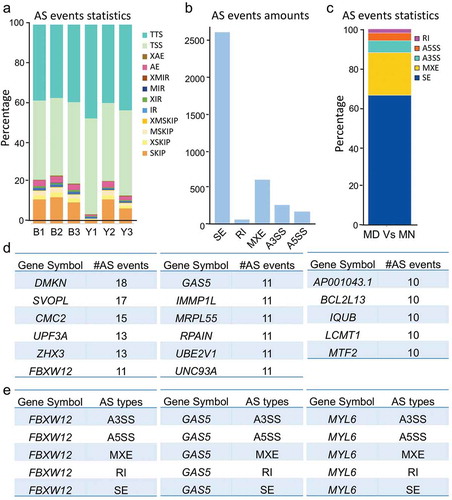
Protein diversity generated from differentiated AS (DAS) is highly correlated with cellular identity [Citation35], and anomalous AS events always portend pathologic outcomes [Citation36]. We thereby speculated that altered expression of spliceosomal proteins led to AS aberrance. Thus, we investigated this hypothesis by analyzing the DAS events between MD and MN oocytes based on exon-exon junction reads, and observed 12 detailed types of AS events across samples ()). Five basic types, i.e., skipped exon (SE), mutually exclusive exon (MXE), alternative 3ʹ splice site (A3SS), alternative 5ʹ splice site (A5SS), and retention intron (RI), were counted and proportioned (–c)). The 2329 genes were differentially spliced into more than 1 alternative isoform, suggesting that at least 1 DAS event occurred for each gene (Supplementary Table S5). Of these, 17 genes possessed more than 10 AS events ()). DMKN (Dermokine) is known for its extensively differential splicing [Citation37], and this is in agreement with our analysis. Three genes, FBXW12, GAS5, and MYL6, contained all 5 basic AS types ()). The lncRNA gene GAS5 (growth arrest specific 5) contained 8 exons from which at least 15 alternatively spliced transcripts were identified, and functional studies have shown an emerging understanding of this gene in cell-cycle balancing and apoptotic regulation [Citation38]. The DAS we observed in our study indicated that it might be associated with oocyte arrest as well.
Figure 4. Changed patterns of alternative splicing (AS) between normal and arrested oocytes. (a) Statistics of 12 detailed AS events for each sample. AE, alternative exon ends; XAE, approximate AE; SKIP, skipped exon; XSKIP, approximate SKIP; MSKIP, multi-exon SKIP; XMSKIP, approximate MSKIP; IR, intron retention; MIR, multi-IR; XMIR, approximate MIR; XIR, approximate IR; TSS, alternative transcriptional start site; TTS, alternative transcriptional terminal site. (b-c) Number (b) and percentage (c) of basic DAS events for MD and MN oocytes. SE, skipped exon; MXE, mutually exclusive exon; A3SS, alternative 3’splice site; A5SS, alternative 5ʹ splice site; RI, retention intron. (d) Genes with 10 or more AS event numbers. (e) FBXW12, GAS5, and MYL6 contained all 5 basic AS types.
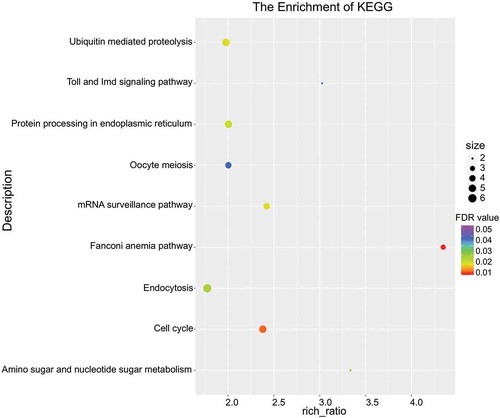
To systematically summarize the impact of altered AS events on gene products and subsequent signaling, we conducted KEGG pathway enrichment analysis for the genes containing DAS events. Nine phenotypes/pathways were enriched, including Fanconi anemia pathway, cell cycle, mRNA surveillance pathway, ubiquitin-mediated proteolysis, protein processing in endoplasmic reticulum, amino sugar and nucleotide sugar metabolism, endocytosis, toll and IMD signaling pathway, and oocyte meiosis (). The disorders in mRNA turnover and DNA/RNA synthesis may indicate that nucleotide metabolism is of great importance before oocyte maturation. Fanconi anemia pathway appears to be a master regulator of genomic integrity that repairs DNA inter-strand crosslinks (ICLs) in the genome, functions in genome maintenance, and coordinates several repair processes [Citation39]. Owing to the evident enrichment of this pathway, we assumed that the genomic integrity of MD oocytes was disturbed to some extent, and that this was probably caused by irregular expression of spliceosomal proteins.
Figure 5. Enriched pathways of genes by DAS. Bubble chart indicating KEGG pathway enrichment for the genes featured by DAS and calculated with FDR values.
Discussion
Initiated in the embryonic stage, oogenesis consists of oocytogenesis, ootidogenesis, and final maturation so as to ultimately form an ovum. Primary oocytes remain arrested in the late diplotene (dictyate) stage of meiotic prophase I for up to 50 years, while transcription is completed and transcripts accumulate. The LH surge during each menstrual cycle then stimulates final oocyte maturation, and mature eggs are ovulated and become competent to be fertilized. This process is so complicated and time consuming that any disturbance would lead to maturation deficiency and infertility. Hereditary and/or environmental factors are currently suspected to lead to oocyte maturation failure, which reflects genomic and/or transcriptomic disorders. In the present study, by performing single human oocyte polyadenylated-RNA sequencing, gene expression profiling, and pathway enrichment analysis, we demonstrated for the first time that some fundamental genes – characterized by spliceosomal proteins and related factors – were differentially expressed between MD and normal MN oocytes; and that the AS modes of many genes were altered as well in MD oocytes.
The MD oocytes we analyzed in this study were from patients who showed complete oocyte maturation failure following standardized or even personalized clinical procedures. This failure in oocyte maturation may be caused by either hereditary or environmental factors, and we herein provided a possible explanation for aberrant gene expression and splicing. Nevertheless, limitations did exist for our study. First, even with the assistance of the most advanced single-cell sequencing, our sample size was relatively small. Extant challenges may be that the maturation block was rather specific in each of the 3 cases and might not be followed by similar expression patterns. This might explain why the RNA expression profile looked different between Y1 and Y2, Y3. Second, we did not retain any cumulus cells or additional oocytes for further experimental validation. Moreover, all the oocytes we saved were to be discarded and no MI oocytes were collected. Therefore, we could not exclude the possibility that the differences we observed might be caused by oocytes being at different stages (MI vs. MII), and this would be done in our following investigation.
Despite these limitations, our current study did provide some transcriptional insights into the process of oocyte meiotic maturation. Because transcription is quiescent and splicing events are comparatively “turned off” when the oocyte approaches the fully grown GV stage and during maturation [Citation40], the aberrant expression of 2107 DEGs was probably from an accumulation at earlier steps such as primordial follicle activation. Among downregulated DEGs, many mitochondrial proteins – including cytochrome c oxidase subunit COX6B1 (subunit 6B1) and COX7C (subunit 7 C), ubiquinol-cytochrome-c reductase complex subunit UQCC2 (assembly factor 2), and ATP synthase complex subunit C14orf2 (6.8 kDa mitochondrial proteolipid) – were most prominently downregulated in MD oocytes (Supplementary Fig. S3A), indicating a high correlation between dysfunction of mitochondrial energy metabolism and abnormal oocyte arrest. Another dramatically decreased gene in MD oocytes was RPL36 (60S ribosomal protein L36, a component of the large ribosomal subunit [Citation41]), whose expression level was only ~2% of that in MN oocytes (Supplementary Fig. S3B). In contrast, expression of the CBP80/20-dependent translation initiation factor CTIF was augmented (Supplementary Fig. S3B), representing abnormal functioning of ribosomal translation in oocyte maturation deficiency.
To expand the number of DEGs, we performed another round of enrichment, observing fold changes >1.5 (or <0.67) and FDR values <0.05 for upregulated and downregulated DEGs separately, and the spliceosome was enriched for both upregulated and downregulated DEGs (Supplementary Tables S6 and S7). Interestingly, other RNA processing pathways, including RNA transport, RNA degradation, and mRNA surveillance, were also enriched, indicating that these pathways were moderately regulated. Owing to the close connection between pre-mRNA splicing and RNA transport [Citation42], we speculated that deficient transcriptional control – especially of pre-mRNA splicing – was intimately related to oocyte maturation incompetence.
Several genes have been previously reported to be responsible for oocyte maturation and fertilization. For example, PATL2 (protein PAT1 homolog 2) is an oocyte-specific translation repressor whose mutations cause oocyte maturation arrest at the GV stage [Citation43,Citation44]. Mutations in TUBB8 (tubulin beta 8 class VIII) impaired meiotic spindle assembly and were responsible for oocyte maturation arrest at the metaphase I (MI) stage [Citation45]. Oocyte-specific kinase WEE2 has been identified as being mutated in the case of fertilization failure [Citation46]. Deficiency in sperm-borne oocyte activation factor PLCZ (phospholipase C zeta) or PAWP (post-acrosomal sheath WW domain-binding protein) accounted for oocyte activation deficiency [Citation47]. Most recently, mutations in hemichannel protein PANX1 (pannexin1) were reported to cause oocyte death [Citation48]. In our study, we demonstrated that transcriptional expression levels differed between MD and MN oocytes. However, without genomic examination, we were not able to conclude whether or not this phenomenon was caused by genetic mutations, and we are therefore currently pursuing this aspect further.
Recently, a case of unexpected repeat immature oocyte response was reported [Citation49], similar to our cases, and herein we therefore tried to provide some clues for this type of primary infertility. Pre-mRNA splicing functions are fundamental to gene expression and regulation, but it is currently difficult to ascertain the primary mechanism(s) underlying oocyte maturation deficiency. Owing to the immense significance of DAS regulation in spermatogenesis, we hypothesize that it is also indispensable for oogenesis. Further investigations are thus needed to confirm how aberrant splicing is connected to oocyte maturation deficiency. Nevertheless, our data illustrate a significant aspect of gene regulation in oocyte maturation, and provide further opportunity for identifying biomarkers of oocyte quality.
Author contributions
This work was performed by all authors. J.H. and J.Q. conceived and designed the study; J.L. and M.L. collected the oocytes and performed the experiments; J.H. and P.Z. performed the data analysis and wrote the manuscript; and E.H., X.L., X.X., Z.W., and Y.F. contributed to sample collection and data analysis.
Supplemental Material
Download Zip (858.8 KB)Disclosure statement
The authors assert that they have no potential conflicts of interest.
Supplementary material
Supplemental data for this article can be accessed here.
Additional information
Funding
References
- Santos MA, Kuijk EW, Macklon NS. The impact of ovarian stimulation for IVF on the developing embryo. Reproduction. 2010;139(1):23–34.
- Von Stetina JR, Orr-Weaver TL. Developmental control of oocyte maturation and egg activation in metazoan models. Cold Spring Harb Perspect Biol. 2011;3(10):a005553.
- Coticchio G, Dal Canto M, Mignini Renzini M, et al. Oocyte maturation: gamete-somatic cells interactions, meiotic resumption, cytoskeletal dynamics and cytoplasmic reorganization. Hum Reprod Update. 2015;21(4):427–454.
- Li R, Albertini DF. The road to maturation: somatic cell interaction and self-organization of the mammalian oocyte. Nat Rev Mol Cell Biol. 2013;14(3):141–152.
- Coticchio G, Albertini DF, De Santis L. oogenesis. 2013.
- Chang HM, Qiao J, Leung PC. Oocyte-somatic cell interactions in the human ovary-novel role of bone morphogenetic proteins and growth differentiation factors. Hum Reprod Update. 2016;23(1):1–18.
- Mehlmann LM. Stops and starts in mammalian oocytes: recent advances in understanding the regulation of meiotic arrest and oocyte maturation. Reproduction. 2005;130(6):791–799.
- Clarke HJ. Post-transcriptional control of gene expression during mouse oogenesis. Results Probl Cell Differ. 2012;55:1–21.
- Seydoux G, Braun RE. Pathway to totipotency: lessons from germ cells. Cell. 2006;127(5):891–904.
- Tang F, Barbacioru C, Wang Y, et al. mRNA-Seq whole-transcriptome analysis of a single cell. Nat Methods. 2009;6(5):377–382.
- Xue Z, Huang K, Cai C, et al. Genetic programs in human and mouse early embryos revealed by single-cell RNA sequencing. Nature. 2013;500(7464):593–597.
- Grondahl ML, Borup R, Vikesa J, et al. The dormant and the fully competent oocyte: comparing the transcriptome of human oocytes from primordial follicles and in metaphase II. Mol Hum Reprod. 2013;19(9):600–617.
- Yan L, Yang M, Guo H, et al. Single-cell RNA-Seq profiling of human preimplantation embryos and embryonic stem cells. Nat Struct Mol Biol. 2013;20(9):1131–1139.
- Zhao H, Li T, Zhao Y, et al. Single-cell transcriptomics of human oocytes: environment-driven metabolic competition and compensatory mechanisms during oocyte maturation. Antioxid Redox Signal. 2018;30(4):542–559.
- Reyes JM, Silva E, Chitwood JL, et al. Differing molecular response of young and advanced maternal age human oocytes to IVM. Hum Reprod. 2017;32(11):2199–2208.
- Ruebel ML, Schall PZ, Midic U, et al. Transcriptome analysis of rhesus monkey failed-to-mature oocytes: deficiencies in transcriptional regulation and cytoplasmic maturation of the oocyte mRNA population. Mol Hum Reprod. 2018;24(10):478–494.
- Braunschweig U, Gueroussov S, Plocik AM, et al. Dynamic integration of splicing within gene regulatory pathways. Cell. 2013;152(6):1252–1269.
- Cooper TA, Wan L, Dreyfuss G. RNA and disease. Cell. 2009;136(4):777–793.
- Salisbury J, Hutchison KW, Wigglesworth K, et al. Probe-level analysis of expression microarrays characterizes isoform-specific degradation during mouse oocyte maturation. PLoS One. 2009;4(10):e7479.
- Kasowitz SD, Ma J, Anderson SJ, et al. Nuclear m6A reader YTHDC1 regulates alternative polyadenylation and splicing during mouse oocyte development. PLoS Genet. 2018;14(5):e1007412.
- Do DV, Strauss B, Cukuroglu E, et al. SRSF3 maintains transcriptome integrity in oocytes by regulation of alternative splicing and transposable elements. Cell Discov. 2018;4:33.
- Patel RK, Jain M. NGS QC Toolkit: a toolkit for quality control of next generation sequencing data. PLoS One. 2012;7(2):e30619.
- Kim D, Langmead B, Salzberg SL. HISAT: a fast spliced aligner with low memory requirements. Nat Methods. 2015;12(4):357–360.
- Trapnell C, Roberts A, Goff L, et al. Differential gene and transcript expression analysis of RNA-seq experiments with TopHat and Cufflinks. Nat Protoc. 2012;7(3):562–578.
- Florea L, Song L, Salzberg SL. Thousands of exon skipping events differentiate among splicing patterns in sixteen human tissues. F1000Res. 2013;2:188.
- Shen S, Park JW, Lu ZX, et al. rMATS: robust and flexible detection of differential alternative splicing from replicate RNA-Seq data. Proc Natl Acad Sci U S A. 2014;111(51):E5593–601.
- Blencowe BJ. The relationship between alternative splicing and proteomic complexity. Trends Biochem Sci. 2017;42(6):407–408.
- Bessonov S, Anokhina M, Will CL, et al. Isolation of an active step I spliceosome and composition of its RNP core. Nature. 2008;452(7189):846–850.
- Jurica MS, Licklider LJ, Gygi SR, et al. Purification and characterization of native spliceosomes suitable for three-dimensional structural analysis. RNA. 2002;8(4):426–439.
- Zhou L, Hang J, Zhou Y, et al. Crystal structures of the Lsm complex bound to the 3ʹ end sequence of U6 small nuclear RNA. Nature. 2014;506(7486):116–120.
- Mozaffari-Jovin S, Wandersleben T, Santos KF, et al. Inhibition of RNA helicase Brr2 by the C-terminal tail of the spliceosomal protein Prp8. Science. 2013;341(6141):80–84.
- Bourgeois CF, Lejeune F, Stevenin J. Broad specificity of SR (serine/arginine) proteins in the regulation of alternative splicing of pre-messenger RNA. Prog Nucleic Acid Res Mol Biol. 2004;78:37–88.
- Amrein H, Hedley ML, Maniatis T. The role of specific protein-RNA and protein-protein interactions in positive and negative control of pre-mRNA splicing by transformer 2. Cell. 1994;76(4):735–746.
- Tacke R, Tohyama M, Ogawa S, et al. Human Tra2 proteins are sequence-specific activators of pre-mRNA splicing. Cell. 1998;93(1):139–148.
- Matlin AJ, Clark F, Smith CW. Understanding alternative splicing: towards a cellular code. Nat Rev Mol Cell Biol. 2005;6(5):386–398.
- Caceres JF, Kornblihtt AR. Alternative splicing: multiple control mechanisms and involvement in human disease. Trends Genet. 2002;18(4):186–193.
- Naso MF, Liang B, Huang CC, et al. Dermokine: an extensively differentially spliced gene expressed in epithelial cells. J Invest Dermatol. 2007;127(7):1622–1631.
- Xu C, Zhang Y, Wang Q, et al. Long non-coding RNA GAS5 controls human embryonic stem cell self-renewal by maintaining NODAL signalling. Nat Commun. 2016;7:13287.
- Ceccaldi R, Sarangi P, D’Andrea AD. The Fanconi anaemia pathway: new players and new functions. Nat Rev Mol Cell Biol. 2016;17(6):337–349.
- Edson MA, Nagaraja AK, Matzuk MM. The mammalian ovary from genesis to revelation. Endocr Rev. 2009;30(6):624–712.
- Khatter H, Myasnikov AG, Natchiar SK, et al. Structure of the human 80S ribosome. Nature. 2015;520(7549):640–645.
- Reed R, Hurt E. A conserved mRNA export machinery coupled to pre-mRNA splicing. Cell. 2002;108(4):523–531.
- Maddirevula S, Coskun S, Alhassan S, et al. female infertility caused by mutations in the oocyte-specific translational repressor PATL2. Am J Hum Genet. 2017;101(4):603–608.
- Chen B, Zhang Z, Sun X, et al. Biallelic mutations in PATL2 cause female infertility characterized by oocyte maturation arrest. Am J Hum Genet. 2017;101(4):609–615.
- Feng R, Sang Q, Kuang Y, et al. Mutations in TUBB8 and human oocyte meiotic arrest. N Engl J Med. 2016;374(3):223–232.
- Sang Q, Li B, Kuang Y, et al. Homozygous mutations in WEE2 cause fertilization failure and female infertility. Am J Hum Genet. 2018;102(4):649–657.
- Yeste M, Jones C, Amdani SN, et al. Oocyte activation deficiency: a role for an oocyte contribution? Hum Reprod Update. 2016;22(1):23–47.
- Sang Q, Zhang Z, Shi J, et al. A pannexin 1 channelopathy causes human oocyte death. Sci Transl Med. 2019;11(485). DOI:https://doi.org/10.1126/scitranslmed.aav8731.
- Mishra V, Chirumamilla L. Unexpected repeat immature oocyte response after IVF stimulation: a case report. Gynecol Endocrinol. 2018;34(2):100–102.