
ABSTRACT
Sunitinib is the most commonly used first-line therapy for the treatment of advanced renal cell carcinoma (RCC), but intrinsic and extrinsic resistance to targeted therapies dramatically compromise the benefit of clinical outcome. Dissecting the underlying mechanisms and discovering reliable predictive biomarkers are urgently needed in clinic. Here, we discovered miR-885-5p was notably decreased after sunitinib treatment and associated with poor disease progression in clear cell renal cell carcinoma (ccRCC). In vitro and in vivo studies identified miR-885-5p inhibition contributed to sunitinib resistance. Mechanistically, sunitinib treatment reduced GATA1 expression, which in turn reduced its binding to MIR885 promoter and resulted in miR-885-5p downregulation in transcriptional level. In addition, PLIN3 was confirmed to be directly targeted by miR-885-5p and its upregulation significantly increased lipid droplets formation to decrease sunitinib sensitivity. Therefore, GATA1/miR-885-5p/ PLIN3 pathway may serve as a potential therapeutic strategy and a biomarker for sunitinib treatment in ccRCC.
KEYWORDS:
Introduction
Clear cell renal cell carcinoma (ccRCC), the most common and lethal subtype of kidney cancer, is responsible for over 140,000 estimated deaths annually worldwide [Citation1]. Morphologically, ccRCC is characterized by high lipid and glycogen content that gives rise to its name, which implicates altered fatty acid and glucose metabolism in the development of ccRCC [Citation2]. Genetically, up to 91% ccRCC have sporadic von Hippel-Lindau (VHL) tumor suppressor gene mutation [Citation3]. VHL is the substrate recognition component of an E3 ubiquitin ligase complex that targets prolyl-hydroxylated α subunit of hypoxia-inducible factors (HIF) for proteasome degradation [Citation4]. Consequently, VHL mutation in ccRCC results in constitutive activation of HIF1/2α and subsequent transactivation of downstream genes regulating angiogenesis that provides access to extracellular nutrients and oxygen through an increased blood supply for tumor growth [Citation5,Citation6]. Thus, dozens of angiogenesis inhibitors are being applicated in pre-clinical and clinical trials.
Sunitinib is an oral, multi-targeted receptor tyrosine kinase (RTK) inhibitor of vascular endothelial growth factor receptors (VEGFR), platelet-derived growth factor receptors (PDGFR), and other RTKs with direct antitumor and antiangiogenic activity [Citation7]. Phase II trials of sunitinib with metastatic RCC (mRCC) showed the objective response rate (ORR) was 34%-46%, the median progression-free survival (PFS) was 8.3–22.4 months [Citation8–Citation11]. A randomized, phase III trial of 750 treatment-naive patients with metastatic ccRCC demonstrated superiority of sunitinib over interferon α (IFN-α) as first-line treatment for mRCC [Citation12]. The median overall survival (OS) was 26.4 verse 21.8 months and the ORR was 47% for sunitinib compared with 12% for IFN-α (P < 0.001). These clinical trials have identified the efficacy of sunitinib as the first-line treatment for advanced RCC. However, 30% of the patients are inherently refractory to sunitinib and the remaining 70% who respond initially will eventually become resistant in 6–15 months, resulting in restoration of tumor growth and progression [Citation13]. Although studies have proposed the activation of compensatory signaling pathways [Citation14], evasive and intrinsic resistance [Citation15] and metabolic reprogramming [Citation16], for the acquisition of sunitinib resistance, the in-depth exploring of predictive markers for sunitinib response to develop effective therapy is urgently needed for understanding the underlying mechanisms of sunitinib resistance.
MicroRNAs are small noncoding RNAs that regulate gene expression by inducing degradation of target messenger RNAs (mRNA) [Citation17]. There is increasing evidences that MicroRNAs have regulatory functions on sunitinib sensitivity in RCC [Citation18]. Prior et al. identified high expression of miR-942, miR-628-5p, miR-133a, and miR-484 was significantly associated with decreased time to progression and overall survival in mRCC tissues [Citation19]. Angelo et al. revealed 28 miRNAs and 23 miRNAs related to poor response and prolonged response to sunitinib treatment, respectively [Citation20]. miR-885-5p was first identified overexpressed in multiple endocrine neoplasia type 2-associated pheochromocytomas [Citation21]. Previous studies showed that miR-885-5p was upregulated in ccRCC. However, the role of miR-885-5p on sunitinib sensitivity in ccRCC is still unknown. In this study, we investigate the contributions of miR-885-5p to sunitinib resistance and explore its underlying mechanisms in ccRCC.
Results
Sunitinib treatment dramatically decreases miR-885-5p expression in ccRCC cell lines and tumor specimens
We analyzed the expression of miR-885-5p in a panel of human ccRCC cell lines with sunitinib resistance and parental control cell lines. Contrary to its upregulation in ccRCC, sunitinib treatment dramatically decreased miR-885-5p expression level compared with parental control cell lines ()). We next explored miR-885-5p expression in clinical settings. Consistent with the downregulation of miR-885-5p in sunitinib-resistant cells, miR-885-5p expression level was significantly lower after sunitinib treatment ()). As shown in ), the average expression level of miR-885-5p was lower in patients who suffered from progressive disease (PD) during sunitinib therapy than those without PD (non-PD). Moreover, Kaplan-Meier analysis showed that low miR-885-5p expression level was correlated with reduced progression-free survival (PFS) in sunitinib-treated ccRCC patients ()). Taken together, these results showed that miR-885-5p was downregulated after sunitinib treatment and served as a poor predicator for sunitinib response in ccRCC patients.
Figure 1. Sunitinib treatment decreases miR-885-5p expression and correlates with clinical outcome in ccRCC. (a) Relative expression of miR-885-5p in sunitinib-resistant ccRCC cell lines and their parental cell lines; (b) Relative expression of miR-885-5p in ccRCC patients before and after sunitinib treatment; (c) Relative expression of miR-885-5p in ccRCC patients with PD (n = 28) or non-PD (n = 26) during sunitinib treatment; (d) Kaplan-Meier analyses of the correlation between miR-885-5p expression level and progression-free survival of 54 patients. Results are showed as mean ± SD or min to max of three independent experiments. **P < 0.01, ***P < 0.001.
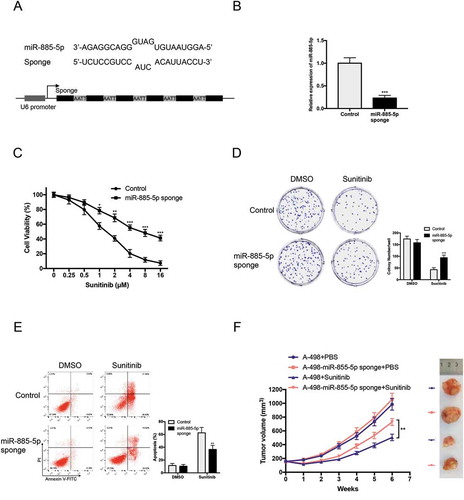
Figure 2. miR-885-5p inhibition promotes sunitinib resistance in ccRCC cell line. (a) Design of miR-885-5p sponge; (b) Validation of miR-885-5p inhibition by miR-885-5p sponge in A-498 cells via qRT-PCR; (c) Cell viability assay of miR-885-5p sponged and control A-498 cells with sunitinib treatment at indicated concentrations for 48 h; (d) Colony formation assay of miR-885-5p sponged and control A-498 cells with sunitinib treatment 2 µM in 6-well plate 500 cells per well for 2 weeks; (e) Apoptosis assay of miR-885-5p sponged and control A-498 cells with sunitinib treatment 2 µM for 24 h; (f) Tumor volume of nude mice that were subcutaneously xenografted with miR-885-5p sponged or control A-498 cells and orally with PBS or sunitinib daily 40 mg/kg (n = 5 per group). Results are presented as mean ± SD of three independent experiments. *P < 0.05, **P < 0.01, ***P < 0.001.
miR-885-5p inhibition promotes sunitinib resistance
To confirm whether miR-885-5p modulated sunitinib sensitivity, we firstly established a stable ccRCC cell line with miR-885-5p knockdown. As showed in ), we constructed miR-885-5p sponges by inserting six miR-885-5p binding site repeats with a bulge to protect against endonucleolytic cleavage by Argonaute 2 [Citation22]. qRT-PCR results demonstrated that the efficiency of miRNA sponges in miR-885-5p inhibition ()). Cell viability assay and colony formation assay suggested that miR-885-5p sponged A-498 cells exhibited higher tolerance upon sunitinib treatment (,)). Similarly, miR-885-5p sponged A-498 cells performed more anti-apoptosis ability than parental cells ()). Moreover, miR-885-5p knockdown significantly increased sunitinib resistance of A-498 xenografts in vivo ()). These results indicated that miR-885-5p inhibition promotes sunitinib resistance in ccRCC cells.
GATA1 is responsible for miR-885-5p downregulation by binding its promoter in ccRCC cells
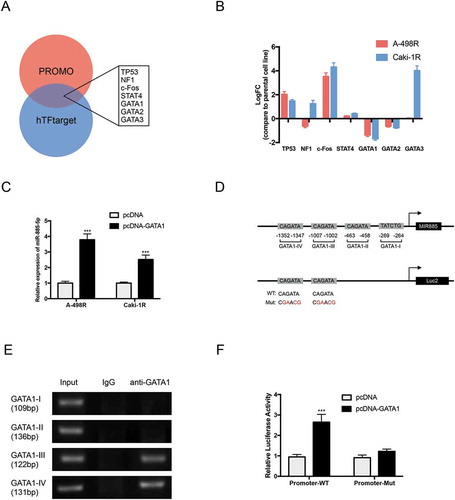
We next investigated the underlying mechanism for miR-885-5p downregulation in sunitinib-resistant ccRCC cells. Bioinformatics analysis by PROMO and hTFtarget predicted six most putative transcriptional factors binding to the promoter region (−3000 bp) of miR-885-5p, including TP53, NF1 (Neurofibromin 1), c-Fos, STAT4, GATA1 and GATA2 ()). As the DNA binding motif of GATA3 shows high similar with that of GATA1 and GATA2, we took GATA3 in the putative transcriptional factor group. As showed in ), the expression level of GATA1 was the most significantly decreased in sunitinib-resistant cell lines. Consistently, overexpression of GATA1 prominently upregulated miR-885-5p expression ()). PROMO predicated four putative GATA1 binding sites with miR-885-5p promoter () up). Chromatin immunoprecipitation (ChIP) assay with anti-GATA1 antibody confirmed GATA1 could bind to GATA1-III and GATA1-IV binding sites in miR-885-5p sponged A-498 cells ()). Moreover, GATA1 overexpression increased wild type miR-885-5p promoter transcriptional activity but not that with the mutated miR-885-5p promoter in A-498 cells () down and )). Together, these results suggested that sunitinib induced GATA1 downregulation was responsible for miR-885-5p downregulation by binding its promoter in ccRCC cells.
Figure 3. GATA1 is responsible for miR-885-5p downregulation by binding its promoter in ccRCC cells. (a) Putative upstream transcriptional factors of MIR885 promoter from predication database, PROMO and hTFtarget; (b) Relative expression of putative transcriptional factors in sunitinib-resistant ccRCC cell lines compared with parental cell lines via qRT-PCR; (c) Forced expression of GATA1 increased miR-885-5p expression level; (d) Putative binding sites of GATA1 with MIR885 promoter (up) and constructed luciferase vector with WT or Mut-GATA1 binding sites (down); (e) Lysates of miR-885-5p sponged A-498 cells were subjected to ChIP-PCR assay and electrophoresed in 2% agarose gel; (f) Luciferase assay in miR-885-5p sponged A-498 cells. Results are showed as mean ± SD of three independent experiments. ***P < 0.001.
PLIN3 is the direct target of miR-885-5p
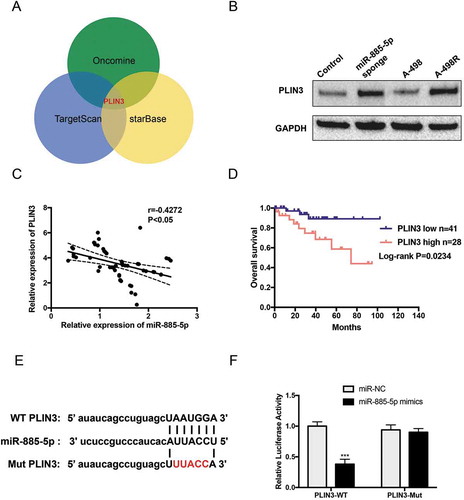
To identify specific miR-885-5p downstream targets, we combined miRNA target-prediction algorithms (TargetScan and starBase) with the 10% Top overexpression gene of sunitinib resistance in ccRCC from Oncomine and found PLIN3 was one of the potential targets ()). Western blot showed that PLIN3 expression levels were significantly upregulated in miR-885-5p sponged and sunitinib-resistant A-498 cells ()). The observation from 54 enrolled patients further revealed a significant negative correlation between levels of miR-885-5p and PLIN3 ()). Moreover, we obtained the expression value of PLIN3 and overall survival of 69 cc RCC patients from Oncomine (Table S2). Kaplan-Meier survival analysis certified that patients with higher PLIN3 levels had poor overall survival time than those with lower PLIN3 levels ()). In the end, we constructed luciferase vectors with wild type and mutated 3’ UTR miR-885-5p binding site of PLIN3 ()). The luciferase activity was significantly reduced upon miR-885-5p mimics transfection in PLIN3-WT group, but the PLIN3-Mut group remained unchanged ()). In all, the results above demonstrated that PLIN3 was the direct target of miR-885-5p and miR-885-5p downregulation increased PLIN3 levels in ccRCC with sunitinib treatment.
Figure 4. PLIN3 is the direct target of miR-885-5p. (a) Combination prediction of PLIN3 as a putative downstream target of miR-885-5p from database, Targetscan, starBase and Oncomine; (b) Western blot analysis of PLIN3 expression level; (c) The correlation between the expression of miR-885-5p and PLIN3 in ccRCC patients’ tumor specimen during sunitinib treatment (n = 54); (d) PLIN3 expression and overall survival from TCGA ccRCC dataset from Oncomine; (e) The schematic illustration of predicted binding sites of miR-885-5p with the wild type and mutated 3’-UTR of PLIN3 mRNA; (f) Luciferase reporter assay of wild type and mutated 3’-UTR of PLIN3 mRNA in A-498 cells. Data are presented as mean ± SD of three independent experiments. ***P < 0.001.
PLIN3 upregulation contributes sunitinib resistance by promoting lipid droplets formation
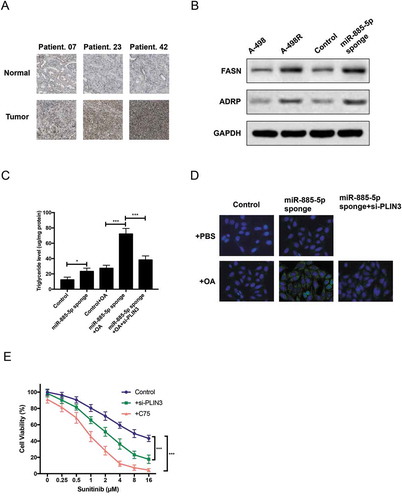
We further explored the role of PLIN3 in ccRCC with sunitinib treatment. Firstly, IHC staining confirmed PLIN3 upregulation in ccRCC patients with sunitinib treatment ()). Secondly, as PLIN3 functions in the biogenesis of lipid droplets [Citation23], we examined the expression of two lipid biogenesis markers, FASN (fatty acid synthase) and ADRP (Adipophilin). Western blot identified that the expression of FASN and ADRP was significantly increased in miR-885-5p sponged and sunitinib-resistant A-498 cells ()). Thirdly, the concentration of triglyceride and neutral lipid were much higher in miR-885-5p sponged A-498 cells with or without oleic acid (OA) feeding, and PLIN3 knockdown with siRNA notably reduced triglyceride concentration and neutral lipid in OA-feeded miR-885-5p sponged A-498 cells (,)). Finally, cell viability assay found that PLIN3 knockdown or FASN inhibition by C75 obviously reduced sunitinib tolerance of miR-885-5p sponged A-498 cells ()). Overall, these data clearly demonstrated that PLIN3 contributed to sunitinib resistance by increasing lipid droplet biogenesis.
Figure 5. PLIN3 upregulation contributes sunitinib resistance by promoting lipid droplets formation. (a) IHC staining of PLIN3 expression in ccRCC tumor tissues versus adjacent normal tissues (×200); (b)Western blot analysis of FASN fatty acid synthase. and ADRP Adipophilin. expression level; (c) Triglyceride concentration in miR-885-5p sponged and control A-498 cells at steady state or after oleic acid OA feeding; (d) LipidTox staining of miR-885-5p sponged and control A-498 cells at steady state or after OA feeding; (e) Cell viability assay of miR-885-5p sponged A-498 cells with PLIN3 knockdown (30 µM si-PLIN3) or FASN inhibition (10 µM C75). Data are showed as mean ± SD of three independent experiments. *P < 0.05, ***P < 0.001.
Discussion
RCC patients treated with sunitinib generally respond initially, but usually develop resistance to therapy. Hence, there is a need for better understanding of mechanisms by which RCC evolves to escape sunitinib treatment and exploring novel biomarkers for predicating sunitinib resistance. In this study, we discovered miR-885-5p was notably decreased after sunitinib treatment and associated with poor disease progression in ccRCC. In vitro and in vivo studies identified miR-885-5p inhibition contributed to sunitinib resistance. Mechanistically, sunitinib treatment reduced GATA1 expression, which in turn reduced its binding to MIR885 promoter and resulted in miR-885-5p downregulation in transcriptional level. In addition, PLIN3 was confirmed to be directly targeted by miR-885-5p and its upregulation significantly increased lipid droplets formation to decrease sunitinib sensitivity. Thus, GATA1/miR-885-5p/ PLIN3 pathway was verified to play a critical role in sunitinib resistance.
GATA, a critical hematopoietic transcription factor, has also been found to regulate serval miRNAs by binding the miRNA upstream locus and activated its transcription [Citation24,Citation25]. We observed that sunitinib treatment of ccRCC cells leads to GATA1 downregulation and altered expression of miR-885-5p (). Previous reports demonstrated that miR-885-5p functioned as a tumor suppressor in a multiple of cancers, including osteosarcoma, papillary thyroid carcinoma, hepatocellular carcinoma, neuroblastoma [Citation26–Citation29]. However, overexpression of miR-885-5p significantly induced colorectal cancer cells liver and lung metastases [Citation30] Interestingly, the levels of miR-885-5p were significantly higher in sera from patients with HCC, liver cirrhosis, chronic hepatitis B and its levels associated inversely with extra-large high-density lipoproteins cholesterol levels [Citation31,Citation32]. This may implicate the role of miR-885-5p in regulating lipid metabolism. Our results demonstrated that miR-885-5p inhibition via miRNA sponges promoted sunitinib resistance (). In addition, we also provide evidence for using C75, a pharmacological FASN inhibitor [Citation33], to restore sunitinib response in miR-885-5p inhibition-mediated resistance ()). These results suggested that miR-885-5p was highly correlated with lipid metabolism to modulate sunitinib response in ccRCC patients.
Integrated mRNA expression and proteomic data from TCGA suggested a global metabolic shift that involved increased dependence on the pentose phosphate shunt, decreased activities of AMP-activated protein kinase (AMPK) and the Krebs cycle, increased glutamine transport and higher fatty acid production, which all correlate with disease aggressiveness [Citation34]. Moreover, ccRCC cells adapted to vascular endothelial growth factor blockade through a metabolic shift toward carbohydrate and lipid metabolism in tumors [Citation35]. PLIN3 (perilipin-3, formerly called TIP47), one of the members of the perilipin family, has been reported to be involved in the lipid storage, lipid mobilization and lipid droplet biogenesis [Citation36]. Previous study has confirmed that elevated PLIN3 expression predicted poor disease-free survival and overall survival in ccRCC [Citation37]. However, the underlying mechanisms haven’t yet been elucidated. Here, we unraveled that elevated PLIN3 expression was due to miR-885-5p downregulation induced by sunitinib treatment (). Consequently, PLIN3 contributed to sunitinib resistance by promoting lipid droplet biogenesis in ccRCC. Lipid droplets (LDs) are lipids-storage cellular organelles and sources of essential substrates for myriad cellular processes [Citation38]. Importantly, LDs could sequester toxic lipids, such as fatty acids, cholesterol and ceramides, thereby protecting against oxidative stress and preventing lipotoxic cell damage in solid tumor cancer cells [Citation39]. One hallmark feature of ccRCC is intracellular LDs-laden, which has a typical yellow surface due to the high lipid content of the cell [Citation40]. Former researches have consolidated that intrinsic or hypoxic stress could lead to increased fatty acid saturation [Citation41,Citation42]. Worsely, antiangiogenic therapy, like sunitinib, may further exacerbate these situations. Hence, accumulation of LDs in cancer cells acts as a pivotal adaptive response to harmful conditions, such as endoplasmic reticulum (ER) stress, reactive oxygen species (ROS) and drug toxicity [Citation43]. Consistent with its role on anti-stress, LD formation was increased upon sunitinib treatment in our research ().
In conclusion, our findings demonstrate miR-885-5p downregulation is a poor indicator of sunitinib treatment in ccRCC and the importance of lipid droplet biogenesis in regulating sunitinib response, which provides evidence for predicating clinical outcome and adopting combined therapies for the benefits of ccRCC patients.
Materials and methods
Patients and tissue specimens
Paired tumor and adjacent normal tissues were obtained from 54 patients with ccRCC () from December 2014 to September 2017 in the Department of Urology, the First Affiliated Hospital of Harbin Medical University, Harbin, China. Fresh samples were frozen and stored in liquid nitrogen. Informed consent was obtained from patients and the study was approved by the Research Ethics Committee of the First Affiliated Hospital of Harbin Medical University.
Table 1. Correlation of miR-885-5p expression and clinical characteristics of 54 ccRCC patients.
Cell culture and construction
A panel of human ccRCC cell lines, including 786-O, A-498, Caki-1 and OS-RC-2, were purchased from the Committee on Type Culture Collection of Chinese Academy of Sciences (Shanghai, China). A-498 cells were cultured in EMEM and supplemented with 2 mM glutamine, 1% non-essential amino acids,1 mM sodium pyruvate, 10% fetal bovine serum (FBS) (Gibco) in a humidified incubator containing 5% CO2 at 37°C. Human ccRCC sunitinib-resistant cell lines were selected by continuous exposure to increasing concentrations (0.25 µM to 2 µM) of sunitinib and finally cultured in 2 µM sunitinib to maintain sunitinib resistance. miR-885-5p sponged A-498 cell line was constructed by infection of lentivirus containing miR-885-5p sponge repeats ()) and selected by puromycin.
RNA isolation and real-time quantitative PCR
Total RNA was isolated from patients’ specimen or cultured cells using Trizol reagent and treated with DNase I (Invitrogen) following the manufacturer’s instructions. MiR-885-5p was transcribed and quantified by All-in-OneTM miRNA qRT-PCR Detection Kit (QP016, GeneCopoeiaTM). For the detection of protein coding mRNA, the SuperScriptTM III (18,080,051, Invitrogen) and SYBRTM Green PCR Master Mix (4,368,577, Applied Biosystems) were used to reverse transcript the complementary DNA and quantify, respectively. qRT-PCR was performed using an QuantStudio 5 System (Thermo Lifetech). The primers were listed in Table S1.
Cell viability assay
Cell viability of ccRCC cells was determined by Cell Counting Kit 8 (Solarbio). Cells were seeded at a density of 5 × 10³ cells per well in 96-well culture plates. 24 h later, cells were treated with indicated gefitinib concentration in a final volume of 100 μl for 72 hours. 10 µl CCK-8 solution was added into each well and measured at OD450 nm with Varioskan LUX multimode reader (Thermo Fisher) after incubation for 30 minutes at 37°C. All experiments were conducted in triplicate.
Colony formation assay
miR-885-5p sponged and control A-498 cells were plated in 6-well culture dishes at a density of 500 cells/well. Cells were treated with 2 μM sunitinib for 2 weeks. Cells were stained with crystal violet on the plates. Cell colonies were photographed under an inverted microscope (DM IL, Leica).
Apoptosis assay
Cell apoptosis analyses were performed using Annexin V-FITC/PI Apoptosis Detection Kit (DOJINDO). Cells were seeded in 6-well plates at 1 × 10⁶ per well. The next day, cells were treated with 2 μM sunitinib. 24 h after transfection, cells were harvested and resuspended at 1 × 10⁶ in 100 μl volume. Cells were labeled with 5 μl Annexin V and 5 μl PI for 15 minutes in dark place. 400 μl 1× Annexin V Binding Solution was added and the samples were detected by flow cytometry (CytoFLEX FCM, Beckman) within one hour.
Animal xenograft experiment
4–6 weeks old male athymic BALB/c nude mice (Vitalstar Biotechnology, Beijing, China) were housed and fed in standard pathogen-free conditions. 2 × 10⁶ cells miR-885-5p sponged and control A-498 cells were injected subcutaneously into the flanks of nude mice. When the volume of xenograft reached 150 mm3, mice were orally treated with PBS or sunitinib (40 mg/kg/day). Tumor growth was examined every week, and tumor volume was calculated using the equation V = 0.5 × D × d2 (V, volume; D, longitudinal diameter; d, latitudinal diameter). Mice were sacrificed when the volume of xenograft reached 1000 mm3.
Chromatin immunoprecipitation assay (ChIP)
ChIP assays were performed using EZ-CHIPTM Chromatin Immunoprecipitation Kit (17–371, Millipore) according to instruction. MiR-885-5p sponged A-498 cells were cross-linked and sonicated. Chromatin was immunoprecipitated with anti-GATA1 (sc-265, Santa Cruz) and analyzed by PCR. The PCR products were electrophoresed in 2% agarose gel and photographed by BIO-RAD ChemiDoc XRS. The primers used for PCR in this study were listed in Table S1.
Luciferase reporter assay
For luciferase assay in miR-885-5p sponged A-498 cells, wild type or mutated MIR885 promoter was inserted in pGL4.1 vector (Promega). A-498 cells were seeded the day before, and co-transfected with pGL4.1 vector and pcDNA3.1-GATA1 or empty vector using lipofectamine 2000 (Invitrogen). For luciferase reporter assay of wild type and mutated 3’-UTR of PLIN3 mRNA in A-498 cells, wild type and mutated 3’-UTR of PLIN3 was inserted in pMIR-Reporter vector (Promega). A-498 cells were seeded the day before, and co-transfected with pMIR-Reporter vector and miR-885-5p mimics (Sangon, Shanghai) or negative control using lipofectamine 2000. Luciferase activity was detected by Dual-Luciferase Reporter Assay System (Promega) after 48 h of transfection. Renilla luciferase activity was normalized against Firefly luciferase activity.
Western blot
Protein from cell lines were lysed using RIPA protein extraction reagent (Beyotime, Beijing) supplemented with a protease inhibitor cocktail (Roche) and PMSF (Roche). Cell lysates were analyzed by immunoblot with primary antibodies, anti-PLIN3 (10,694-1-AP, Proteintech), FASN (3180, CST), ADRP (15294-1-AP, Proteintech), and goat anti-rabbit IgG-HRP second antibody (7074, CST). The protein band was photographed by BIO-RAD ChemiDoc XRS.
Immunohistochemistry staining
Immunohistochemistry staining was done on 5 µm-thick sections from paraffin embedded tissues. Sections were deparaffinized, rehydrated, and followed by antigen retrieval. The tissue sections were immunostained with primary antibody, anti-PLIN3 (10,694-1-AP, Proteintech), and goat anti-rabbit IgG-HRP second antibody (7074, CST).
LipidTox staining
Staining of lipid droplets was performed using HCS LipidTox™ Deep Green neutral lipid stain (H34475, Invitrogen) according to manufacturer’s instructions. miR-885-5p sponged and control A-498 cells were plated in 6-well culture dishes, and fed with or without 400 µM oleic acid for 48 h before staining.
Statistical analysis
All data were showed as mean ± SD values or Min to Max values using the GraphPad Prism software 7.0. The significance of differences between two groups was determined using a two-sided Student’s t-test. In case of multiple tests, one-way ANOVA followed by Bonferroni-Holm procedure was applied. Survival curves were plotted by the Kaplan–Meier method and compared by the log-rank test. Correlation was performed using two-tailed Spearman’s test. P ≤ 0.05 was considered statistically significant.
Author’s contributions
D.Y., Z.L. and Y.X. conceived and designed the experiments; D.Y., S.X., C.J. and W.Z. performed the experiments; D.Y. and W.L. analyzed the data; D.Y and Y.X. wrote the paper.
Supplemental Material
Download MS Word (23.5 KB)Disclosure statement
The authors declare no conflict of interest.
Supplementary material
Supplemental data for this article can be accessed here.
Additional information
Funding
References
- Huang Y, Wang J, Jia P, et al. Clonal architectures predict clinical outcome in clear cell renal cell carcinoma. Nat Commun. 2019;10:1245.
- Hakimi AA, Reznik E, Lee CH, et al. An integrated metabolic atlas of clear cell renal cell carcinoma. Cancer Cell. 2016;29:104–116.
- Gossage L, Eisen T, Maher ER. VHL, the story of a tumour suppressor gene. Nat Rev Cancer. 2015;15:55–64.
- Sanchez DJ, Simon MC. Transcriptional control of kidney cancer. Science. 2018;361:226–227.
- Yao X, Tan J, Lim KJ, et al. VHL deficiency drives enhancer activation of oncogenes in clear cell renal cell carcinoma. Cancer Discov. 2017;7:1284–1305.
- Hall DP, Cost NG, Hegde S, et al. TRPM3 and miR-204 establish a regulatory circuit that controls oncogenic autophagy in clear cell renal cell carcinoma. Cancer Cell. 2014;26:738–753.
- Gore ME, Szczylik C, Porta C, et al. Safety and efficacy of sunitinib for metastatic renal-cell carcinoma: an expanded-access trial. Lancet Oncol. 2009;10:757–763.
- Ornstein MC, Wood LS, Elson P, et al. A phase II study of intermittent sunitinib in previously untreated patients with metastatic renal cell carcinoma. J clin oncol. 2017;35:1764–1769.
- Motzer RJ, Rini BI, Bukowski RM, et al. Sunitinib in patients with metastatic renal cell carcinoma. JAMA. 2006;295:2516–2524.
- Polyzos A. Activity of SU11248, a multitargeted inhibitor of vascular endothelial growth factor receptor and platelet-derived growth factor receptor, in patients with metastatic renal cell carcinoma and various other solid tumors. J Steroid Biochem Mol Biol. 2008;108:261–266.
- Barrios CH, Hernandez-Barajas D, Brown MP, et al. Phase II trial of continuous once-daily dosing of sunitinib as first-line treatment in patients with metastatic renal cell carcinoma. Cancer. 2012;118:1252–1259.
- Motzer RJ, Hutson TE, Tomczak P, et al. Overall survival and updated results for sunitinib compared with interferon alfa in patients with metastatic renal cell carcinoma. J Clin Oncol. 2009;27:3584–3590.
- Morais C. Sunitinib resistance in renal cell carcinoma. J Kidney Cancer VHL. 2014;1:1–11.
- Rini BI, Atkins MB. Resistance to targeted therapy in renal-cell carcinoma. Lancet Oncol. 2009;10:992–1000.
- Bergers G, Hanahan D. Modes of resistance to anti-angiogenic therapy. Nat Rev Cancer. 2008;8:592–603.
- Pisarsky L, Bill R, Fagiani E, et al. Targeting metabolic symbiosis to overcome resistance to anti-angiogenic therapy. Cell Rep. 2016;15:1161–1174.
- Selbach M, Schwanhausser B, Thierfelder N, et al. Widespread changes in protein synthesis induced by microRNAs. Nature. 2008;455:58–63.
- Yamaguchi N, Osaki M, Onuma K, et al. Identification of MicroRNAs involved in resistance to sunitinib in renal cell carcinoma cells. Anticancer Res. 2017;37:2985–2992.
- Prior C, Perez-Gracia JL, Garcia-Donas J, et al. Identification of tissue microRNAs predictive of sunitinib activity in patients with metastatic renal cell carcinoma. PLoS One. 2014;9:e86263.
- Gamez-Pozo A, Anton-Aparicio LM, Bayona C, et al. MicroRNA expression profiling of peripheral blood samples predicts resistance to first-line sunitinib in advanced renal cell carcinoma patients. Neoplasia. 2012;14:1144–1152.
- Tombol Z, Eder K, Kovacs A, et al. MicroRNA expression profiling in benign (sporadic and hereditary) and recurring adrenal pheochromocytomas. Mod Pathol. 2010;23:1583–1595.
- Ebert MS, Neilson JR, Sharp PA. MicroRNA sponges: competitive inhibitors of small RNAs in mammalian cells. Nat Methods. 2007;4:721–726.
- Bulankina AV, Deggerich A, Wenzel D, et al. TIP47 functions in the biogenesis of lipid droplets. J Cell Biol. 2009;185:641–655.
- Li Y, Bai H, Zhang Z, et al. The up-regulation of miR-199b-5p in erythroid differentiation is associated with GATA-1 and NF-E2. Mol Cells. 2014;37:213–219.
- Dore LC, Amigo JD, Dos Santos CO, et al. A GATA-1-regulated microRNA locus essential for erythropoiesis. Proc Nat Acad Sci. 2008;105:3333–3338.
- Liu Y, Bao Z, Tian W, et al. miR-885-5p suppresses osteosarcoma proliferation, migration and invasion through regulation of beta-catenin. Oncol Lett. 2019;17:1996–2004.
- Jin X, Wang Z, Pang W, et al. Upregulated hsa_circ_0004458 contributes to progression of papillary thyroid carcinoma by inhibition of miR-885-5p and activation of RAC1. Med Sci Monit. 2018;24:5488–5500.
- Zhang Z, Yin J, Yang J, et al. miR-885-5p suppresses hepatocellular carcinoma metastasis and inhibits Wnt/beta-catenin signaling pathway. Oncotarget. 2016;7:75038–75051.
- Afanasyeva EA, Mestdagh P, Kumps C, et al. MicroRNA miR-885-5p targets CDK2 and MCM5, activates p53 and inhibits proliferation and survival. Cell Death Differ. 2011;18:974–984.
- Lam CSC, Ng L, Chow AKM, et al. Identification of microRNA 885-5p as a novel regulator of tumor metastasis by targeting CPEB2 in colorectal cancer. Oncotarget. 2017;8:26858–26870.
- Gui JH, Tian YP, Wen XY, et al. Serum microRNA characterization identifies miR-885-5p as a potential marker for detecting liver pathologies. Clin Sci. 2011;120:183–193.
- Raitoharju E, Seppala I, Lyytikainen LP, et al. Blood hsa-miR-122-5p and hsa-miR-885-5p levels associate with fatty liver and related lipoprotein metabolism-the young finns study. Sci Rep. 2016;6:38262.
- Yang W, Hood BL, Chadwick SL, et al. Fatty acid synthase is up-regulated during hepatitis C virus infection and regulates hepatitis C virus entry and production. Hepatology. 2008;48:1396–1403.
- Hakimi AA, Pham CG, Hsieh JJ. A clear picture of renal cell carcinoma. Nat Genet. 2013;45:849–850.
- Sounni NE, Cimino J, Blacher S, et al. Blocking lipid synthesis overcomes tumor regrowth and metastasis after antiangiogenic therapy withdrawal. Cell Metab. 2014;20:280–294.
- Ferguson D, Zhang J, Davis MA, et al. The lipid droplet-associated protein perilipin 3 facilitates hepatitis C virus-driven hepatic steatosis. J Lipid Res. 2017;58:420–432.
- Wang K, Ruan H, Song Z, et al. PLIN3 is up-regulated and correlates with poor prognosis in clear cell renal cell carcinoma. Urol Oncol. 2018;36(343):e9–e19. .
- Jackson CL. Lipid droplet biogenesis. Curr Opin Cell Biol. 2019;59:88–96.
- Petan T, Jarc E, Jusovic M. Lipid droplets in cancer: guardians of fat in a stressful world. Molecules. 2018;23:E1941.
- Frew IJ, Moch H. A clearer view of the molecular complexity of clear cell renal cell carcinoma. Annu Rev Pathol. 2015;10:263–289.
- Qiu B, Ackerman D, Sanchez DJ, et al. HIF2alpha-dependent lipid storage promotes endoplasmic reticulum homeostasis in clear-cell renal cell carcinoma. Cancer Discov. 2015;5:652–667.
- Ackerman D, Tumanov S, Qiu B, et al. Triglycerides promote lipid homeostasis during hypoxic stress by balancing fatty acid saturation. Cell Rep. 2018;24:2596–2605.
- Liu Q, Luo Q, Halim A, et al. Targeting lipid metabolism of cancer cells: A promising therapeutic strategy for cancer. Cancer Lett. 2017;401:39–45.