
ABSTRACT
Kashin-Beck disease (KBD) is an endemic chronic osteochondropathy. The etiology of KBD remains unknown. In this study, we conducted an integrative analysis of genome-wide DNA methylation and mRNA expression profiles between KBD and normal controls to identify novel candidate genes and pathways for KBD. Articular cartilage samples from 17 grade III KBD patients and 17 healthy controls were used in this study. DNA methylation profiling of knee cartilage and mRNA expression profile data were obtained from our previous studies. InCroMAP was performed to integrative analysis of genome-wide DNA methylation profiles and mRNA expression profiles. Gene ontology (GO) enrichment analysis was conducted by online DAVID 6.7. The quantitative real-time polymerase chain reaction (qPCR), Western blot, immunohistochemistry (IHC), and lentiviral vector transfection were used to validate one of the identified pathways. We identified 298 common genes (such as COL4A1, HOXA13, TNFAIP6 and TGFBI), 36 GO terms (including collagen function, skeletal system development, growth factor), and 32 KEGG pathways associated with KBD (including Selenocompound metabolism pathway, PI3K-Akt signaling pathway, and TGF-beta signaling pathway). Our results suggest the dysfunction of many genes and pathways implicated in the pathogenesis of KBD, most importantly, both the integrative analysis and in vitro study in KBD cartilage highlighted the importance of selenocompound metabolism pathway in the pathogenesis of KBD for the first time.
Introduction
Kashin-Beck disease (KBD) is an endemic chronic osteochondropathy, distributed in certain areas of Eastern Siberia of Russia, North Korea, and China [Citation1]. According to China Health Statistics Yearbook, 37.9 million people living at KBD prevalent counties are at the risk of KBD, and 0.53 million patients suffered from KBD in China in 2017, including 8,540 children under the age of 16. KBD mainly damages cartilage, especially in growth plate and joints [Citation2]. It usually occurs during childhood between 3 and 12 years and becomes symptomatic in adulthood. The typical manifestations of KBD include serious joint pain, joint deformities, irreversible aggravated osteoarthritis (OA), and growth retardation [Citation3].
Various etiological hypotheses have been proposed for KBD, mainly including environmental selenium deficiency and cereal contamination by myco-toxin-producing fungi (mainly for T-2 toxin) [Citation1]. In the 1970s, Chinese researchers discovered that a low environmental content of selenium resulted in a poor nutritional selenium uptake in the KBD prevalent areas [Citation1]. Selenium is an essential element for human health and relates to many diseases, such as cancer, cardiovascular, diabetes, especially Keshan Disease (KD) and KBD [Citation1]. KBD is distributed in selenium-deficient areas in a diagonal belt from northeast to southwest China in the KBD endemic areas, the level of selenium in both soil and human biological samples is in lower amounts than non-KBD areas. The hair selenium level of school children in KBD prevalent areas is significantly lower than that of children living in non-KBD prevalent areas [Citation4]. Consequently, selenium deficiency is an endemic risk factor for KBD, but the mechanism of environmental selenium deficiency implicated in the pathogenesis of KBD remains elusive. Besides, T-2 toxin has been identified in endemic food samples in KBD prevalent areas. The chicks fed with food contaminated by T-2 toxin have shown the similar cartilage damages with KBD patients [Citation5]. Therefore, T-2 toxin has been used as toxic treatment in human chondrocyte line (C28/I2) for years to simulate the similar mechanism in KBD chondrocytes [X. Citation6].
Benefiting from the rapid development of high throughput analyzing technologies, several genomic studies of KBD samples identified multiple genes associated with KBD. For instance, genetic association studies identified HLA-DRB1 [S. Citation7] and ITPR2 [F. Citation8] are susceptibility genes for KBD. Gene expression profile analysis identified 79 differently expressed genes between KBD and normal cartilage [W. Z. Citation9]. DNA methylation is the most extensively studied epigenetic modulation [Y. Citation10]. Recent studies demonstrated that abnormal DNA methylation was strongly correlated with cartilage damage in OA. Roach et al. [Citation11] confirmed that epigenetic changes contributed to the altered synthesis of cartilage degrading enzymes in the chondrocytes of late-stage OA patients. Jeffries et al. [Citation12] observed abnormal methylation of OA susceptibility genes associated with both OA subchondral bone and cartilage. However, the role and mechanism of DNA methylation in the development of KBD are still nebulous.
It is acknowledged that traditional single omic (for instance, genome, or transcriptome) mostly could not unveil the elusive molecular mechanisms of complex diseases. Therefore, integrative multi-omics datasets are becoming valuable. It could not only lead to lower false discovery rates, but also provide more biological insights than single omic analysis [Citation13, M. Citation14]. Moreover, this method could reveal the biological complexity and overcome the weakness of single omics, the lack of comprehensiveness, and the information gap regarding interacting across multiple omic layers [Citation15]. By using tans-omics integrative strategy, many studies have uncovered the implicate dysfunction of multiple molecular levels in complex diseases. Several tools for users to integrate the different omics are widely used now, such as InCroMAP [Citation16,Citation17], a powerful, high-level cross-platform microarray dataset analysis tool for generic or pathway-based analysis, visualization of heterogeneous, and cross-platform datasets.
In this study, we performed integrating analysis of DNA methylation profiles and mRNA expression profiling of KBD and normal cartilage to identify novel candidate genes and pathways for KBD. Our results suggest the dysfunction of many genes and pathways are implicated in the pathogenesis of KBD. Most importantly, both the integrative analysis and in vitro study in KBD cartilage highlighted the importance of selenocompound metabolism pathway in the pathogenesis of KBD for the first time.
Materials and methods
Ethical approval
This investigation was approved by the Human Ethics Committee of Xi’an Jiaotong University (Project Number: 2015–237). The study was conducted in accordance with the ethical standards as laid down in the 1964 Declaration of Helsinki and its later amendments or comparable ethical standards. A written informed consent was obtained from all the patients or relatives of donors.
Sample collection
Human articular cartilage samples from 17 grade III KBD and 17 normal controls were used in this study (). Both KBD and normal subjects were of Chinese Han lineage and matched with age. KBD was diagnosed according to the diagnosis criteria of KBD in China (WS/T 207–2010). Clinical and radiography examinations were taken carefully for each subject. Other demographic characteristics of human subjects such as lifestyle habits, family history, health status, and ethnicities were collected from nurse-administered questionnaires. The subjects with genetic bone and cartilage diseases, rheumatoid arthritis (RA), and other skeletal disorders were excluded from this study.
Table 1. Basic characteristics of study samples.
Genome-wide DNA methylation profiling
The cartilage specimens of 5 KBD and control pairs were harvested from knee joints [W. Citation18]. QIAamp DNA Blood Mini Kit (QIAGEN, Germany) was used to extract DNA from the cartilage specimens according to the manufacturer’s recommendations. Samples were dissected and frozen in liquid nitrogen rapidly for genome-wide DNA methylation profiling. The quality of extracted DNA was evaluated by agarose gel electrophoresis.
Illumina Infinium HumanMethylation450 BeadChip was used for genome-wide DNA methylation profiling. A total of 500 ng of DNA were used for bisulfite conversion according to the standard protocol for the EZ DNA Methylation Kit (Zymo Research, USA). Then, the samples were incubated overnight at 37°C followed by the addition of whole genome amplification. After that, we use HumanMethylation450 array for hybridization, the array was washed and stained following the protocol guide of Infinium HD Assay Methylation. Then IScan SQ scanner (iScan System, Illumina, USA) was used for scanning the raw image intensities. The obtained raw data of image intensity were processed using GenomeStudio software (Illumina, USA).
Differential methylation analysis
A β value, varying from 0 (completely unmethylated) to 1 (completely methylated), was defined as the expression of the average percentage of methylated cytosine at a given CpG site. Differentially methylated CpG sites were identified using the empirical Bayes moderated t-test in limma [Citation19], which was described by Illumina Methylation Analyzer package. A false discovery rate (FDR) adjusted P-value for each CpG site was calculated by using Benjamini–Hochberg method. The Pearson correlation coefficients were calculated to evaluate the correlations of cartilage specimens.
For quality control, the quality of extracted DNA was evaluated by agarose gel electrophoresis. The DNA specimens passing the quality control were used for DNA methylation profiling. The definition of significant CpG met the following two conditions: (1) FDR adjusted P-value (Padj) ≤0.05; (2) |β difference (∆β)| ≥0.2. The CpG sites with Padj>0.05, or Padj ≤ 0.05 with missing values in more than 90% of cartilage specimens accompanied by P > 0.05 were eliminated.
Gene expression profiling of KBD and normal cartilage
Our previous gene expression profiling of KBD and normal cartilage was used here [W. Z. Citation9]. In brief, the articular cartilages of Four KBD patients and four normal controls were collected and matched according to age and sex. Four KBD patients from Yongshou County and Linyou County of Xi’an city in China underwent free total knee replacement surgery, and their articular cartilage tissues were collected. Four matched healthy control knee cartilage samples were collected from the donors within 8 hours of death caused by traffic accidents, the status of healthy samples was diagnosed by histological examination with H&E staining, for excluding KBD, genetic bone, cartilage diseases, OA and RA. Detailed procedures for the experiment were described in our previous study [W. Z. Citation9].
Integrated analysis of DNA methylation and mRNA expression profiles
The DNA methylation and mRNA expression profiling datasets were input into InCroMAP for integrated analysis. Before running analysis, the filtering thresholds of InCroMAP were set as p-value <0.05 for DNA methylation profile data and fold-change (FC) ≥1.5 for mRNA expression profile data. After input, the uniform data required by InCroMAP, integration of multiple data types was performed by mapping each probe to every individual gene. This process is straightforward for mRNA datasets, while DNA methylation datasets are region based on genes by defining the upstream and downstream of each gene’s transcription start site [Citation17]. On the basis of data-pairing, the common genes altered both in DNA methylation profiles and mRNA expression profiles were identified. InCroMAP supports gene sets from the KEGG PATHWAY database. It could also visualize all the pathways by using KEGG translator. Therefore, the mRNA expression or protein modification’s expression value was highlighted by node color or small box. After that, KEGG pathway database provided by InCroMAP was used for pathway enrichment analysis in this study [Citation17]. At last, the identified common genes were submitted to the DAVID 6.7 functional annotation analysis tool (http://david.abcc.ncifcrf.gov) for Gene Ontology (GO) enrichment analysis.
Primary chondrocyte isolation and culture
In order to confirm the involvement of specific genes determined by the integrated analysis of DNA methylation and mRNA expression profiles, we used an in vitro cell model of KBD. The human chondrocyte line (C28/I2), obtained from Mary B. Goldring [Citation20], treated with T-2 toxin[X. Citation6] for detecting the mRNA expression of significant genes. Then, another independent human articular chondrocytes samples from eight grade III KBD patients and 8 normal controls of femoral neck fracture (FNF) were used for Western blot (5 pairs) and immunohistochemistry (IHC) (3 pairs) to identify the expression of SEPSECS protein in KBD articular cartilage ().
KBD and control cartilage samples were cut into 5–10 mm3 slices, treated with 0.25% trypsin (Xi’an GuoAn Biological Technology Co.) for 30 minutes at room temperature (RT) and immersed into 0.2% type II collagenase solution (Gibco, 17,101–015) at 37°C for 10 hours. After that, the isolated chondrocytes were cultured at 37°C in 5% CO2 in DMEM/F12 supplemented with 10% fetal calf serum (Sijiqing, Zhejiang Tianhang Biotechnology Company, Hangzhou, China) and 1% penicillin/streptomycin.
3-(4,5-dimethyl-2-thiazolyl)-2,5-diphenyl-2-H-tetrazolium bromide, thiazolyl blue tetrazolium bromide (MTT) assay
C28/I2 cell line was cultured at 37°C in 5% CO2 in DMEM/F12 supplemented with 10% fetal calf serum and 1% penicillin/streptomycin. C28/I2 and T-2 toxin were used to make the KBD cell models as described previously [X. Citation6]. We used MTT assay to determine the cytotoxicity in C28/I2 human chondrocytes after treated with T-2 toxin. C28/I2 human chondrocytes were seeded in 96-well plates and treated with T-2 toxin at eight different concentrations (1, 2, 5, 8, 10, 12, 15, 20 ng/ml) for 12 h, 24 h, 48 h and 72 h separately. Each concentration has five repeats. Then, 20ul of MTT (5 ng/ml) was added in each wells for 4 hours. After that, the medium was discarded and 200ul dimethyl sulfoxide (DMSO) was added to dissolve the formazan. The results were measured by an automatic enzyme-linked immunosorbent assay reader at 490 nm [X. Citation6].
Quantitative real-time polymerase chain reaction (qPCR)
Total RNA from C28/I2 and T-2 toxin (treated C28/I2 cells 2 ng/ml, 5 ng/ml, 8 ng/ml for 24 h) isolated according to TRIzol protocol and reverse-transcribed to cDNA by One step TaKaRa PrimeScriptTM RT reagent Kit. GAPDH was chosen as reference gene [X. Citation6]. mRNA expression of identified genes (CTH, SEPSECS and PAPSS2) from Selenocompound metabolism pathway was measured by qPCR in triplicate analysis (). The cycle of threshold (CT) of each sample was averaged and normalized to that of GAPDH. The triplicate results were analyzed by comparative CT equation (2−ΔΔCT).
Table 2. The primers used for qPCR.
Western blot
Radio immunoprecipitation assay reagent (Xi’an Hat Biotechnology Co., Ltd) was used for isolating the protein from KBD and control chondrocyte. The concentration of the protein was measured by BCA protein assay kit (Xi’an Hat Biotechnology Co., Ltd). Then, proteins were equally added to the SDS-polyacrylamide gel electrophoresis (SDS-PAGE) and ran separately before transferred to polyvinylidene difluoride (PVDF) membranes. The PVDF membranes were blocked in 5% nonfat milk solution and incubated with the SEPSECS primary antibody (1:1000, ab56033, abcam) at 4°C overnight and the secondary antibody (1:5000, Xi’an Zhuangzhi Biotechnology Co., Ltd, Cat: EK020) for 1 hour at RT. Gene Gnome XRQ (Gene Co., Ltd) was used to analyze the protein bands.
Immunohistochemistry (IHC)
The independent three grade III KBD patients and three control articular cartilage samples were used here. First, samples were embedded in paraffin for IHC. The procedure includes cutting sections, dewax, rehydrate, and antigen retrieval using citrate buffer (pH 6.0) overnight at 37°C and 12.5% trypsin (Xi’an GuoAn Biological Technology Co.) at 37°C for 20–30 minutes. Zhong Shan Gold Bridge Rabbit SP reagent was used in the following procession (Beijing Zhong Shan Gold Bridge Biological Technology Co., 18112A11). Three percent H2O2 was used to prevent endogenous peroxidase reactions for 10 minutes at RT (white bottle), and serum was used to block the samples for 20 minutes at RT to avoid nonspecific background (blue bottle). Then, primary antibody of SEPSECS (1:60, ab56033, abcam) treated the samples at 4°C overnight. The slices were rewarmed at 37°C the next day for 1 h at RT before treating with secondary antibody (yellow bottle) and horseradish peroxidase (red bottle) for 20 minutes at RT, respectively. After that, DAB solution treated the sections until the appropriate color could be seen before dehydrating, mounting the sections, and dyeing the nucleus.
Lentiviral vectors transfection
In order to further detect the role of SEPSECS in the mechanism of KBD cell model. The recombinant lentivirus of SEPSECS acquired from Genechem (Shanghai, China) was used here. C28/I2 human chondrocytes were first treated with 8 ng/ml T-2 toxin for 24 h, after that, the SEPSECS lentivirus and negative lentivirus were transfected into C28/I2 for 96 h. Then, the mRNA expression of SEPSECS and the selected genes (MMP13, SOX9, and ADAMTS5) were measured by qPCR ().
Statistical analysis
A one-way analysis of variance (ANOVA) and independent samples t-test were used for comparisons of the results. Statistical analyses were performed by SPSS 19.0. The threshold was defined as P < 0.05.
Results
DNA methylation profile
In total 473,607 methylation sites analyzed across the genome by using Illumina Infinium HumanMethylation450 BeadChip and 10,161 methylated CpG sites were identified significantly changed (P < 0.05) between KBD and normal samples, including 4,027 hypermethylation CpG cites (corresponding to 1,047 genes) and 6,134 hypomethylation CpG cites (corresponding to 1,747 genes). shows the top 20 significant hypermethylation and hypomethylation CpG sites, among which, cg07687119 (P-value = 3.11 × 10⁻⁹, ∆β = 0.345) with the target genes (HOXC4, HOXC6, and HOXC5) is the most significant hypermethylation locus for KBD. Meanwhile, cg03223172 (P-value = 1.28 × 10⁻⁹, ∆β = −0.294) is the most significant hypomethylation locus for KBD; however, no target gene was identified with this locus. Multiple genes were identified significant differentially methylated between KBD and normal controls, such as SEPSECS (cg20177285, P-value = 3.47 × 10⁻⁵, ∆β = −0.4166), TNFAIP6 (cg01189638, P-value = 1.33 × 10⁻³, ∆β = −0.2732). Some genes are related more than one CpG site. For instance, COL4A1 is related to cg00050792 (P-value = 2.07 × 10⁻³, ∆β = 0.2958), cg08234256 (P-value = 9.19 × 10⁻³, ∆β = 0.2148) and cg03564009 (P-value = 1.09 × 10⁻³, ∆β = 0.2948).
Table 3. The top 20 significant hypermethylation and hypomethylation CpG sites.
Integrative analysis of DNA methylation profile and mRNA expression
To reveal the complicated mechanism of KBD, we conducted a genome-wide integrative analysis of DNA methylation profiles and mRNA expression profiles of KBD and normal cartilage. After considering Gene Bank ID, Pmethyl <0.05 (DNA methylated CpG sites) and fold-change (FC) ≥1.5 (mRNA expression files), 7,526 methylated CpG cites and 2,400 mRNA expression profiles between KBD and normal controls were subjected to the InCroMAP. Two hundred ninety-eight commonly affected genes in both DNA methylation profiles and mRNA expression profiles between KBD and normal controls were identified (Additional File: Table S1). These genes include the collagen family members, such as COL1A1 (NM_000088, Pmethyl = 4.42 × 10⁻³, FC = 4.92), COL1A2 (NM_000089, Pmethyl = 2.26 × 10⁻³, FC = 2.05), COL4A1 (NM_001845, Pmethyl = 4.12 × 10⁻³, FC = 2.16), COL4A2 (NM_001846, Pmethyl = 8.05 × 10⁻³, FC = 2.42), COL5A2 (NM_000393, Pmethyl = 2.09 × 10⁻³, FC = 5.66), COL9A3 (NM_001853, Pmethyl = 0.02, FC = 2.81) and COL14A1 (NM_021110, Pmethyl = 4.47 × 10⁻³, FC = 1.61), and the homeobox family, such as HOXA13 (NM_000522, Pmethyl = 0.013, FC = 1.84), HOXB2 (NM_002145, Pmethyl = 1.03 × 10⁻³, FC = 5.08), HOXC9 (NM_006897, Pmethyl = 9.15 × 10⁻³, FC = 2.22), and HOXD10 (NM_002148, Pmethyl = 0.028, FC = 1.59), altered both in DNA methylation and mRNA expression in KBD cartilage compared to normal controls. Moreover, some other genes, such as TNFAIP6 (NM_007115, Pmethyl = 1.34 × 10⁻³, FC = 5.94) and TGFBI (NM_000358, Pmethyl = 3.21 × 10⁻³, FC = 7.86), which have been found as significant genes in KBD patients previously [Citation21, S. Citation22] also identified significantly in this study.
Enrichment analysis
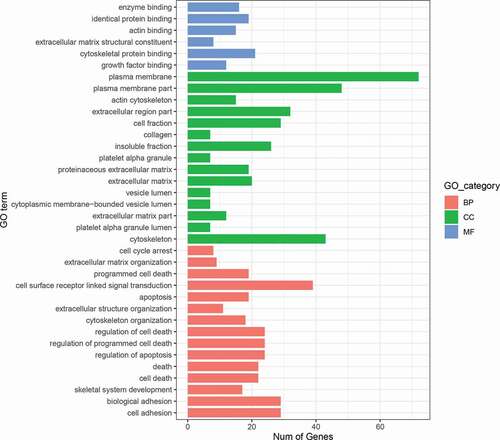
GO enrichment analysis of these 298 genes identified 36 significantly overrepresented GO terms (FDR<0.05), including those functionally involved in collagen, skeletal system development, growth factor, and apoptosis (, Table S2).
Figure 1. The barplot of GO enrichment analysis results of common genes altered in both DNA methylation profiles and mRNA expression profiles. BP stands for biological process. CC stands for cellular component. MF stands for molecular function.
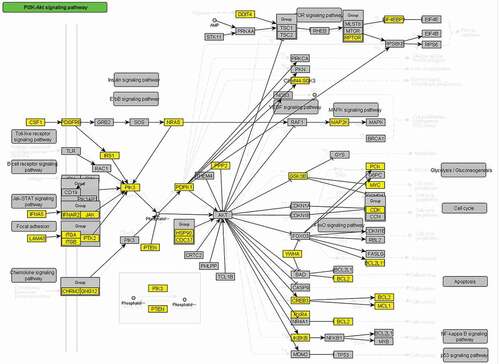
Integrative pathway enrichment analysis of DNA methylation profiles and mRNA expression profiles demonstrated 32 pathways significantly associated with KBD (), such as Selenocompound metabolism pathway (KEGG path: hsa00450, P = 0.0123, ), PI3K-Akt signaling pathway (KEGG path: hsa04151, P = 3.40 × 10⁻³, ), TGF-beta signaling pathway (KEGG path: hsa04350, P = 4.30 × 10⁻³), and Regulation of actin cytoskeleton (KEGG path: hsa04810, P = 3.95 × 10⁻³).
Table 4. Integrated pathway enrichment analysis results.
Figure 2. InCroMAP analysis results of Selenocompound metabolism pathway. The genes highlighted in yellow denote the genes analyzed by this study within the Selenocompound metabolism pathway.
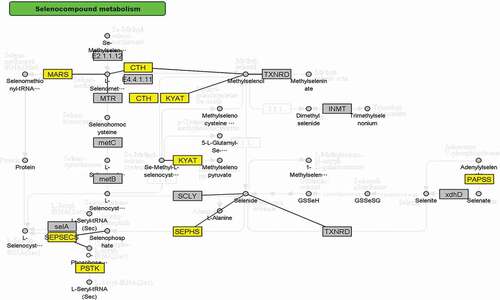
Figure 3. InCroMAP analysis results of PI3K-ATK signaling pathway. The genes highlighted in yellow denote the genes analyzed by this study within the PI3K-ATK signaling pathway.
In vitro confirmation of selected genes
To ensure there are sufficient cells to perform mRNA expression analysis and simulate the similar mechanism of KBD chondrocytes, we used MTT assay to follow cell survival rate to response to different concentrations of T-2 toxin. Our results showed that C28/I2 chondrocyte survival rate was decreased with the increasing concentration of T-2 toxin. The median inhibitory concentration (IC50) of T-2 toxin treated on C28/I2 for each time point was 14.90 ng/ml, 11.98 ng/ml, 7.05 ng/ml, and 6.52 ng/ml for 12 h, 24 h, 48 h, and 72 h, respectively. The least significant difference (LSD) method detected significant differences between the four different time groups and control (F = 4.237, P = 0.006). 24 h, 48 h, 72 h showed significant differences when compared with control (P = 0.028, 0.001, 0.001, respectively). Concentration analysis identified that T-2 toxin-induced significant differences among the eight concentration groups (F = 3.631, P = 0.004). In this study, we chose the concentration of T-2 toxin as 2 ng/ml, 5 ng/ml, and 8 ng/ml for 24 h as our best protocol to ensure adequate cell response and sufficient cell survival for further analysis.
The mRNA expression of selected genes in KBD cell model
A set of 3 distinct genes from the significantly affected Selenocompound metabolism pathway was selected and gene expression levels quantified in the KBD in vitro model that C28/I2 cell line treated with T-2 toxin (2 ng/ml, 5 ng/ml, and 8 ng/ml) for 24 h. We observed that the mRNA expression levels of three genes (SEPSECS, CTH, and PAPSS2) from the Selenocompound metabolism pathway were all significantly increased in C28/I2 chondrocytes treated with T-2 comparing with control (PSEPSECS<1.0 × 10⁻⁴, PCTH = 4.0 × 10⁻³, PPAPSS2 = 7.2 × 10⁻³) ().
Figure 4. The mRNA expression of SEPSECS (a), CTH (b), PAPSS2 (c) in C28/I2 in KBD cell models. The x-axis indicates different T-2 toxin intervention concentrations. The y-axis represents the mRNA expression levels of the genes compared to normal control. **** means P < 0.0001, and ** means P < 0.01.
After treated by 8 ng/ml T-2 toxin for 24 h in C28/I2 human chondrocytes, the mRNA expression of SEPSECS was significantly increased (P < 0.001, )). Then, after knocking out SEPSECS by lentivirus transfection, the mRNA expression of SEPSECS was significantly decreased (P < 0.001, )), which means the effectiveness of knocking out SEPSECS in C28/I2 human chondrocytes treated with T-2 toxin. The mRNA expression of MMP13 was decreased notably (P < 0.001, )), while the SOX9 was overexpressed after knocking out SEPSECS in C28/I2 human chondrocytes (P < 0.01, )), but the mRNA expression of ADMATS5 had no significant difference between the lentivirus group and T-2 toxin group ()).
Figure 5. The mRNA expression of SEPSECS (a), MMP13 (b), SOX9 (c) and ADAMTS5 (d) in C28/I2 in KBD cell models. The y-axis represents the mRNA expression levels of the genes compared to normal control. *** means P < 0.001, ** means P < 0.01, * means P < 0.05.
The expression of SEPSECS in KBD cartilage
The expression of SEPSECS protein by IHC was observed in the superficial, middle, and deep layer of KBD and control articular cartilage. The results showed that the expression of SEPSECS protein was significantly higher in superficial layer of KBD samples compared with control samples (P = 0.021), while the middle and deep layer showed no significance (). In addition, western blot results showed that the expression of SEPSECS protein (54 kDa) was 2.19 times higher in KBD chondrocytes than that in normal controls (P = 7.10 × 10⁻³) ().
Figure 6. The expression of SEPSECS protein in the KBD and control cartilage. Immunostaining for SEPSECS in the superficial, middle and deep zone of KBD cartilage (a). The percentage of positive of SEPSECS in the superficial (b), middle (c), deep layer (d) of KBD and control cartilage. *P = 0.021 in the superficial zone, n = 3. Scale bar stands for 50 μm.
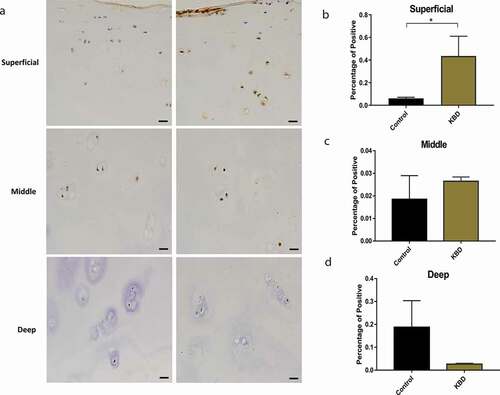
Figure 7. The expression of SEPSECS protein in the KBD and control chondrocytes. The expression of SEPSECS protein in KBD chondrocytes and normal chondrocytes (a). **P = 7.10 × 10⁻³ (b).
Discussion
In this study, a trans-omic analysis of DNA methylation and mRNA expression profiling between KBD and normal samples was performed by using the cross-platform microarray dataset analysis tool InCroMAP. Two hundred ninety-eight common genes, 36 GO terms, and 32 KEGG pathways were identified associated with the pathogenesis of KBD.
Among all the 298 common genes, we found several genes of the collagen type family that have significantly altered, such as COL1A1, COL1A2, COL4A1, COL4A2, COL5A2, COL9A3, and COL14A1. The Collagen family is the most abundant proteins in the extracellular matrix (ECM) and is essential for bone adhesion and formation. Different collagen types based on molecular defects of collagen genes are related to many disorders, such as chondrodysplasias, osteogenesis imperfecta, epidermolysis bullosa, OA, and osteoporosis [Citation23]. COL4A1 promotes osteoblastic cells survival and ECM formation and is related to osteoporosis in KBD patients [Citation24]. Additionally, Wang et al. [S. Citation25] demonstrated COL5A2 is a significant gene in KBD chondrocytic but not in peripheral blood monocytic networks. Type I collagen (COL1) is participated in the repair of articular cartilage [Citation26]. Therefore, we suggested that the candidate genes of COL1A1 and COL1A2 may be involved in the cartilage repair of KBD. Since few studies have showed collagen family genes (COL1A1, COL1A2, COL4A2, COL9A3, COL14A1) identified in this study related to KBD, our findings indicated the important roles of collagen family in the molecular mechanism of KBD articular cartilage.
Another interesting series of genes we found related to KBD is homeobox family (HOXA13, HOXB2, HOXC9, and HOXD10). Homeobox genes are a group of transcription genes that function as the formation of many body structures during early embryonic development. HOXA13 encodes a DNA-binding transcription factor and may regulate gene expression, morphogenesis, and differentiation. It has been reported that mutated HOXA13 associated with the limb and genitourinary deformity development and can cause hand-foot-genital syndrome [Citation27]. Additionally, HOXD10 is expressed in the development of limb buds and is involved in differentiation and limb development. These limb deformities related genes show the similar syndrome in KBD patients, indicating their possible relation to KBD. Therefore, the roles of these homeobox family genes involved in the development of KBD should be attended to.
Moreover, we also confirmed other significant genes that have been demonstrated associated with KBD, such as TNFAIP6 and TGFBI. TNFAIP6, known as tumor necrosis factor alpha-induced protein 6, is a member of the hyaluronan-binding protein family and plays an important role in ECM formation, inflammation and cell proliferation [S. Citation25]. Wang et al. [S. Citation22] identified TNFAIP6 as a significant gene associated with the biological function of chondrocyte and cartilage of KBD. In addition, TGFBI, transforming growth factor beta-induced, which encodes a collagen-related protein to bind the type I, II, and IV collagens, plays a critical role in osteoblast differentiation, tissue regeneration, bone remodeling, cell collagen interaction, even affects bone resorption, recovery, and cartilage development [S. Citation25, P. Citation28]. TGFBI has been identified as a significant gene from the chondrocytic canonical pathway involved in KBD [S. Citation25].
Further GO enrichment analysis of the 298 common genes observed numerous GO terms involved in the development of KBD, such as cell adhesion, collagen, skeletal system development, cell death, apoptosis, cytoskeleton, ECM. Some of them have been identified playing important roles in the cartilage damage of KBD, like collagen and ECM. Cartilage contains chondrocytes as well as their surrounding ECM, which is a complex network formed by water, collagen, proteoglycans, and other proteins. Collagens are the most abundant family of ECM proteins, making up two-thirds of the dry mass of adult articular cartilage [Y. Citation29]. Multiple collagen subtypes have been identified in articular cartilage, including the most major collagen (type II collagen) and some minor collagens (type IX, X, XI, VI, VII collagens). It has been known that the cartilage degeneration caused by abnormal catabolism in the ECM is the chief characteristic in the pathogenesis of KBD [X. Citation6]. Wang et al. demonstrated that Wnt/β-catenin signaling pathway involved in disrupting anabolism and catabolism in the ECM in KBD pathogenesis [X. Citation6]. Taken together, the identified GO terms may provide us important biological process, cellular component, and molecular function involved in the pathogenesis of KBD.
We identified 32 significantly modified KEGG pathways statistically associated with KBD, such as focal adhesion and PI3K-Akt signaling pathway. The focal adhesion complex is a signaling center regulating dynamic cellular behaviors, such as cell adhesion, spreading, migration, proliferation, and initiated [Citation30]. Shin et al. identified inhibition of the focal adhesion complex could result in a significant reduction of chondrocyte dedifferentiation [Citation30]. Another study performing whole-exome sequencing found focal adhesion is a major pathway for KBD pathogenesis. Interestingly, the focal adhesion complex is linked to the intracellular signaling pathway such as PI3K [Citation30], which is a pathway that also identified significant in this study. PI3K is the primary signaling pathway regulating chondrocyte survival and apoptosis [Citation31]. Du et al. demonstrated that SNP of Selenoprotein S SEPS1 − 105 G > A associated with the expression of PI3K-Akt signaling pathway played important roles in the development of KBD [Citation31]. This evidence indicated that chondrocyte apoptosis was partly regulated by PI3K-Akt.
It has been known that low environmental selenium has a close relation to KBD. Selenium, whose anti-inflammatory, antioxidant, and antiviral properties are well known, shows biologically ambivalent characteristics in animals and exerts its biological effects mainly through enzymatically active selenoproteins [Citation32]. Selenium is an integral part of selenoproteins and contains the redox-active amino acid selenocysteine in their catalytically active center [Citation33]. A targeted deletion of tRNA gene for the selenocysteine in the osteo-chondroprogenitor cells causes many features similar to KBD, suggesting its potential importance for KBD [Citation34]. In addition, Speckmann et al. [Citation35] demonstrated that selenium influenced epigenetic modifications of DNA. In rat liver and colon, it was suggested that selenium deficiency resulted in less DNA methylation mainly because selenium provides the methylation donor for DNA methylation [Citation36]. In contrast, other studies showed that high selenium exposure decreased total DNA methylation levels in the liver of rats, perhaps because of selenium inhibiting DNA methyltransferase expression [Citation37,Citation38]. Evidences showed that monomethylated selenium compounds are crucial for the tumor preventive effects of the selenium. The methylselenolate was identified to interact with H2O2 and participate in the ROS of tumor formation [Citation39]. The methylselenol is the key intermediate contributing to selenide in the case of selenium-methylated selenocompounds [Citation39,Citation40].
For the first time, we have identified the selenocompound metabolism pathway associated with KBD via genetic study. It has been known selenium mainly exerts its biological effects through enzymatically active selenoproteins. The transport and storage of selenium are mainly depended on liver-derived circulating glycoprotein selenoprotein P [Citation32], while selenoprotein S, a selenoprotein localized in the plasma membrane and endoplasmic reticulum (ER) stress, could control ER homeostasis and participate in adipogenesis [C. Y. Citation41]. Du et al. demonstrated that SNP of Selenoprotein S SEPS1 − 105 G > A played important roles in KBD pathogenesis [Citation31]. Selenocompound metabolism pathway includes 17 genes and 27 compound of chemical substance, related to 4 diseases (homocystinuria, hypermethioninemia, spondyloepimetaphyseal dysplasia[SEMD], Methylcobalamin deficiency type G), among which, SEMD is the most similar disease to KBD. SEME is characterized by short, bowed lower limbs, mild brachydactyly, enlarged knee joints, and early-onset osteoarthropathy, which are nearly identical to the symptom of KBD, suggesting that KBD and SEMD share common pathways of disease that may include the selenocompound metabolism pathway. Additionally, seven genes in selenocompound metabolism pathway were identified significant association with KBD in this study, such as CTH, SEPSECS, PAPSS2. CTH, known as cystathionine gamma-lyase, is a novel osteoclast regulator. Itou et al. identified CTH may accelerate osteoclast differentiation and has a potent calcium resorption function, which may serve as a molecular switch regulating between osteoclast and osteoblast balance [Citation42]. SEPSECS, whose official full name is Sep (O-phosphoserine) tRNA:Sec (selenocysteine) tRNA synthase, is involved in the synthesis of selenocysteine. It is identified as a DNA hypomethylation-related gene related to KBD and showed increased protein expression level in KBD cartilage tissue and chondrocytes in this study. Further functional studies were warranted to identify the interaction between SEPSECS and KBD. PAPSS2, whose official full name is 3ʹ-phosphoadenosine 5ʹ-phosphosulfate synthase 2, is also known as SK2, BCYM4, ATPSK2. Mutations of PAPSS2 can cause an autosomal recessive form of SEMD in humans [Citation43]. Another study showed that TGF-β maintains biomechanical properties and regulates expression of PAPSS2 in mouse articular cartilage [Citation44]. The three genes mentioned above are all up-regulated in the KBD cell models in our study. Additionally, the mRNA expression of MMP13 was significantly decreased, while SOX9 expression was increased notably after knocking out SEPSECS in C28/I2 human chondrocytes treated with T-2 toxin. MMP13 is known in the breakdown of extracellular matrix in OA development. Little et al. found that OA progression is prohibited in MMP13 knockout mice [Citation45]. SOX9 is found in chondrocyte differentiation. The overexpression of SOX9 could alleviate the progression of human OA [Citation46]. All these results indicated that the lower expression of SEPSECS may act as a protective role in the development of KBD. Moreover, the increased expression of SEPSECS protein, which is recognized as 54kDa band by the company, also showed 43 kDa notably in KBD chondrocytes. Same results could be found in human hepatoma cells [Citation47]. The in vitro study in KBD cartilage highlight for the first time the importance of selenocompound metabolism pathway in the pathogenesis of KBD. All together, the identified KEGG pathways may have some potential interactions and give us novel insight in the development of KBD.
Although we identified multiple genes and pathways associated with the development of KBD, only one pathway was confirmed by further biological experiments. Therefore, more functional studies are warranted to detect the potential mechanism of these candidate genes as well as the identified pathways involved in the pathogenesis of KBD.
Conclusions
Up to now, the pathogenesis of KBD as well as the biological effects of selenium in vivo is still under debate. By trans-omics analysis of genome-wide DNA methylation profiling and mRNA expression profiling, we identified 298 common genes, 36 GO terms, and 32 KEGG pathways associated with KBD pathogenesis. Most importantly, we first observed the selenocompound metabolism pathway related to KBD via genetic study and verified it by validation tests. Our results have emphasized the dysfunction of many genes and pathways implicated in the pathogenesis of KBD and further confirmed the importance of selenium and selenocompound metabolism pathway in the development of KBD.
Supplemental Material
Download MS Word (16.6 KB)Supplemental Material
Download MS Word (37.7 KB)Acknowledgments
The study was supported by the National Natural Scientific Foundation of China [grant numbers 81472925, 81673112, 81703177]; Key projects of international cooperation among governments in scientific and technological innovation [grant number 2016YFE0119100]; and the Fundamental Research Funds for the Central Universities. We appreciate Zengtie Zhang in the Pathology Department for the guidance of processing the tissues.
Disclosure statement
The authors report no conflict of interest.
Supplementary material
Supplemental data for this article can be accessed here.
Additional information
Funding
References
- Guo X, Ma WJ, Zhang F, et al. Recent advances in the research of an endemic osteochondropathy in China: kashin-Beck disease. Osteoarthritis Cartilage. 2014;22(11):1774–1783.
- Moreno-Reyes R, Suetens C, Mathieu F, et al. Kashin-Beck osteoarthropathy in rural Tibet in relation to selenium and iodine status. N Engl J Med. 1998;339:1112–1120.
- Lu AL, Guo X, Aisha MM, et al. Kashin-Beck disease and Sayiwak disease in China: prevalence and a comparison of the clinical manifestations, familial aggregation, and heritability. Bone. 2011;48(2):347–353.
- Chen Z, Li H, Yang L, et al. Hair selenium levels of school children in Kashin-Beck disease endemic areas in Tibet, China. Biol Trace Elem Res. 2015;168(1):25–32. .
- Li D, Han J, Guo X, et al. The effects of T-2 toxin on the prevalence and development of Kashin-Beck disease in China: a meta-analysis and systematic review. Toxicol Res (Camb). 2016;5:731–751.
- Wang X, Ning Y, Zhang P, et al. Chondrocytes damage induced by T-2 toxin via Wnt/beta-catenin signaling pathway is involved in the pathogenesis of an endemic osteochondropathy, Kashin-Beck disease. Exp Cell Res. 2017b;361(1):141–148.
- Luo S, Long X, Deng M, et al. Association of COL1A1 polymorphism with subchondral bone degeneration of the temporomandibular joint. Int J Oral Maxillofac Surg. 2016;45(12):1551–1555.
- Zhang F, Wen Y, Guo X, et al. Genome-wide association study identifies ITPR2 as a susceptibility gene for Kashin-Beck disease in Han Chinese. Arthritis Rheumatol. 2015a;67:176–181.
- Wang WZ, Guo X, Duan C, et al. Comparative analysis of gene expression profiles between the normal human cartilage and the one with endemic osteoarthritis. Osteoarthritis Cartilage. 2009;17(1):83–90. .
- Zhang Y, Fukui N, Yahata M, et al. Genome-wide DNA methylation profile implicates potential cartilage regeneration at the late stage of knee osteoarthritis. Osteoarthritis Cartilage. 2016;24(5):835–843.
- Roach HI, Yamada N, Cheung KS, et al. Association between the abnormal expression of matrix-degrading enzymes by human osteoarthritic chondrocytes and demethylation of specific CpG sites in the promoter regions. Arthritis Rheumatism. 2005;52:3110–3124.
- Jeffries MA, Donica M, Baker LW, et al. Genome-wide DNA methylation study identifies significant epigenomic changes in osteoarthritic subchondral bone and similarity to overlying cartilage. Arthritis Rheumatol. 2016;68(6):1403–1414.
- Bonnet E, Calzone L, Michoel T. Integrative multi-omics module network inference with lemon-tree. PLoS Comput Biol. 2015;11(e1003983):1003981.
- Kim M, Rai N, Zorraquino V, et al. Multi-omics integration accurately predicts cellular state in unexplored conditions for Escherichia coli. Nat Commun. 2016;7(13090):13091.
- Yugi K, Kubota H, Hatano A, et al. Trans-Omics: how to reconstruct biochemical networks across multiple ‘Omic’ layers. Trends Biotechnol. 2016;34:276–290.
- Cambiaghi A, Ferrario M, Masseroli M. Analysis of metabolomic data: tools, current strategies and future challenges for omics data integration. Brief Bioinform. 2017;18(3):498–510.
- Wrzodek C, Eichner J, Buchel F, et al. InCroMAP: integrated analysis of cross-platform microarray and pathway data. Bioinformatics. 2013;29(4):506–508.
- Wang W, Yu Y, Hao J, et al. Genome-wide DNA methylation profiling of articular cartilage reveals significant epigenetic alterations in Kashin-Beck disease and osteoarthritis. Osteoarthritis Cartilage. 2017a;25:2127–2133.
- Ritchie ME, Phipson B, Wu D, et al. limma powers differential expression analyses for RNA-sequencing and microarray studies. Nucleic Acids Res. 2015;43:e47.
- Claassen H, Schicht M, Brandt J, et al. C-28/I2 and T/C-28a2 chondrocytes as well as human primary articular chondrocytes express sex hormone and insulin receptors–Useful cells in study of cartilage metabolism. Ann Anat. 2011;193(1):23–29.
- Guo X, Zuo H, Cao CX, et al. Abnormal expression of Col X, PTHrP, TGF-beta, bFGF, and VEGF in cartilage with Kashin-Beck disease. J Bone Miner Metab. 2006;24:319–328.
- Wang S, Wang W, Zhao J, et al. To screen the effective software for analysing gene interactions from Kashin-Beck disease genome profiling pathway and network, according to the tool of GeneMANIA. Int J Data Min Bioinform. 2015;12:100–114.
- Gelse K, Po¨schl E, Aigner T (2003). Collagens—structure, function, and biosynthesis. Advanced Drug Delivery Reviews. Vol 55.
- Wen Y, Guo X, Hao J, et al. Integrative analysis of genome-wide association studies and gene expression profiles identified candidate genes for osteoporosis in Kashin-Beck disease patients. Osteoporos Int. 2016;27(3):1041–1046. .
- Wang S, Guo X, Wang W, et al. Genome-wide study identifies the regulatory gene networks and signaling pathways from chondrocyte and peripheral blood monocyte of Kashin-Beck disease. Genes Cells. 2012;17(8):619–632.
- Yanagisawa H, Hoshi K, Asawa Y, et al. Matrix remodeling and cytological changes during spontaneous cartilage repair. J Electron Microsc (Tokyo). 2012;61(4):237–248.
- Cao L, Chen C, Leng Y, et al. A missense mutation of HOXA13 underlies hand-foot-genital syndrome in a Chinese family. J Genet. 2017;96(4):647–652.
- Zhang P, Zhong ZH, Yu HT, et al. Exogenous expression of IL-1Ra and TGF-beta1 promotes in vivo repair in experimental rabbit osteoarthritis. Scand J Rheumatol. 2015b;44:404–411.
- Luo Y, Sinkeviciute D, He Y, et al. The minor collagens in articular cartilage. Protein Cell. 2017;8(8):560–572.
- Shin H, Lee MN, Choung JS, et al. Focal adhesion assembly induces phenotypic changes and dedifferentiation in chondrocytes. J Cell Physiol. 2016;231(8):1822–1831.
- Du XA, Wang HM, Dai XX, et al. Role of selenoprotein S (SEPS1) −105G>A polymorphisms and PI3K/Akt signaling pathway in Kashin-Beck disease. Osteoarthritis Cartilage. 2015;23(2):210–216.
- Hoefig CS, Renko K, Kohrle J, et al. Comparison of different selenocompounds with respect to nutritional value vs. toxicity using liver cells in culture. J Nutr Biochem. 2011;22(10):945–955.
- Pallauf J, Bosse A, Mueller AS. Selenium, an ambivalent factor in diabetes? Established facts, recent findings and perspectives. Curr Nutr Food Sci. 2006;2(2):151–168.
- Downey CM, Horton CR, Carlson BA, et al. Osteo-chondroprogenitor-specific deletion of the selenocysteine tRNA gene, Trsp, leads to chondronecrosis and abnormal skeletal development: a putative model for Kashin-Beck disease. PLoS Genet. 2009;5(e1000616):1000611–1000618.
- Speckmann B, Grune T. Epigenetic effects of selenium and their implications for health. Epigenetics. 2015;10(3):179–190.
- Uthus EO, Ross SA, Davis CD. Differential effects of dietary selenium (se) and folate on methyl metabolism in liver and colon of rats. Biol Trace Elem Res. 2006;109(3):201–214.
- Bermingham EN, Bassett SA, Young W, et al. Post-weaning selenium and folate supplementation affects gene and protein expression and global DNA methylation in mice fed high-fat diets. BMC Med Genomics. 2013;6(1):7.
- Jablonska E, Reszka E. Selenium and epigenetics in cancer: focus on DNA methylation. Adv Cancer Res. 2017;136:193–234.
- Gromer S, Gross JH. Methylseleninate is a substrate rather than an inhibitor of mammalian thioredoxin reductase. Implications for the antitumor effects of selenium. J Biol Chem. 2002;277(12):9701–9706.
- Suzuki KT, Kurasaki K, Suzuki N. Selenocysteine beta-lyase and methylselenol demethylase in the metabolism of Se-methylated selenocompounds into selenide. Biochim Biophys Acta. 2007;1770:1053–1061.
- Kim CY, Kim KH. Selenate prevents adipogenesis through induction of selenoprotein S and attenuation of endoplasmic reticulum stress. Molecules. 2018;23(11):2882.
- Itou T, Maldonado N, Yamada I, et al. Cystathionine gamma-lyase accelerates osteoclast differentiation: identification of a novel regulator of osteoclastogenesis by proteomic analysis. Arterioscler Thromb Vasc Biol. 2014;34:626–634.
- Ford-Hutchinson AF, Ali Z, Seerattan RA, et al. Degenerative knee joint disease in mice lacking 3ʹ-phosphoadenosine 5ʹ-phosphosulfate synthetase 2 (Papss2) activity: a putative model of human PAPSS2 deficiency-associated arthrosis. Osteoarthritis Cartilage. 2005;13:418–425.
- Ramaswamy G, Sohn P, Eberhardt A, et al. Altered responsiveness to TGF-beta results in reduced Papss2 expression and alterations in the biomechanical properties of mouse articular cartilage. Arthritis Res Ther. 2012;14:R49.
- Little CB, Barai A, Burkhardt D, et al. Matrix metalloproteinase 13-deficient mice are resistant to osteoarthritic cartilage erosion but not chondrocyte hypertrophy or osteophyte development. Arthritis Rheumatism. 2009;60(12):3723–3733.
- Ouyang Y, Wang W, Tu B, et al. Overexpression of SOX9 alleviates the progression of human osteoarthritis in vitro and in vivo. Drug Des Devel Ther. 2019;13:2833–2842.
- French RL, Gupta N, Copeland PR, et al. Structural asymmetry of the terminal catalytic complex in selenocysteine synthesis. J Biol Chem. 2014;289(42):28783–28794.