
ABSTRACT
Wilms’ tumor 1 (WT1) is reported to play an important role in tumor invasion and metastasis, two hallmarks of ovarian cancer (OC) that influence treatment efficacy and prognosis. However, the specific roles and underlying mechanisms of WT1 in OC have not been fully understood. Here, we investigated the potential function and signaling pathways of WT1 in OC cells. We showed that WT1 was significantly upregulated in human OC tissues and closely associated with OC type, grade and FIGO stage. In cultured cells and xenograft mouse models, WT1 depletion significantly inhibited cell migration and invasion, reversed epithelial–mesenchymal transition (EMT), and prevented metastasis of OC cells. We further demonstrated that WT1 inhibited E-cadherin expression via targeting E-cadherin gene promoter by chromatin immunoprecipitation and luciferase reporter assay. Moreover, ERK1/2 activation was suppressed upon WT1 silencing. Inhibiting ERK1/2 phosphorylation increased E-cadherin expression and suppressed WT1-induced OC cell migration and invasion. Taken together, our study reveals WT1 exerts a tumor-promoting role in OC, enhancing EMT through negative modulation of E-cadherin expression via ERK1/2 signaling. WT1 may represent a novel therapeutic target that may improve the prognosis of OC.
1. Introduction
Ovarian cancer (OC) is a major gynecologic malignancy and the leading cause of cancer-related death among women[Citation1]. It behaves more aggressively and has a worse prognosis than any other cancer involving the female genital tract [Citation2]. Approximately 70% of patients with OC are diagnosed at advanced stages due to a lack of specific initial symptoms and limited approaches for early detection [Citation3]. The 5-year survival rate for ovarian cancer shows a ~ 90% survival rate at early stages, but decreased to 30% in those at stage III and IV [Citation4,Citation5]. Although great efforts have been made toward improving effective treatment, postoperative locoregional recurrence and distant metastasis still occur frequently and confer high risks of morbidity and mortality.
The Wilms’ Tumor 1 (WT1) gene encodes a zinc finger transcription factor and RNA-binding protein that regulates transcription of numerous target genes and manifests both tumor suppressor and oncogenic activities [Citation6]. It was initially discovered as a tumor suppressor in Wilms’ tumor of the kidneys [Citation7]. Subsequent studies revealed that WT1 can also act as an oncogene in multiple tumors, including leukemia, lung cancer, breast cancer, and glioblastoma [Citation8]. In OC, WT1 is overexpressed and positively associated with epithelial ovarian cancer [Citation9–11]. Additionally, it is most prevalent in advanced stage tumors (stage III/IV) as well as in 100% of metastatic lesions, suggesting that WT1 expression is enhanced during OC progression to metastasis [Citation12]. WT1 can promote the tumorigenesis through various pathways, and plays an important role in tumor invasion and metastasis. Some recent studies have investigated the link between WT1 and its potential role in OC progression [Citation13,Citation14]. For example, Gupta et al. found WT1 was necessary for transcriptional upregulation of SHMT1, which mediates the cancer-promoting activity of WT1 [Citation13]. However, metastasis is the most lethal attribute of OC with highly complicated molecular mechanisms. Considering WT1 has been evaluated as a potential novel therapeutic target for the metastatic serous ovarian carcinoma [Citation12,Citation15], it is necessary for us to further understand its detailed molecular mechanism in OC metastasis.
OC metastasis is closely associated with epithelial–mesenchymal transition (EMT), a biologic process during which epithelial cells acquire new features of mesenchyme [Citation16], which plays an important role in upregulating the expression of cell motility-related proteins, enhancing cell migration and invasion and promoting cancer cell metastasis [Citation17,Citation18]. Recent studies have shown that E-cadherin represents a downstream target of WT1 in the regulation of EMT [Citation19–21]. The WT1-driven EMT via the downregulation of E-cadherin may be one of the mechanisms for shedding light on the OC metastatic progression.
Given the emerging importance of WT1 in OC and EMT, we examined the association between WT1 and OC, and further explored the molecular mechanisms by which WT1 mediates OC invasion and metastasis.
2. Material and methods
2.1 Tissue specimens and cell culture
This study was approved by the Ethics Committee of Second Affiliated Hospital of Nanjing Medical University. Written informed consent was obtained from each patient. Human primary OC samples and the corresponding adjacent normal ovarian tissues were collected from 49 patients with OC during primary surgery or before neoadjuvant chemotherapy in the Second Affiliated Hospital of Nanjing Medical University from 2014 to 2017. Ovarian cancers were classified based on International Federation of Gynecology and Obstetrics (FIGO) staging system and WHO grading system. The clinicopathological features are summarized in . Normal human ovarian epithelial cell line IOSE386, epithelial OC cell lines A2780, HO8910, and HO8910PM, were obtained from the Chinese Academy of Sciences Cell Bank (Shanghai, China). Epithelial OC SKOV3 cells and HEK 293 T cells were from ATCC. HEK 293 T were maintained in Dulbecco’s Modified Eagle Medium (DMEM). IOSE386, A2780, HO8910, and HO8910PM and SKOV3 were cultured in RPMI-1640. Each medium was supplemented with 10% fetal bovine serum (Gibco, Mexico). Cells were cultured at 37°C in a humidified 5% CO2 atmosphere. For cell viability assays, cells were seeded into 96-cell plates at a density of 4,000 cells/well and assessed using cell counting kit-8 (CCK-8) reagent (Yeasen, Shanghai, China) on day 1, 2, 3 post cell seeding. Absorbance values were detected at the wavelength of 450 nm using a platereader (Thermo Scientific Multiskan GO, Finland).
Table 1. Association of WT1 with the clinicopathological characteristics of ovarian cancer
2.2 shRNA-based stable WT1 knockdown and transient WT1 overexpression
The shRNA vectors LV3-GFP-WT1-shRNA (WT1-shRNA) and LV3-shNC (negative control) were from Genechem (Shanghai, China). The target sequences were as follows: LV3-WT1-#2:CTC ACT CCT TCA TCA AAC AGG; LV3-WT1-#3:GCC CTA CAG CAG TGA CAA TTT; LV3-WT1-#4:GCT TAC CCA GGC TGC AAT AAG; LV3-WT1-#5:GGA GAC ATA CAG GTG TAA AC; LV3-shNC control #1: GTT CTC CGA ACG TGT CAC GT. SKOV3 and HO8910PM cells were infected by recombinant lentivirus expressing above shRNAs generated from 293 T cells. Stable cells were selected by 1 μg/mL puromycin. The plasmids pCMV3-WT1-Flag (pCMV3-WT1, WT1 overexpression) and pCMV3-C-Flag (pCMV3, negative control) were from Sino Biological (Beijing, China). A2780 cells were transiently transfected with above plasmids using Lipofectamine 2000 (Invitrogen).
2.3 Immunohistochemistry (IHC)
The clinical samples were sectioned into 5 μm sections. After deparaffination and dehydration, slides were treated with hydrogen peroxide at room temperature and then heated to retrieve the antigen. Immunohistochemical analyses were performed using a Histostain Kit (Invitrogen, USA) with antibodies against WT1 (Ab89901, Abcam). Diaminobenzidine (DAB) was used as the chromogenic reaction, and hematoxylin was used to stain nuclei. Scoring for WT1 expression was based on the proportion of cells in a given tissue sample exhibiting distinct nuclear immunopositivity (percentage scale: 0, 5, 10, 20, 30, 40, 50, 60, 70, 80, 90, and 100). The WT1 scoring results were transformed into a two-tiered scale (level 1 (negative): less than 10%, level 2 (positive): equal or more than 10%) [Citation22].
2.4 Wound healing assay
Cells were seeded in 6-well plates and grown to full confluence in complete medium. The monolayer of cells was scratched with a sterile 100 μL pipette tip. The wounded areas were observed and imaged under microscope at 0, 24, and 48 h after scratches.
2.5 Transwell invasion assay
The invasive ability of the cells was performed in 24-well plates with 8.0-μm pore size chamber inserts (Corning, USA). The upper surface of the filter was coated with 50 μL of Matrigel (BD Biosciences, San Jose, CA) diluted 1:6 in serum-free medium. Approximately 5 × 10⁴ cells were placed in the upper chamber and cultured in serum-free medium, and 500 μL medium with 10% FBS was added to the lower chambers. After 48 h, cells on the lower surface were fixed with 4% paraformaldehyde, stained with 0.1% crystal violet, and counted under an inverted microscope.
2.6 Quantitative real-time PCR (qRT-PCR)
Total RNA was extracted from tissues and cells using TRIzol (15,596,026, Invitrogen). A High Capacity RNA-to-cDNA Kit (Applied Biosystems) was used to synthesize the first strand of cDNA. The total cDNA was used as starting materials for RT-PCR with SYBR Green PCR Master Mix (Yeasen, Shanghai, China). All primer sequences are listed in Supplementary Table S1. Conditions for detecting mRNAs were used: 95°C for 10 min, 40 cycles of 95°C for 15 s, and 60°C for 1 min. All target gene transcripts were normalized to GAPDH using the 2−ΔΔCT method.
2.7 Western blotting analysis
The tissues and cultured cells were homogenized with lysis buffer with protease inhibitors. Proteins were separated by SDS-PAGE on a 10% gel and were transferred to nitrocellulose (NC) membranes. After blocking with 5% nonfat milk, the membranes were incubated with primary antibodies against WT1 (ab89901, Abcam), E-cadherin (ab1416, Abcam), Vimentin (sc-6260, Santa Cruz Biotechnology), p-AKT (4060, CST), AKT (4691,CST), p-RPS6 (Ser235/236) (2211,CST), RPS6 (2217,CST), p-ERK1/2 (Thr202/204) (4370, CST), ERK1/2 (4695, CST), and anti-GAPDH (sc-47,724, Santa Cruz Biotechnology) overnight at 4°C, followed by secondary antibodies for 2 h at room temperature. The protein bands were visualized in the membranes using an Enhanced Chemiluminescence Detection Kit (Pierce Biotechnology, USA), and Image J software (National Institutes of Health, USA) was used to measure the band intensities. GAPDH was used as the internal control.
2.8. Flow cytometry analysis
Cells were digested by 0.25% trypsin-EDTA, harvested and fixed in 70% ethanol overnight at 4°C. Then, cells were resuspended in PBS, followed by incubation with propidium (PI), RNase A and staining solution (Cat# 40,310, Yeasen, Shanghai, China) in the dark. After filtration through 37 μm mesh, 10, 000 cells were analyzed by flow cytometry (BD FACSVerse, BD Company) with ModFit software (Verity Software House, Inc.).
2.9 Luciferase reporter assay
The −178 bp to +92 bp of E-cadherin promoter fragment cloned in pGL3 vector was gifted by Prof. Antonio García de Herreros (Institut Municipal d’Investigació Mèdica, Universitat Pompeu Fabra, Spain). The E-cadherin promoter with the mutated binding site (GGTGGG at −146 bp was mutated to TTTGTT) was cloned into the luciferase reporter vector and named mutant. SKOV3 cells were seeded into 12-well plates and cotransfected with pMCV3-WT1, pMCV3 as control, and luciferase reporter vectors using Lipofectamine 2000 (Invitrogen). After 48 hours, cells were harvested and the luciferase activity was measured by the dual-luciferase reporter assay system (Cat#: E2920, Promega).
2.10 Chromatin immunoprecipitation (ChIP)
Cells were crosslinked with 1% formaldehyde for 10 min at 37°C and then quenched in 125 mM glycine on ice for 5 min. Cell lysates were sonicated under conditions yielding fragments ranging from 200 bp to 1000 bp. The material was clarified, and pre-cleared with protein A-agarose beads. The supernatant was used in immunoprecipitation reactions with antibodies against WT1, or rabbit IgG (Upstate 12–370) as a control. Eluted chromatin was amplified using specific E-cadherin primers (−180 Forward AACTCCAGGCTAGAGGGTCA; +31 Reverse TCACAGGTGCTTTGCAGTTC) that flanked three potential WT1 binding sites in the promoter region of E-cadherin. All ChIP experiments were repeated three times with different chromatin preparations.
2.11 Animal xenograft tumor model
Female BALB/c nude mice (6 wk old) were purchased from Beijing Vital River Laboratory Animal Technology Co., Ltd. (Beijing, China). All animal experiments were conducted according to the standard institutional guidelines of Nanjing Medical University (Nanjing, China), and the current experiments were approved by the Use Committee for Animal Care. WT1- depleted SKOV3 cells or control cells (3 × 10⁷) in 0.1 mL Matrigel (1:1) were injected subcutaneously into the right upper flank of the nude mice. Sixteen mice were randomly divided into two groups. Eight mice were used for WT1-depleted cell injection and eight for control cell injection. The tumor volume in mm3 was calculated as (length×width2)/2. Mice were sacrificed 8 wk post cell injection and tumors were isolated for western blot.
2.12 Hematoxylin-eosin staining
The mouse samples were obtained and fixed in 10% formalin for 24 h at room temperature. Then, the samples were embedded in paraffin and stained with hematoxylin-eosin (H&E) staining to obtain histological samples of the tumor. Five random areas of interest were examined in each section and images were obtained using a microscope.
2.11 Statistical analysis
All statistical analysis was performed with SPSS 11.0. Statistical data were presented as mean ± SD and compared using Student’s t test or one-way ANOVA. The comparison of categorical data was done using Chi-square test. P < 0.05 was considered statistically significant.
3. Results
3.1 WT1 expression is upregulated in OC tissues and negatively related to E-cadherin expression
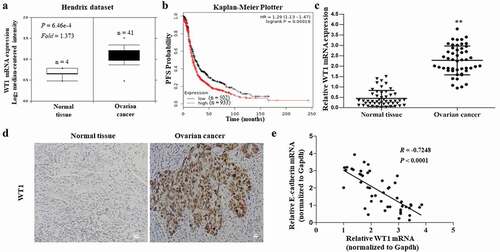
To determine the clinical significance of WT1 in OC, we first examined WT1 mRNA levels in human OC using Oncomine cancer microarray database [Citation23] (https://www.oncomine. org/resource). According to the Hendrix dataset (P value = 6.46e-4, fold change = 1.373), WT1 transcript levels were significantly elevated in clinical human OC tissues compared to the normal tissues ()). We next assessed the effect of WT1 on the survival of patients with OC in the Kaplan–Meier Plotter database [Citation24] (http://www.kmplot.com/) and observed that WT1 expression was closely associated with the progression-free survival of patients with OC [Log-rank P = 0.00018, HR = 1.29 (1.13–1.47)] ()). Then, a panel of 49-paired tissue specimens of OC and adjacent normal tissues were tested by qRT-PCR and immunohistochemistry. We found that WT1 mRNA expression was upregulated in OC tissues ()) and WT1 staining was positive in 33 out of 49 OC tumor sections, while none of the 49 adjacent normal tissue sections stained positive for WT1 (representative images shown in )). Moreover, we found patients with high WT1 expression also had low expression of E-cadherin; thus, a linear correlation test was performed using the mRNA expression of WT1 and E-cadherin, showing WT1 expression was negatively related to E-cadherin expression (R = −0.7248, P < 0.0001) ()). In addition, we further assessed the relationship between WT1 mRNA expression and clinicopathological features in the 49 patients. As shown in , the WT1 expression level was higher in serous OC tumors than in non-serious histology (ovarian mucinous cystadenocarcinoma, ovarian clear cell carcinoma, and ovarian endometrioid carcinomas). The expression of WT1 was also higher in tumors at an advanced FIGO stage and high grade. These data confirm that WT1 is upregulated in human OC and may play an important role in the progression of OC.
Figure 1. Clinical significance of WT1 in human ovarian cancer. A, Box plots of WT1 mRNA levels in OC tissues and normal ovarian tissues in the Oncomine cancer microarray database. B, Kaplan-Meier curves of progression-free survival (PFS) probability in OC patients with high levels of WT1 expression (red) as compared to those with low WT1 expression levels (black). C, The mRNA expression of WT1 in OC tissues and their matched non-tumor counterparts in the 49 patients. ** P < 0.01. D, Representative images of immunohistochemistry staining for WT1 in OC tissues and their paired non-tumor tissues. Magnification x 10. Bar = 20 μm. E, A linear correlation study was performed between mRNA expression of WT1 vs. E-cadherin in OC tissues of the 49 patients
3.2 Knockdown of WT1 may not affect OC cell proliferation
To strengthen the hypothesis that WT1 is primarily expressed in human OC cells, we compared WT1 expression levels in OC cell lines (SKOV3, A2780, HO8910 and HO8910PM) and normal human ovarian cell line (IOSE386) by using qRT-PCR and western blot assays. We found that the expression of WT1 mRNA and protein was similar in IOSE386 and A2780 cells, but significantly higher in SKOV3 and HO8910PM cells (,b)) (Note: HO8910PM OC cells are more metastatic than the parental H8910 human OC cells) [Citation25,Citation26]. Considering 93.22% of the contaminants in cell lines established in laboratories of China were HeLa cells or a possible hybrid of HeLa with an unknown cell line [Citation27], the HPV18 E6 expression was examined in OC cell lines HO8910PM, SKOV3 and A2780, compared with HeLa cells using qRT-PCR. As shown in Supplementary Figure S1, these OC cells did not express HPV18 E6, indicating our cell lines can be used for the following studies. To study the role of WT1 in OC carcinogenesis, we then generated WT1-depleted SKOV3 and HO8910PM cell lines using a lentiviral approach. Among the four LV3-WT1 shRNAs tested in SKOV3 cells, LV3-WT1-#4 construct showed the most significant inhibitory effect on WT1 expression and therefore was selected for further analysis (Supplementary Figure S2). The WT1 knockdown efficiency was confirmed via qRT-PCR and western blotting in both SKOV3 and HO8910PM cells (P < 0.01) (,d)). Conversely, to evaluate the effect of WT1 overexpression on OC, we transfected A2780 cells with pCMV3 or pCMV3-WT1 vector and showed an increase of WT expression by western blotting ()).
Figure 2. WT1 knockdown and overexpression in ovarian cancer cell lines. (a,b) WT1 expression in four ovarian cancer cell lines (SKOV3, A2780, HO8910, HO8910PM) and normal human ovarian cell line (IOSE386) was examined using qRT-PCR and western blot assay. GAPDH used as loading control. ** P < 0.01 represents difference in SKOV3 and HO8910PM cell lines compared with IOSE386, respectively. (c,d) The knockdown efficiency of WT1 was detected by qRT-PCR and western blotting in SKOV3 and HO8910PM cells. GAPDH served as loading control. (e) The overexpression efficiency of WT1 was examined by western blotting in A2780 cells. The graph on the right of figures B and D, or lower panel of figure E showed the quantification of the results. The data were presented as the mean ± SD from three experimental replicates. **P < 0.01 compared with the compared group
To test whether WT1 affects OC cell proliferation, we first performed the cell cycle analysis by flow cytometry. Results showed no significant change in the percentage of cells in the G0/G1 phase and G2/M phase after WT1 knockdown on SKOV3 and HO8910PM cells in contrast with their controls (Supplementary Figure S3A, B). Then, the fold increase in cell proliferation was tested using CCK-8at 24-h intervals. As shown in Supplementary Figure S3C, WT1 depletion as well as WT1 overexpression did not show a significantly different growth rate compared with the controls for up to 3 d. Taken together, these results reveal that WT1 may not affect the proliferation of OC cells.
3.3 WT1 promotes OC cell migration and invasion
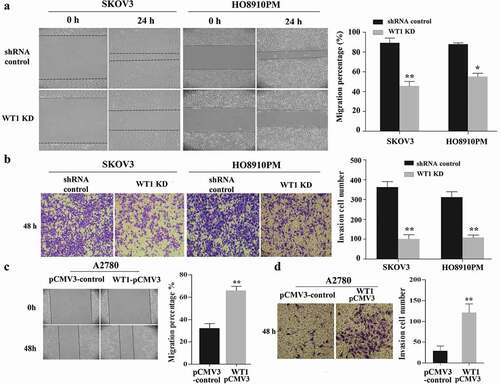
We next explored the function of WT1 in OC cell migration and invasion. The effect of WT1 knockdown on OC cell migration was tested using wound-healing assay. Results showed that WT1 depletion significantly reduced the ability of SKOV3 and HO8910PM cells to migrate into the wound compared to the controls ()). Then, we performed transwell invasion assay across a Matrigel membrane and found WT1 knockdown significantly weakened cell invasion capabilities of SKOV3 and HO8910PM cells compared with their controls ()). Moreover, we examined the effect of WT1 overexpression on OC cell migration and invasion. The wound healing and transwell assays demonstrated that exogenous expression of WT1 markedly enhanced the migration and invasion capacity of A2780 cells compared with the controls ()). These data indicate WT1 may promote OC cell invasion and migration.
Figure 3. WT1 enhances cell migration and invasion in ovarian cancer. (a,c) Representative images of wound-healing assay with WT1 knockdown in SKOV3 and HO8910PM cells or WT1 overexpression in A2780 cells. (b,d) Transwell assay showing that the invasive ability of SKOV3 and HO8910PM cells was significantly suppressed after WT1 silencing and WT1 overexpression promoted the invasion capacity of A2780 cells. The right panel showed the quantitative results. The data were presented as the mean ± SD from three experimental replicates. *P < 0.05, **P < 0.01
3.4 Silencing WT1 reverses EMT via upregulation of E-cadherin in OC cells
EMT is a biological phenomenon in which cells lose the characteristics of epithelial cells and acquire the characteristics of mesenchymal cells under certain conditions, and is closely related to in situ infiltration and distant metastasis of multiple tumors [Citation17,Citation18]. To identify whether WT1 can promote OC cell EMT, we evaluated the expression of E-cadherin (an epithelial marker) and Vimentin (a mesenchymal marker) in SKOV3 and HO8910PM cells by qRT-PCR and western blot analyses. As shown in ), WT1 silencing resulted in an increase in the expression of E-cadherin and a decrease in Vimentin at both mRNA and protein levels. We also found decreased WT1 slightly inhibited the expression of ZEB1 and Twist, while no difference was observed in Snail expression after WT1 knockdown (Supplementary Figure S4).
Figure 4. Silencing WT1 reverses EMT in ovarian cancer cells and correlates with an increase in E-cadherin expression. (a,b) qRT-PCR and western blot were used to detect changes in the mRNA and protein expression of EMT-associated genes in WT1 knockdown SKOV3 and HO8910PM cells. (c) ChIP-qPCR analysis of WT1 binding at E-cadherin proximal promoter region at the −146 bp upstream of the transcription start site in SKOV3 cells. Data were normalized to the percent of Input. (d) Luciferase activity of reporter construct carrying E-cadherin promoter in SKOV3 cells in the presence of indicated amounts of WT1 expression vector to test the effect of WT1 on E-cadherin promoter. E, Luciferase activity of wild type or mutant E-cadherin proximal promoter containing a mutated −146 WT1 binding site with pCMV3-WT1 or pCMV3. Luciferase activity was measured and normalized to protein concentration. Data are reported relative to luciferase activity of pCMV3 transfected cells. The data were presented as the mean ± SD from three experimental replicates. * indicated P < 0.05; ** indicated P < 0.01
Previous studies in prostate cancer cells have shown that WT1 can target E-cadherin proximal promoter at −146 bp upstream of the transcription start site and mediate transcriptional repression of E-cadherin [Citation20]. To confirm that WT1 could also target this proximal promoter region in OC cells, we performed WT1 ChIP in SKOV3 cells. Results showed endogenous WT1 to be enriched at the proximal promoter region of E-cadherin gene ()). To further determine whether WT1 transcriptionally regulates E-cadherin promoter activity in SKOV3 cells, the wild type or mutated (WT1 binding site at −146bp) E-cadherin reporter construct was co-transfected along with increasing doses of pCMV3-WT1 in SKOV3 cells. The following luciferase reporter assay showed that WT1 overexpression significantly inhibited luciferase activity of the construct containing the wild type E-cadherin promoter, but not that of mutated one (,e)), indicating that WT1 could promote EMT by downregulation of E-cadherin via direct binding to its promoter in OC cells.
3.5 WT1 may suppresses E-cadherin expression via activation of ERK signaling
Accumulated evidences have confirmed that E-cadherin expression can be down-regulated in cancer cells in response to extracellular stimuli through activation of the AKT/mTOR and MEK/ERK signaling pathways [Citation28,Citation29]. In the present study, we explored whether WT1 could regulate the EMT of OC cells via AKT and ERK signaling pathways. As shown in ), WT1 knockdown did not affect the activation of AKT, or RPS6 in SKOV3 cells. However, silencing WT1 led to a significant decrease of ERK1/2 phosphorylation. Moreover, overexpression of WT1 could promote the phosphorylation level of ERK1/2 and decrease the E-cadherin expression in a dose-dependent manner ()). To further explore the potential role of WT1 in ERK1/2 regulated E-cadherin downregulation, we treated WT1-overexpressed A2780 cells with the MEK1/2 inhibitor U0126 and then tested the E-cadherin expression levels. Results showed that U0126 inhibited ERK1/2 phosphorylation and upregulated E-cadherin expression ()), suggesting that WT1 may also regulate E-cadherin expression via ERK1/2 signaling. We next treated WT1-overexpressed A2780 cells with U0126 and then tested cell migration and invasion. Results showed that inhibiting ERK1/2 phosphorylation significantly decreased WT1-induced OC migration and invasion ()). Collectively, these results demonstrate that WT1 may also have the ability to promote EMT via activation of ERK1/2 signaling in OC cells.
Figure 5. WT1 promotes EMT through ERK1/2 phosphorylation. (a) Western blotting to detect p-Akt, Akt, p-RPS6, RPS6, p-ERK1/2, ERK1/2 and E-cadherin expression in WT1 knockdown and shRNA control SKOV3 cells. (b) Overexpression of WT1 obviously changed the expression levels of E-cadherin and p-ERK1/2 in a dose-dependent manner. (c) The protein expression of E-cadherin and p-ERK1/2 was determined in WT1-overexpressed A2780 cells treated with U0126. (d,f) Wound healing and transwell assays were performed to detect the migration and invasion capacity of A2780 cells treated with pCMV3 vector and different concentrations (0 μM, 10 μM, 20 μM) of U0126 after the de novo expression of WT1 separately. The panel on the right of figures A, B, D, E or lower panel of figure C showed the quantification of the results. The data were presented as the mean ±SD from three experimental replicates. *P < 0.05; ** P < 0.01
3.6 WT1 is essential for tumor metastasis of OC in mice
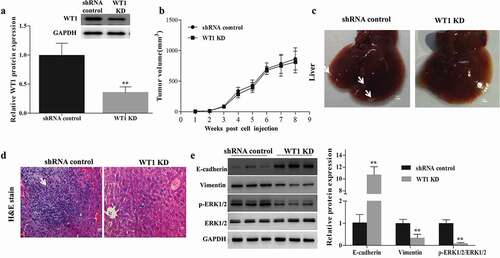
To investigate the role of WT1 in promoting migration and invasion of OC cells, an in vivo assay was performed by injecting WT1 knockdown or shRNA control tumor cells subcutaneously into the right flank of nude mice, separately. First, we confirmed the knockdown efficiency of WT1 in established tumors by western blotting. As expected, the tumors in mice inoculated with WT1-depleted cell lines had diminished expression of WT1 ()). Next, the tumor volume of each group was determined, and no significant difference was found ()). However, the tumor metastases in livers with small hepatic nodules (white arrow) spreading throughout the liver surface, developed in 5 out of 8 mice (62.5%) injected with the control SKOV3 cells, whereas no such metastasis was observed in 8 mice (0%) injected with WT1 KD cells ()). Histological analysis on the livers confirmed the metastasis foci in the shRNA control tumors ()). Moreover, to test whether the difference of tumor metastasis is dependent on EMT and ERK1/2 activity, we compared the expression of EMT-related indicators and ERK1/2 activation in the xenograft mouse tumor samples. Results showed that the tumors from the mice inoculated with WT1 KD cell lines had an up-regulated level of E-cadherin and diminished expression of Vimentin and p-ERK1/2 ()), suggesting that WT1-ERK1/2-EMT pathway may also be involved in the regulation of metastatic process of OC cells in vivo.
Figure 6. WT1 depletion reduces SKOV3 cells metastasis in vivo. (a) Western blotting was performed to confirm the knockdown efficiency of WT1 in established tumors. (b) Tumor growth curves were summarized in the line chart. (c) Image of metastatic liver nodules spreading throughout the live tissues in mice injected with shRNA control SKOV3 cells. WT1 knockdown clearly abolished the metastasis. White arrows indicated tumor foci. Bar = 1 mm. (d) Hematoxylin and eosin (H&E) staining was used to visualize the metastatic nodules in tumors from mice injected with shRNA control SKOV3 cells. The arrow indicated tumor foci. Magnification x 20. Bar = 50 μm. E, Western blot was performed to detect changes in the protein expression of EMT-associated genes proteins and ERK1/2 activation in the xenograft mouse primary tumors from the mice inoculated with WT1 KD cells compared to the controls. The lower panel of figure A or the panel on the right of figure E showed the quantification of the results. ** P < 0.01
4. Discussion
Numerous studies report that WT1 exerts an oncogenic role rather than a tumor-suppressive role in the development and progression of different types of cancers [Citation30]. For instance, higher WT1 expression is associated with higher histological stage and worse prognosis in breast cancer [Citation31], or advanced tumor stage of head and neck squamous cell carcinoma [Citation32]. In the current study, we found WT1 was highly expressed in OC tissues compared with non-tumor ovaries. We also noticed WT1 expression in OC was more associated with adverse prognostic factors including advanced stage, high grade and progression-free survival. These findings suggest that WT1 may be involved in regulating OC progression. Then, we investigated the role of WT1 on OC cell malignant behavior and found that the depletion of WT1 suppressed the ability of OC cells (SKOV3 and HO8910PM) to migrate and invade in vitro, while overexpression of WT1 promoted the invasion and migration of OC cell line A2780. Besides, WT1 knockdown also suppressed the ability of SKOV3 tumors to metastasize in vivo. These findings suggest that WT1 may promote tumor metastasis in OC. It is also worth noting that WT1 expression is characteristic of the serous phenotype, especially high-grade serous ovarian cancer (HGSOC), with much lesser degrees of staining of other morphological subtypes of ovarian carcinoma [Citation33,Citation34]. Given that various histological types of OC cause different biological behavior, and that OC cell lines used in this study (e.g. SKOV3, A2780) do not represent a good approximation of the HGSOC genotype [Citation35], we will further explore the mechanisms of WT1 on different subtypes of OC with representative cell models in future studies.
Apart from the analysis in aspects of cell invasiveness and migration capability, our investigation also focused on the influence of WT1 on EMT. Recent researches have displayed that WT1 is implicated in the regulation of mesenchymal cell maintenance and EMT during the development of mesodermal tissues [Citation36,Citation37]. Downregulation of E-cadherin is thought to promote metastasis during early carcinogenesis progression [Citation38] and has been reported to occur by many transcript factors such as Snail, WT1 and ZEB1/2 [Citation19,Citation39]. Many studies have characterized the relationship between WT1 and its downstream molecule E-cadherin. WT1 controlled epicardial EMT and the subsequent generation of vasculature progenitors through direct transcriptional regulation of Snail and E-cadherin, two of the major mediators of EMT [Citation19]. WT1 transcriptionally repressing E-cadherin in prostate cancer cells may contribute to migration and metastasis [Citation20]. WT1 expression was correlated with clinical stage, metastasis, and survival rate in non-small-cell lung cancer patients by suppressing E-cadherin via direct binding to the promoter [Citation21]. Here, we provided evidence demonstrating, in OC cells, WT1’s functions on EMT are also through transcriptionally repressing E-cadherin expression via targeting its proximal promoter region. Our study indicated that direct suppression of E-cadherin by WT1 may demonstrate an evident link between EMT and the oncogenic function of WT1, enhancing migration and metastasis of OC cells. Though Vimentin expression is also affected upon WT1 depletion in OC cells, we did not observe the direct binding of WT1 on Vimentin promoter. It could be the reason, to the best of our knowledge, that Vimentin promoter does not contain WT1 binding site. Alternatively, Vimentin promoter contains an NF-κB site, a PEA3-binding site, tandem AP-1 binding sites, and a β-catenin/TCF binding site [Citation39–41]. WT1 may indirectly target to these regions though interacting with such transaction factors. We will test these hypotheses in our future studies.
WT1 also appeared to be involved in cell signaling and has different effects on the activation of the PI3K/AKT and ERK1/2 pathways in cancer cells. Graziano et al. found WT1 could act as a tumor promoter in osteosarcoma via PI3K/AKT pathway. WT1 was also involved in the autophagy in osteosarcoma cells and proliferation of malignant peripheral nerve sheath tumors through the PI3K/AKT pathway [Citation42,Citation43]. Moreover, accumulative evidence showed that WT1 could mediate the development of Wilms’ tumors and the activation of the KRAS proto-oncogene through ERK1/2 phosphorylation [Citation44–46]. In the present study, we found WT1 did not affect the activation of AKT, but significantly modulate ERK1/2 activation in OC cells. Inhibiting ERK1/2 phosphorylation could upregulate E-cadherin expression and reverse WT1-induced migration and invasion of OC cells. Our data indicated WT1 may also enhance OC cell migration and invasion through activating ERK1/2 signaling. Previous ChIP-DNA selection and ligation (DSL) experiment identified a cohort of genes whose promoters were targeted by WT1 and showed these WT1-bound targets were enriched in cell apoptosis, Wnt signaling pathway, MAPK signaling, cell migration, cell proliferation and cell adhesion [Citation47]. Possibly, WT1 may activate ERK1/2 signaling by regulation of transcription factors, such as sprouty1 [Citation48,Citation49]. Further studies aimed at the identification of additional WT1 co-factors, such as those that regulate the ERK1/2 signaling, will help explain the full range of WT1 activity in OC metastasis.
In summary, the present study explored the link between WT1 and EMT and their potential roles in OC metastasis. We provided here that WT1 promoted migration, invasion and EMT in OC cells. Mechanistically, we showed that WT1 acted as an oncogene in the progression of OC via negative modulation of E-cadherin by directly binding to its promoter and promoting EMT process through indirect downregulation of E-cadherin via activating ERK1/2 pathway. Our studies may help establish WT1 as a good target for therapeutic intervention in advanced ovarian cancer treatment.
Supplemental Material
Download Zip (699.3 KB)Acknowledgments
The authors thank Prof. Antonio García de Herreros for the gift of luciferase plasmid.
Disclosure statement
The authors declare no conflict of interest.
Supplementary material
Supplemental data for this article can be accessed here.
Additional information
Funding
Related Research Data
References
- Siegel RL, Miller KD, Jemal A. Cancer statistics, 2018. CA Cancer J Clin. 2018;68(1):277–300.
- Piver MS, Baker TR, Piedmonte M, et al. Epidemiology and etiology of ovarian cancer. Semin Oncol. 1991;18(3):177–185.
- Weidle UH, Birzele F, Kollmorgen G, et al. Targets involved in dissemination of ovarian cancer. Cancer Genomics Proteomics. 2016;13(6):407–423.
- Cortez AJ, Tudrej P, Kujawa KA, et al. Advances in ovarian cancer therapy. Cancer Chemother Pharmacol. 2018;81(1):17–38.
- Wang ZH, Xu CJ. Research progress of MicroRNA in early detection of ovarian cancer. Chin Med J (Engl). 2015;128(24):3363–3370.
- Toska E, Roberts SG. Mechanisms of transcriptional regulation by WT1 (Wilms’ tumour 1). Biochem J. 2014;461(1):15–32.
- Hohenstein P, Hastie ND. The many facets of the Wilms’ tumour gene, WT1. Hum Mol Genet. 2006;15 Spec(2):R196–201.
- Lindstedt I, Lindgren MA, Andersson E, et al. WT1 gene–its role in tumourigenesis and prospects for immunotherapeutic advances. In Vivo. 2014;28(5):675–681.
- Yamamoto S, Tsuda H, Kita T, et al. Clinicopathological significance of WT1 expression in ovarian cancer: a possible accelerator of tumor progression in serous adenocarcinoma. Virchows Arch. 2007;451(1):27–35.
- Taube ET, Denkert C, Sehouli J, et al. Wilms tumor protein 1 (WT1)– not only a diagnostic but also a prognostic marker in high-grade serous ovarian carcinoma. Gynecol Oncol. 2016;140(3):494–502.
- Hylander B, Repasky E, Shrikant P, et al. Expression of Wilms tumor gene (WT1) in epithelial ovarian cancer. Gynecol Oncol. 2006;101(1):12–17.
- Barbolina MV, Adley BP, Shea LD, et al. Wilms tumor gene protein 1 is associated with ovarian cancer metastasis and modulates cell invasion. Cancer. 2008;112(7):1632–1641.
- Gupta R, Yang Q, Dogra SK, et al. Serine hydroxymethyl transferase 1 stimulates pro-oncogenic cytokine expression through sialic acid to promote ovarian cancer tumor growth and progression. Oncogene. 2017;36(28):4014–4024.
- Jomgeow T, Oji Y, Tsuji N, et al. Wilms’ tumor gene WT1 17AA(-)/KTS(-) isoform induces morphological changes and promotes cell migration and invasion in vitro. Cancer Sci. 2006;97(4):259–270.
- Lee BH, Hecht JL, Pinkus JL, et al. WT1, estrogen receptor, and progesterone receptor as markers for breast or ovarian primary sites in metastatic adenocarcinoma to body fluids. Am J Clin Pathol. 2002;117(5):745–750.
- Vergara D, Merlot B, Lucot JP, et al. Epithelial-mesenchymal transition in ovarian cancer. Cancer Lett. 2010;291(1):59–66.
- Lee GA, Hwang KA, Choi KC. Roles of dietary phytoestrogens on the regulation of epithelial-mesenchymal transition in diverse cancer metastasis. Toxins (Basel). 2016;8(6):162.
- Gloushankova NA, Zhitnyak IY, Rubtsova SN. Role of epithelial-mesenchymal transition in tumor progression. Biochemistry (Mosc). 2018;83(12):1469–1476.
- Martínez-Estrada OM, Lettice LA, Essafi A, et al. Wt1 is required for cardiovascular progenitor cell formation through transcriptional control of Snail and E-cadherin. Nature Genet. 2010;42(1):89–93.
- Brett A, Pandey S, Fraizer G. The Wilms’ tumor gene (WT1) regulates E-cadherin expression and migration of prostate cancer cells. Mol Cancer. 2013;12:3.
- Wu C, Zhu W, Qian J, et al. WT1 promotes invasion of NSCLC via suppression of CDH1. J Thorac Oncol. 2013;8(9):1163–1169.
- Høgdall EV, Christensen L, Kjaer SK, et al. Expression level of Wilms tumor 1 (WT1) protein has limited prognostic value in epithelial ovarian cancer: from the Danish “MALOVA” ovarian cancer study. Gynecol Oncol. 2007;106(2):318–324.
- Rhodes DR, Yu J, Shanker K, et al. ONCOMINE: a cancer microarray database and integrated data-mining platform. Neoplasia. 2004;6(1):1–6.
- Győrffy B, Surowiak P, Budczies J, et al. Online survival analysis software to assess the prognostic value of biomarkers using transcriptomic data in non-small-cell lung cancer. PLoS One. 2014;9(10):e111842.
- Xu S, Mou H, Lü G, et al. Gene expression profile differences in high and low metastatic human ovarian cancer cell lines by gene chip. Chin Med J (Engl). 2002;115(1):36–41.
- Sun P, Jiang Z, Chen X, et al. Decreasing the ratio of matriptase/HAI-1 by downregulation of matriptase as a potential adjuvant therapy in ovarian cancer. Mol Med Rep. 2016;14(2):1465–1474.
- Ye F, Chen C, Qin J, et al. Genetic profiling reveals an alarming rate of cross-contamination among human cell lines used in China. Faseb J. 2015;29(10):4268–4272.
- Lau MT, So WK, Leung PC. Fibroblast growth factor 2 induces E-cadherin down-regulation via PI3K/Akt/mTOR and MAPK/ERK signaling in ovarian cancer cells. PLoS One. 2013;8(3):e59083.
- Kim EY, Kim A, Kim SK, et al. Inhibition of mTORC1 induces loss of E-cadherin through AKT/GSK-3β signaling-mediated upregulation of E-cadherin repressor complexes in non-small cell lung cancer cells. Respir Res. 2014;15(1):26.
- Yang L, Han Y, Suarez Saiz F, et al. A tumor suppressor and oncogene: the WT1 story. Leukemia. 2007;21(5):868–876.
- Qi XW, Zhang F, Yang XH, et al. High Wilms tumor 1 mRNA expression correlates with basal-like and ERBB2 molecular subtypes and poor prognosis of breast cancer. Oncol Rep. 2012;28(4):1231–1236.
- Oji Y, Inohara H, Nakazawa M, et al. Overexpression of the Wilms’ tumor gene WT1 in head and neck squamous cell carcinoma. Cancer Sci. 2003;94(6):523–529.
- Al-Hussaini M, Stockman A, Foster H, et al. 1 assists in distinguishing ovarian from uterine serous carcinoma and in distinguishing between serous and endometrioid ovarian carcinoma. Histopathology. 2004;44(2):109–115.
- Netinatsunthorn W, Hanprasertpong J, Dechsukhum C, et al. WT1 gene expression as a prognostic marker in advanced serous carcinoma: an immunohistochemical study. BMC Cancer. 2006;6:90.
- Mitra AK, Davis DA, Tomar S, et al. In vivo tumor growth of high-grade serous ovarian cancer cell lines. Gynecol Oncol. 2015;138(2):372–377.
- Smith BN, Bhowmick NA. Role of EMT in Metastasis and Therapy Resistance. J Clin Med. 2016;5(2):17.
- Chau YY, Hastie ND. The role of Wt1 in regulating mesenchyme in cancer, development, and tissue homeostasis. Trends Genet. 2012;28(10):515–524.
- Zeisberg M, Neilson EG. Biomarkers for epithelial-mesenchymal transitions. J Clin Invest. 2009;119(6):1429–1437.
- Comijn J, Berx G, Vermassen P, et al. The two-handed E box binding zinc finger protein SIP1 downregulates E-cadherin and induces invasion. Mol Cell. 2001;7(6):1267–1278.
- Wu Y, Zhang X, Salmon M, et al. TGF beta1 regulation of vimentin gene expression during differentiation of the C2C12 skeletal myogenic cell line requires Smads, AP-1 and Sp1 family members. Biochim Biophys Acta. 2007;1773(3):427–439.
- Gilles C, Polette M, Mestdagt M, et al. Transactivation of vimentin by beta-catenin in human breast cancer cells. Cancer Res. 2003;63(10):2658–2664.
- Mo H, He J, Yuan Z, et al. WT1 is involved in the Akt-JNK pathway dependent autophagy through directly regulating Gas1 expression in human osteosarcoma cells. Biochem Biophys Res Commun. 2016;478(1):74–80.
- Parenti R, Cardile V, Graziano AC, et al. Wilms’ tumor gene 1 (WT1) silencing inhibits proliferation of malignant peripheral nerve sheath tumor sNF96.2 cell line. PLoS One. 2014;9(12):e114333.
- Hu Q, Gao F, Tian W, et al. 1 ablation and Igf2 upregulation in mice result in Wilms tumors with elevated ERK1/2 phosphorylation. J Clin Invest. 2011;121(1):174–183.
- Vicent S, Chen R, Sayles LC, et al. Wilms tumor 1 (WT1) regulates KRAS-driven oncogenesis and senescence in mouse and human models. J Clin Invest. 2010;120(11):3940–3952.
- Morrison DJ, Kim MK, Berkofsky-Fessler W, et al. WT1 induction of mitogen-activated protein kinase phosphatase 3 represents a novel mechanism of growth suppression. Mol Cancer Res. 2008;6(7):1225–1231.
- Li Y, Wang J, Li X, et al. Role of the Wilms’ tumor 1 gene in the aberrant biological behavior of leukemic cells and the related mechanisms. Oncol Rep. 2014;32(6):2680–2686.
- Gross I, Morrison DJ, Hyink DP, et al. The receptor tyrosine kinase regulator Sprouty1 is a target of the tumor suppressor WT1 and important for kidney development. J Biol Chem. 2003;278(42):41420–41430.
- Hanafusa H, Torii S, Yasunaga T, et al. Sprouty 1 and Sprouty2 provide a control mechanism for the Ras/MAPK signalling pathway. Nat Cell Biol. 2002;4(11):850–858.