
ABSTRACT
Transcriptional repressor GATA binding 1 (TRPS1) is a newly discovered transcription factor, which has been reported in many tumors, except for gastric cancer (GC). In this study, we aimed to grope for clinical significance and biological function of TRPS1 in GC. TRPS1 expression in GC and its relationship with clinicopathological features were analyzed based on public databases, and verified by immunohistochemistry and RT-qPCR. Kaplan-Meier survival curve and Cox regression model were used to estimate the influence of TRPS1 on the univariate prognosis and multivariate survival risk factors of GC. The effects of TRPS1 on malignant biological behaviors of GC cells were studied by CCK8 cell proliferation, scratch test, and Transwell assay. The function of TRPS1 was further analyzed by signaling pathway analysis. TRPS1 mRNA expression in GC tissues was up-regulated and was of great significance in some prognostic factors. Protein expression of TRPS1 in tumor tissues was significantly higher than that in paracancerous tissues. Over-expression of TRPS1 was a poor prognostic indicator for GC patients. TRPS1 knockdown could inhibit the proliferation, migration, and invasion of GC cells. The important role of TRPS1 was in the extracellular matrix, and it was involved in actin binding and proteoglycan in cancer. The hub genes of TRPS1 (FN1, ITGB1) were defined. TRPS1 may be a tumor promoter and promote the development of GC by influencing the malignant biological behaviors of GC. TRPS1 is expected to be a key diagnostic and prognostic indicator for GC patients.
KEYWORDS:
Introduction
Digestive tract tumors are prevalent worldwide, among which gastric cancer (GC) ranks as the third deadliest cancer in the world and carries a poor prognosis [Citation1]. In 2019, 27,510 new cancer cases and 11,140 deaths are estimated in the United States [Citation2]. Male sex, smoking, old age, Helicobacter pylori infection, and poor dietary habits are the main risk factors for GC [Citation3]. One of the main reasons leading to poor prognosis and high mortality in GC patients is the lack of effective early diagnostic means and methods. Early GC lacks specific clinical symptoms and can be easily mistaken for other common benign conditions of the digestive tract, which are not given as much attention by patients. Although endoscopy is widely carried out in domestic hospitals, many patients with GC are diagnosed in the late stages due to differences in health-care availability in China, hence losing the opportunity for effective treatment and resulting in a poor prognosis. Surgery and chemotherapy are the main treatments for GC currently, with other options including immunotherapy and targeted therapy. However, the development of other treatment methods is limited to a small number of patients, and the efficacy is obviously different among individuals. Researchers worldwide have been studying the mechanisms of GC pathogenesis, but the precise details of its molecular mechanism are still unclear. Therefore, exploring the pathogenesis and mechanism of GC progression can provide important clues for its diagnosis and treatment.
The transcriptional repressor GATA binding 1 gene (TRPS1) contains nine predicted zinc finger structure domains, including seven classical C2H2 structure domains, which are related to the transcription factors TF IIIA, GATA C4 domain, and the Ikaros C2H2 zinc finger structure domain [Citation4]. Similar to GATA3, TRPS1 contains a GATA DNA-binding region, which is located in the human chromosome 8q23-24 and functions as a nuclear zinc finger protein and a novel nuclear transcription factor [Citation5,Citation6]. TRPS1 may play a role as a transcriptional inhibitor or activating agent, depending on the cell type, developmental stage, or pathological conditions [Citation7]. In recent years, it has been found that TRPS1 is aberrantly expressed in many solid malignant tumors and its protein product is specifically expressed in different tumor tissues; its expression level varies according to the origin of the tumor tissue and significantly influences angiogenesis, tumor growth, cell cycle, cell proliferation, migration, apoptosis, and metastasis [Citation8,Citation9]. In breast cancer, miR-221 activation can inhibit the expression of TRPS1, thereby inhibiting TRPS1-regulated zinc finger E-box binding homeobox 2 (ZEB2) to promote the occurrence of epithelial-mesothelial transformation and enhancing the ability of breast cancer cells to invade and migrate [Citation10]. TRPS1 has also been reported in colon cancer, ependymoma, and other cancers, but there are no scientific reports on TRPS1 in GC [Citation11,Citation12]. The expression and molecular mechanism of TRPS1 in GC are hence unclear.
Therefore, based on the combination of data obtained from public databases and experiments, this paper preliminarily explored the expression and clinical value of TRPS1 in GC, as well as the effects of TRPS1 on malignant biological behaviors of GC cells. We further analyzed the function of TRPS1 in GC by signaling pathway analysis, so as to provide ideas and clues for the further study of the potential regulatory mechanism of TRPS1 in GC and to understand its clinical significance to develop therapeutic strategies for controlling the metastasis of GC and improving the prognosis and survival time of GC patients. An outline of the experiments performed in this study is shown in .
Figure 1. The flowchart of the present study
Materials and methods
Extraction of GC-related data from TCGA and GEO databases
Based on high-throughput sequencing data of gastric tissues in GC patients and healthy populations in the cancer genome atlas (TCGA) database, TRPS1 expression data were extracted. The expression data of TRPS1 in GC and healthy population were log-2 transformed level-3 RNA-seq data. At the same time, the corresponding clinicopathological data of TRPS1 in GC were acquired from the TCGA data portal. The data were exported to Microsoft Office Excel 2013 for integration and statistical analysis of relevant clinical parameters. On the basis of our previous work, we re-screened and updated these microarrays from the Gene Expression Omnibus (GEO) database to further confirm the expression level of TRPS1 in GC [Citation13]. The search terms entered into the GEO included (“stomach” OR “gastric” OR “GC”[Mesh]) AND (“cancer” OR “carcinoma” OR “tumor” OR “neoplas*” OR “malignan*” [Mesh]). Datasets were selected based on the following inclusion criteria: (1) Species were human, (2) samples must be gastric tissues, (3) samples included both experimental and control groups, (4) both groups had at least three samples, (5) the data were the level of mRNA expression, and (6) all tissues were from patients who had never received radiotherapy or chemotherapy. The exclusion criteria were as follows: (1) the dataset samples were from cells or blood, (2) species were not human, and (3) the number of GC or non-cancer specimens was less than 3 cases. We integrated all the data for meta-analysis and conducted standardized mean difference (SMD), sensitivity analysis, and publication bias analysis by continuous variable data, including the number of examples, mean, and standard deviation. We removed the batch effect of these datasets using the R statistical package to make the data more reliable.
Collection of clinical specimens and information
Gastric cancer and paracancerous tissues were collected from 60 patients with GC who were hospitalized and operated on in the First Affiliated Hospital of Guangxi Medical University from January 2018 to February 2019. All tissue samples were fixed with 10% formalin and embedded in paraffin. Gastric tissues located 2 cm away from the tumor were taken as controls. All patients did not receive radiotherapy, chemotherapy, or other auxiliary treatment before the operation, and all GC cases were confirmed by pathological analysis. The tissue sections were examined independently by two pathologists. The clinicopathological information of the patients was acquired from the medical records of the hospital. The use of specimens and the acquisition of data were approved by the patients (or their families) and the Ethics Committee of the First Affiliated Hospital of Guangxi Medical University.
Immunohistochemical detection and interpretation
TRPS1 expression in paraffin tissues was detected by the Evision two-step method. Immunohistochemical staining was carried out according to the manufacturer’s instructions and the TRPS1 monoclonal antibody (Abcam Company, Shanghai, China) was diluted 1:200 and used as the primary antibody. Rabbit universal second antibody (D-3004) was purchased from long Island Company, Shanghai, China. Double-blind interpretation of the results was carried out by two pathologists. The expression level of TRPS1 in tissues was graded as follows. The grading criteria were as follows: (1) the positive expression of TRPS1 protein was located in the nucleus, (2) the TRPS1 expression of cells was graded on a scale from 0 (negative) to 3 (strong), (3) the proportion of positive cells in the sample was stratified according to following classification system: 0% – 0 point; ≤5% – 1 point; 6–25% – 2 points; 26–50% – 3 points; >50% – 4 points, and (4) if the product of positive cell score and positive cell ratio score was ≥8, TRPS1 was considered to be highly expressed; otherwise, TRPS1 was considered to be weakly expressed [Citation14].
Cell culture
All cell lines were purchased from Shanghai Zhongqiao Xinzhou Biotechnology Co., Ltd. Two human GC cell lines, MGC-803 and HGC-27, were cultured in basic culture medium 1640 supplemented with 1% cystreptomycin (100X) and 10% fetal bovine serum (FBS) (Invitrogen Crop., NY, USA). Human gastric normal mucosal cells (GES-1) were cultured in DEME hyperglycemic medium with 1% penicillin-streptomycin (100X) and 10% FBS. All cells were cultured in a 37°C incubator with 5% CO2 under aseptic conditions. The growth of the cells was observed daily and the cells were sub-cultured when confluent.
RT – qPCR
The extraction of total cell RNA was carried out in strict accordance with the instructions of the RNA simple total RNA extraction kit (TIANGEN Company, Beijing, China). The reverse transcription of the extracted RNA was carried out according to the instructions of the Roche reverse transcription kit. The primers for the expression of TRPS1 in tumor cells were as follows: TRPS1 forward (5'-3'): GGAAAGCAAAGAACACTCATGT; TRPS1 reverse (5'-3'): CTTTGATGGTGGATATGGCATG; internal reference gene GAPDH forward (5'-3'): GTCAGCCGCATCTTCTTT; GAPDH reverse (5'-3'): CGCCCAATACGACCAAAT. The Applied Biosystems 7500 machine was used for fluorescence quantitative PCR and the target gene TRPS1 and internal reference gene GAPDH were quantified at the same time. The samples were preheated at 95°C for 10 min, followed by 40 cycles of denaturing at 95°C for 10 s and annealing at 60°C for 60 s. The 2−ΔΔCt method was used to calculate the relative expression of TRPS1 in GC cells.
Cellular immunochemistry
The localization and expression of TRPS1 protein were visualized in three groups of cell lines by cellular immunochemistry as described above in the “immunohistochemical detection and interpretation” section.
Plasmid transfection
TRPS1 knockdown plasmid, empty plasmid, and glycerin bacteria were constructed by Jikai Biology in China and verified by sequencing. After plasmid amplification, the MGC-803 cell line, derived from primary poorly differentiated adenocarcinoma, was selected, and the extracted TRPS1 knockdown plasmid and the corresponding empty plasmid were transiently transferred into MGC-803 cells using the transfection reagent lipo3000. The target plasmid used in this experiment contains a pCMV promoter and encodes a green fluorescent protein (GFP). After the plasmid was transfected into GC cells, green fluorescence could be observed in successfully transfected cells under an epifluorescence microscope. The transfection efficiency and pCMV activity of the cells were preliminarily evaluated according to the degree of green fluorescence. After the MGC-803 cell line was transfected for 48 h, the plasmid transfection efficiency was more than 70% and the knockdown efficiency of TRPS1 in MGC-803 cells was quantified by qRT-PCR.
CCK8 cell proliferation test
When the transiently transfected cells in each group were in the logarithmic phase, a cell suspension with concentration of 1 × 10⁴ cells/mL was inoculated into 96-well plates (200 μL cell suspension per well, about 2000 cells), with 6 technical replicates per sample, and then cultured in a 37°C incubator for 24 h, 36 h, 48 h, or 60 h. Subsequently, 100 μL of 10% Cell Counting Kit-8 (CCK8) solution (Meilun Biotechnology Co., Ltd., China) was added to each well and the 96-well plates were further cultured in an incubator for 1.5–2 h. The absorbance of each well at the wavelength of 450 nm was measured with a multifunctional microporous plate reading instrument.
Scratch test
The suspended cells at 80% confluency were inoculated in 6-well plates and cultured overnight in a sterile cell incubator at 37°C to allow the cells to reach full confluency. After removing the old medium, a liquid transfer gun with a 200 μL tip, along with a sterilized measuring ruler, was used to cross-scratch the layer of cells. The scratches were observed under an inverted microscope and images were taken after 12 h, 24 h and 48 h.
Transwell migration and invasion test
When the transiently transfected cells were in the logarithmic phase, a Transwell chamber was placed on a 24-well plate and 200 μL of cell suspension and 500 μL of complete medium containing 10% FBS were sucked into the upper chamber and the lower chamber, respectively. The culture medium in the chamber was washed and transferred to a well containing 500 μL of 4% polymethanol and fixed for 30 min after being cultured for 24 h in the sterile incubator at 37°C and 5% CO2. 500 μL of 1% crystal violet solution was added to each well of the clean 24-well plate and the chamber was transferred to the orifice plate and dyeing was performed for 20 min. Five visual fields were randomly selected under an inverted microscope and the number of cells penetrating the membrane were counted and images were taken. In each 200X high power field, the average number of transmembrane cells was calculated.
BD Matrigel (5 mg/mL) was diluted in the serum-free medium precooled at 4°C in the proportion of 1:7. At the bottom of the upper chamber, 100 μL of diluted Matrigel was added vertically and incubated in the sterile cell incubator at 37°C for 3–5 h. When a “white layer” appeared, the uncondensed matrix glue in the chamber was absorbed and the remaining steps were the same as Transwell migration test.
Statistical analysis
The data were reported as mean ± standard deviation. The difference in expression of TRPS1 between the two groups was analyzed by the student’s t-test and the difference in expression among the three groups was analyzed by one-way analysis of variance (ANOVA). P < 0.05 was considered to be statistically significant. The evaluation of the effect of TRPS1 on the prognosis of GC was conducted by the Kaplan-Meier survival analysis and the Cox regression model. The meta-analysis was carried out with Stata 12.0. To identify the diagnostic ability of cancer from non-cancerous tissues of each group, we calculated the area under the curve (AUC) and drew receiver-operating curves (ROC) with SPSS 22.0. The pooled sensitivity (SEN), specificity (SPE), positive LR (LR+), negative LR (LR-), and diagnostic odds ratio (DOR) with their corresponding 95% confidence intervals and the summary receiver operator characteristic (SROC) curve were constructed on MetaDiSc 1.4 by binary variable, including true positives (TP), false positives (FP), false negatives (FN), and true negatives (TN). Correlation analysis and chi-square test were analyzed by SPSS 22.0. In the CCK8 proliferation test, scratch test, Transwell migration, and invasion test, the difference between the TRPS1 knockdown plasmid group and empty plasmid group were calculated by SPSS 22.0 and student’s t-test. The scatter plot, dot chart, bar chart, and growth curve were drawn using GraphPad Prism 8.0.
Signaling pathway analysis
In order to further analyze the function of TRPS1 in GC, the co-expressed genes of TRPS1 were obtained from each dataset obtained using the R language and the genes related to TRPS1 were identified by comprehensive analysis. These related genes were analyzed according to the Gene ontology (GO) enrichment and Kyoto Encyclopedia of Genes and Genomes (KEGG) pathway by R. At the same time, all related genes were entered into the online String (http://string-db.org/) analysis software with the confidence score >0.7 for protein–protein interaction (PPI) network analysis [Citation15,Citation16,Citation17,Citation18]. The genes with the largest number of nodes in PPI were identified as hub genes. Subsequently, the expression of these hub genes in GC and their correlation with TRPS1 were statistically analyzed based on the TCGA database.
Results
TRPS1 expression in GC based on public databases
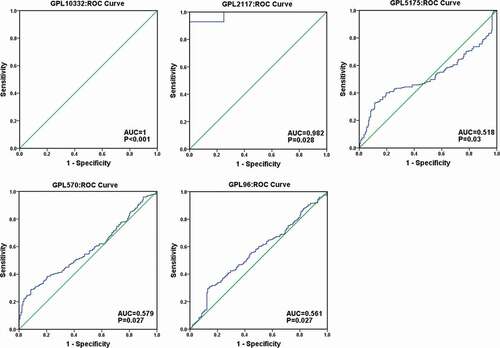
To comprehensively analyze the differential expression of TRPS1 in GC, a total of 35 microarrays were classified and merged through the platform. Finally, 22 platform datasets were obtained. A total of 1650 GC samples and 842 non-tumor samples were collected by integrating 22 platform datasets with TCGA data. Meta-analysis showed the pooled SMD of TRPS1 was 0.28 (95% CI: 0.09–0.48, P < 0.001) and TRPS1 expression in GC was heterogeneous ()). The pooled SMD was greater than 0 and 95% confidence interval did not intersect invalid lines, indicating that TRPS1 was highly expressed in GC. Sensitivity analysis showed that heterogeneity had little effect on this study, and funnel diagrams also showed no publishing bias (,c)). In addition, the SEN, SPE, LR+, LR-, and DOR of TRPS1 were 77.0% (75.0%-79.0%), 38.0% (35.0%-40.0%), 1.29 (1.10–1.52), 0.62 (0.42–0.91), and 2.49 (1.34–4.61) respectively, and the SROC of TRPS1 was 0.6585 (). At the same time, the ROC curve showed that TRPS1 had obvious diagnostic value in GC (). The above results were consistent with our previous findings and indicated that TRPS1 was highly expressed in GC.
Figure 2. Meta-analysis of TRPS1 expression in gastric cancer. (a) Forest plot of studies calculating the standard mean difference (SMD) of TRPS1 expression based on the random effect model; (b) Sensitivity analysis; (c) Begg’s funnel plot
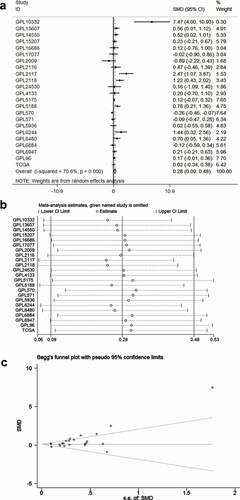
Figure 3. The diagnostic accuracy of TRPS1 in gastric cancer. The pooled sensitivity, specificity, positive LR, negative LR, diagnostic odds ratio, and the SROC of TRPS1 were 77.0% (75.0%-79.0%), 38.0% (35.0%-40.0%), 1.29 (1.10–1.52), 0.62 (0.42–0.91), 2.49 (1.34–4.61), and 0.6585 separately (a, b, c, d, e, f). SROC, summary receiver operator characteristic
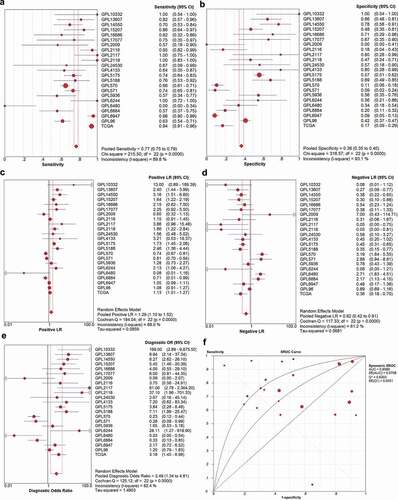
Figure 4. The meaningful ROC curve of TRPS1 expression to diagnose gastric cancer based on 23 datasets
Clinical significance of TRPS1 in GC based on TCGA data
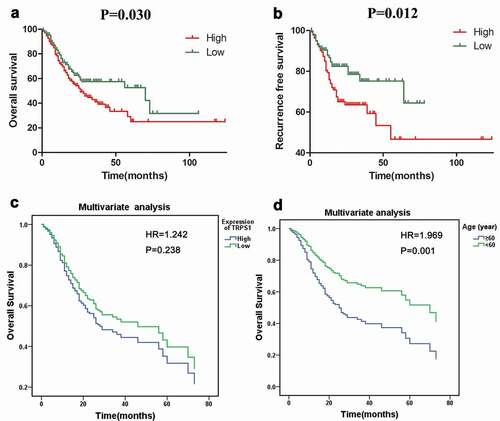
From the expression of TRPS1 in each clinical pathology parameter, TRPS1 expression significantly varied by age, neoplasm histologic grade, histological type, and T stage in GC patients (). As shown in , TRPS1 was significantly over-expressed in patients over 60-y-old, non-intestinal type GC, high-grade pathology, and stage T3-4 GC. In this prognostic study, the mean value of TRPS1 expression in GC was 9.477 and was set as the threshold for TRPS1 expression. Kaplan-Meier survival curve analysis indicated that the overall survival time of GC patients with high TRPS1 expression was lower (P = 0.030) ()). Meanwhile, the recurrence-free survival time of GC patients with high TRPS1 expression was also lower than those with low TRPS1 expression (P = 0.012) ()). Moreover, Cox multivariate analysis also suggested that the overall survival time of GC patients with high TRPS1 expression and over 60 was shorter (,)). But there was no statistical value for the difference in the multivariate analysis except age (P = 0.001) ().
Table 1. The expression level of TRPS1 in different groups of clinical parameters
Table 2. Cox regression analysis of the effect of TRPS1 expression for overall survival in gastric cancer patients
Figure 5. The relative expression level of TRPS1 in gastric cancer tissues and its relationship with clinicopathological parameters in STAD patients based on public databases. (a) TRPS1 expression levels in STAD patients aged ≥60 y and aged < 60 y; (b) TRPS1 expression levels in STAD patients of non-intestinal type and intestinal type; (c) TRPS1 expression levels in grade 1–2 and grade 3 patients; (d) TRPS1 expression levels in T1–2 and T3–4 patients. STAD, stomach adenocarcinoma
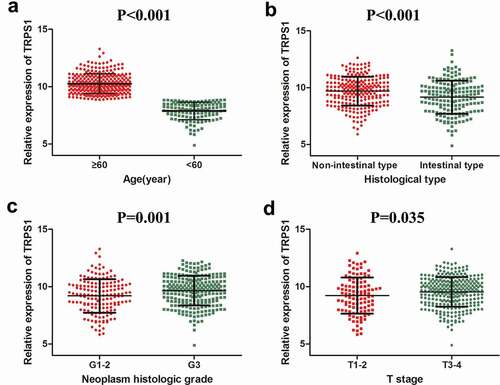
Figure 6. Analysis of the relationship between TRPS1 expression and survival of gastric cancer patients. (a) The relationship between TRPS1 expression and overall survival of gastric cancer patients illustrated in a Kaplan-Meier curve; (b) The relationship between TRPS1 expression and recurrence-free survival of gastric cancer patients illustrated in a Kaplan-Meier curve; (c) Cox multivariate regression analysis of the effect of TRPS1 expression level on the overall survival of gastric cancer patients; (d) Cox multivariate regression analysis of the effect of age on the overall survival of gastric cancer patients. HR, hazard ratio
TRPS1 protein expression in tissues and its relationship with clinicopathological parameters
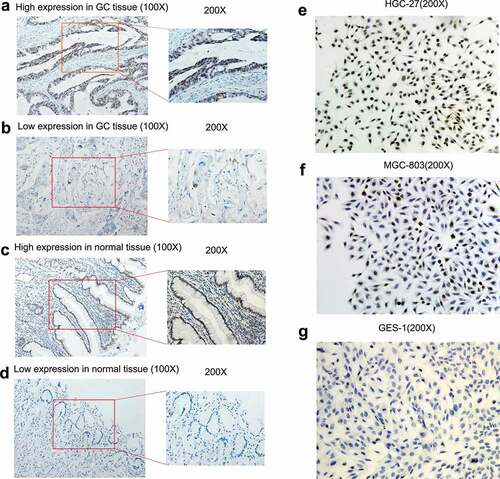
The expression level of TRPS1 protein in GC tissues and normal gastric mucosa was assessed by immunohistochemistry ( and -d)). The nuclear staining was brown-yellow or brown-brown and the expression of TRPS1 protein was located in the nucleus, so the higher TRPS1 expression, the deeper the staining. TRPS1 protein expression was high in 27 (45.0%) of our 60 GC tissue samples and low in 33 (55.0%) samples. In the corresponding 60 cases of adjacent normal gastric mucosa tissues, TRPS1 protein expression was high in 5 (8.3%) samples and low in 55 (91.7%) samples. The rate of high TRPS1 protein expression in GC was more significant (P < 0.001). As shown in , TRPS1 was significantly differentially expressed in tumor node metastasis (TNM) staging and lymph node metastasis groups of GC patients. In GC patients with stage III–IV disease, TRPS1 protein expression was significantly higher than that in stage I–II patients (P = 0.027). In GC patients with lymph node metastasis, the expression level of TRPS1 was higher than that of patients without lymph node metastasis (P = 0.036). However, TRPS1 expression was not correlated with age, gender, nationality, tumor size, tumor location, H. pylori infection, differentiation degree, T stage, distant metastasis, vascular thrombus, and nerve invasion clinical parameters of gastric cancer patients. Spearman correlation analysis indicated that TRPS1 expression in GC was positively correlated with TNM stage (r = 0.289, P = 0.027), as well as with lymph node metastasis (r = 0.272, P = 0.037).
Table 3. Relationship between TRPS1 expression and clinicopathological features in gastric cancer
Figure 7. The expression level of TRPS1 protein in gastric cancer tissues and cells assessed by immunohistochemistry. (a, b) Expression of TRPS1 protein in gastric cancer tissue; (c, d) Expression of TRPS1 protein in normal gastric mucosa; (e) Expression of TRPS1 protein in HGC-27 gastric cancer cells; (f) Expression of TRPS1 protein in MGC-803 gastric cancer cells; (g) Expression of TRPS1 protein in normal GES-1 gastric mucosa cells. Magnification: 100X & 200X (a, b, c, d); 200X (e, f, g)
Localization and expression of TRPS1 in cells
TRPS1 expression was localized in the nuclei of the GC cell lines HGC-27 and MGC-803 and presented as brown-yellow staining in the nuclei (-g)). The proportion of HGC-27 cells that were positive for TRPS1 protein was more than 70%, which was relatively strong positive expression ()). The proportion of MGC-803 cells that were positive for TRPS1 protein was about 30%, which was relatively weakly positive, while the expression of TRPS1 protein was negative in GES-1 cells (,g)). In the previous work, it was found that TRPS1 mRNA expression in HGC-27 and MGC-803 cells was higher than that in GES-1 cells (which are non-cancerous) and the expression level was the highest in HGC-27 cells [Citation13].
Efficiency of plasmid transfer into GC cells and evaluation of TRPS1 knockdown
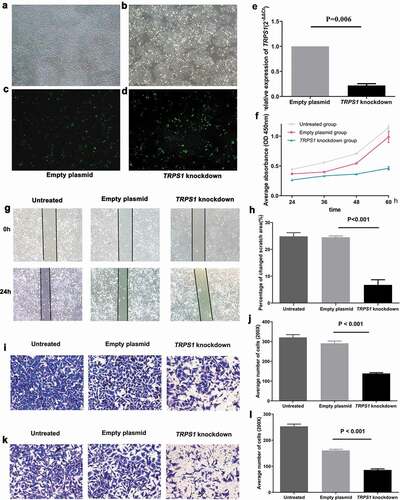
The transfection efficiencies of gastric cancer cells in the TRPS1 knockdown group and the empty plasmid group were measured. The green fluorescence of GC cells was observed under a fluorescence microscope at 24 h and 48 h after transfection of the plasmid with the lipo3000 transfection kit. After 48 hours of TRPS1 knockdown and empty plasmid transfer to MGC-803 cells, the percentages of green fluorescent cells in the TRPS1 knockdown group and the empty plasmid group were both more than 70%, indicating satisfactory transfer efficiency (-d)). RT-qPCR results showed that TRPS1 expression in the TRPS1 knockdown plasmid group was 22% of that in the empty plasmid group (P = 0.006) ()), which indicated that TRPS1 knockdown GC cells had been successfully produced.
Figure 8. Construction of TRPS1 knockdown gastric cancer cells and cell function in vitro. (a) The distribution of MGC-803 gastric cancer cells transfected with empty plasmid; (b) The green fluorescence emitted by MGC-803 with empty plasmid according to cell distribution; (c) The distribution of MGC-803 gastric cancer cells transfected with TRPS1 knockdown plasmid; (d) The green fluorescence emitted by MGC-803 with TRPS1 knockdown plasmid according to cell distribution; (e) The relative expression of TRPS1 in MGC-803 gastric cancer cells transfected with empty plasmid and TRPS1 knockdown plasmid; (f) The proliferation of gastric cancer cells in three groups; (g) The map of cell scratches in three groups; (h) The percentage change in scratch area in three groups; (i) The membrane penetration of cells in three groups by Transwell migration test; (j) The average number of transmembrane cells in three groups by Transwell migration test; (k) The membrane penetration of cells in three groups assessed by the Transwell invasion test; (l) The average number of transmembrane cells in three groups by the Transwell invasion test. Magnification: 40X (a, b, c, d); Magnification: 200X (g, i, k)
The effect of TRPS1 in cell proliferation, migration and invasion
The proliferation of GC cells in the untreated group, TRPS1 knockdown group, and empty plasmid group was quantified using the CCK8 cell proliferation kit. The proliferation trend of each group was shown in . During the growth of GC cells from 24 h to 60 h, the average cell proliferation rates of TRPS1 knockdown group, empty plasmid group, and untreated group were 74.8%, 267.8%, and 157.3%, respectively. The proliferation rate of GC cells in the TRPS1 knockdown group was the lowest (P < 0.001). This showed that the down-regulation of TRPS1 could reduce the proliferation of GC cells.
After the GC cells in TRPS1 knockdown group, empty plasmid group, and untreated group were scratched simultaneously, we observed that the area occupied by cells migrating to the midline of the scratch in the TRPS1 knockdown group was significantly reduced compared with that of the empty plasmid group (P < 0.001) (,h)). The influence of TRPS1 on the migration of GC cells was verified by the Transwell migration test ()). After 24 h, the average number of transmembrane cells in the untreated group, empty plasmid group, and TRPS1 knockdown group were 321, 291, and 139, respectively ()). The average number of transmembrane cells in the TRPS1 knockdown group was significantly lower than that in the empty plasmid group (P < 0.001). The above results confirmed that the down-regulation of TRPS1 also could inhibit the migration of GC cells.
The effect of TRPS1 on the invasion of GC cells was studied by the Transwell invasion test (,l)). After 24 h, the average numbers of transmembrane cells in untreated group, empty plasmid group, and TRPS1 knockdown group under 200X microscope were 253, 161, and 86, respectively ()). The average number of transmembrane cells in the TRPS1 knockdown group was also significantly lower (P < 0.001). This result indicates that down-regulation of TRPS1 could inhibit the invasiveness of GC cells.
The potential mechanism of TRPS1 in GC
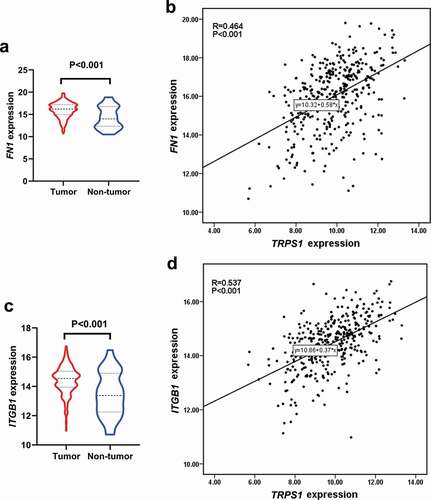
By only including genes with a correlation coefficient of greater than 0.3, a total of 114,462 co-expressed genes were obtained. Of these, 550 genes existed in all 11 datasets and were regarded as TRPS1-related genes. As can be seen from the GO enrichment, 240 terms in biological processes (BP), 53 terms in cellular components (CC), and 23 terms in molecular functions (MF) were significant (P < 0.01). Additionally, 37 KEGG pathways were regulated by these genes (P < 0.05). The first 10 items in each group of GO enrichment and the first 20 items in KEGG pathway were presented by a dot chart and a histogram, respectively (). Among these terms, the most enriched GO biological process was “extracellular structure organization,” the most enriched GO cellular component was “extracellular matrix,” the most enriched GO molecular function was “actin binding,” and the most enriched KEGG pathway was “proteoglycans in cancer.” After the minimum required interaction score with high confidence (0.7) was entered into STRING, 321 nodes and 849 edges were included in the PPI network ()). The first 30 items with a maximum number of nodes were presented ()). The maximum number of two genes (FN1 and ITGB1) were used as hub genes. As shown in , the two genes are highly expressed in GC and positively correlated with TRPS1. These results revealed the potential mechanism of TRPS1 in GC and the functional correlation between GC-related proteins.
Figure 9. GO enrichment dot diagram and KEGG pathway histogram of TRPS1 and related genes. (a) The first ten items in biological processes (BP) of GO enrichment; (b) The first ten items in cellular components (CC) of GO enrichment; (c) The first ten items in molecular functions (MF) of GO enrichment; (d) The first twenty items in the KEGG pathway. GO, Gene Ontology; KEGG, Kyoto Encyclopedia of Genes and Genomes
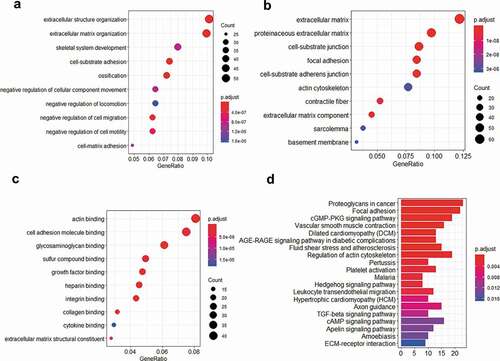
Figure 10. The PPI network of the related genes of TRPS1. (a) A total of 321 nodes and 849 edges were included in the PPI network; (b) The first thirty items with a maximum number of nodes. PPI, protein‑protein‑interaction
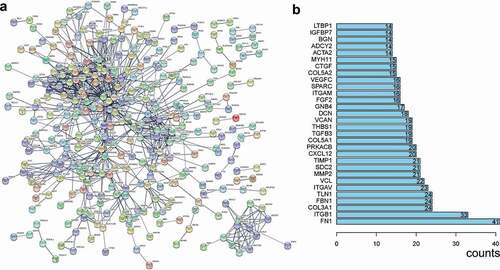
Figure 11. Expression of hub genes in gastric cancer and their correlation with TRPS1 based on the TCGA database. (a) Expression of FN1 in gastric cancer group compared with the non-tumor group; (b) Correlation between FN1 and TRPS1; (c) Expression of ITGB1 in the gastric cancer group compared with the non-tumor group; (d) Correlation between ITGB1 and TRPS1. TCGA, the cancer genome atlas; FN1, fibronectin 1; ITGB1, integrin β1
Discussion
GC is one of the most common malignant tumors of the digestive tract and a major cause of death. The occurrence and development of GC involves many different factors. One of the most important molecular mechanisms is the activation of oncogenes and the loss of function of anti-oncogenes. The transcription factor TRPS1 is a nonspecific transcription suppressor of the GATA family. Some studies have shown that TRPS1 is a major controller of proliferation and the cell cycle in the process of tumorigenesis and occupies a critical position in the regulation of a variety of tumors [Citation8]. Our study aimed to analyze TRPS1 expression in GC and its relationship with clinicopathological characteristics and to assess the effects of TRPS1 on the malignant biological behaviors of GC cells, so as to provide theoretical and experimental bases for further study of the molecular mechanism of TRPS1 in GC.
The expression pattern of the TRPS1 coding protein varies according to the origin of the tumor tissue [Citation19]. Currently, it is known that the TRPS1 protein is over-expressed in most tumors, but its differential expression also plays a different role in tumors. TRPS1 expression in breast cancer is remarkably high and its high expression is associated with a good prognosis in stage II–III breast cancer patients [Citation20,Citation21,Citation22]. At the same time, the study of the regulatory mechanism of TRPS1 found that high levels of TRPS1 could inhibit the further development of breast cancer via inhibition of the epithelial–mesothelial transition, participating in the decomposition of the TP63 enhancer and inhibiting the expression of ΔNp63, and targeting the transcription of the estrogen receptor (ER) [Citation10,Citation20,Citation23,Citation24]. All the studies on TRPS1 in breast cancer have shown that TRPS1 in breast cancer is a tumor suppressor, mainly due to lineage-limited expression. However, Hong Jun and others have found that TRPS1 mRNA and protein expression in colon tumor tissues are high and positively correlated with lymph node metastasis and advanced pathological stage in colon cancer patients; multivariate analysis confirmed that TRPS1 may be considered as an independent prognostic risk indicator for colon cancer [Citation11]. Therefore, there is speculation that TRPS1 may be an oncogenic factor in colon tumors. It was also found that TRPS1 mRNA and protein expression were positively correlated in colon cancer [Citation11]. This suggests that the expression patterns and regulatory mechanisms of TRPS1 in different cancer types are quite different.
Based on previous work, TRPS1 mRNA expression was further verified in GC from other public data platforms and the clinicopathological characteristics and prognosis of TRPS1 were analyzed in GC. These results also confirmed that TRPS1 expression in GC tissues was up-regulated and was of great significance in some aspects, including age, tumor pathological grade, histological classification, T stage, and other indicators involved in poor prognosis of GC patients. We also calculated the ROC of each dataset and the summary SROC, suggesting that TRPS1 was valuable in the diagnosis of GC. Survival analysis and Cox multivariate analysis suggested that over-expression of TRPS1 was a poor prognostic indicator for GC patients, and that TRPS1 may play a role as an oncogene in the development process of GC. Moreover, age is an important factor in the differential expression of TRPS1 in GC and its prognostic significance. As cells divide more often with age, mutations accumulate, and genetic mutations are a key factor in tumors [Citation25]. Recent research has elucidated the mechanism by which gene mutations and canceration occur in normal tissues with age. They found that mutated cells often found in esophageal cancer, gradually increased in the esophageal epithelium with age, and that the proportion of the TP53 gene and chromosome abnormal cells, the most common abnormalities in cancer, also increased significantly, thus successfully identifying some of the mechanisms of cancer in older people [Citation26,Citation27]. So we hypothesized that the TRPS1 gene mutation gradually increases in the gastric mucosa with age, leading to GC. Therefore, this is consistent with the results of our study that TRPS1 gene was differentially expressed in GC of different ages and was more significantly expressed in elderly patients, and subsequently, the overall survival rate of elderly patients with GC was lower. We also speculated that TRPS1 may promote the invasion and metastasis of GC, thus affecting the prognosis of patients. Immunochemistry was performed to detect TRPS1 protein expression in 60 pairs of paraffin tissue specimens of GC patients and the relationship between TRPS1 expression and clinical features was evaluated and our results suggested that TRPS1 protein expression was also positively correlated with lymph node metastasis, as well as with pathological stage. Hence, we believe that TRPS1 is overexpressed in GC and its high expression has a bearing on several poor prognostic indicators, suggesting that TRPS1 may have a role in the development of GC and may be a GC oncogene.
It is well known that the occurrence and development of GC are influenced by many internal and external factors and are intricate processes involving many genes and multiple stages of development [Citation28,Citation29,Citation30]. Malignant biological behaviors such as invasion and metastasis can cause the conditions of GC patients to deteriorate rapidly, which is an important contributor to morbidity and mortality. The invasiveness and metastasis of tumor cells are important factors for the spread of cancer to distant sites. Among them, the imbalance of invasion and metastasis-related genes is one of the vital factors affecting the invasion and metastasis ability of tumor cells, which greatly affects the treatment efficacy and prognosis of patients [Citation30,Citation31,Citation32,Citation33]. Therefore, we further explored the effects of TRPS1 expression patterns in GC on the biological behaviors of GC cells. Through RT-qPCR, it was found that TRPS1 mRNA expression in HGC-27 and MGC-803 cells was significantly higher than that of the normal gastric cell line, GES-1 and the expression level was the highest in HGC-27. In this study, TRPS1 protein expression in the above three cell lines was detected by immunocytochemistry. It was also confirmed that the expression level of TRPS1 protein in HGC-27 and MGC-803 was significantly higher than that in GES-1 and was the highest in HGC-27, which suggested that the expression levels of TRPS1 mRNA and protein were consistent in GC cells.
Thereafter, TRPS1 was knocked down using transiently transfected plasmids to elucidate the effects of TRPS1 on the proliferation, migration, and invasion of GC cells. In vitro experimental studies showed that TRPS1 knockdown could significantly inhibit the proliferation, migration, and invasion of GC cells, suggesting that TRPS1 may play a role as an oncogenic factor in GC and could affect the metastatic behaviors of GC cells, which was consistent with clinical characteristics of TRPS1 and its expression pattern in GC. Our research showed that TRPS1 expression in GC tissues and cells was up-regulated and that down-regulation of TRPS1 could inhibit the proliferation, migration, and invasion of GC cells. As far as the mechanism of tumor is concerned, research efforts involving TRPS1 are still in the initial stages. The apparent genetic effect of TRPS1 regulation can be observed in the course of cell proliferation. TRPS1 is reported to be able to modulate the HDAC activity to control histone 3k9, k18, and histone 4k16 to promote cell proliferation [Citation9,Citation34]. Some studies have shown that the down-regulation of TRPS1 can inhibit the transcription of transcription factor FOXA1 in highly metastatic breast cancer cells, colon cancer cells, and nasopharyngeal carcinoma cell lines, thus promoting the occurrence of epithelial–mesenchymal transition and enhancing the migration and invasion of tumor cells [Citation35,Citation36]. In non-small cell lung cancer, the up-regulation of TRPS1 expression can inhibit the proliferation, invasion, and migration of tumor cells [Citation37]. The inhibitory effect of TRPS1 in non-small cell lung cancer and breast cancer is inconsistent with the effects of TRPS1 in GC. It is speculated that the reason may be that the function of TRPS1 is tissue-specific. It has been identified that TRPS1 may control the branches of mammary epithelial ducts by regulating transforming growth factor-β and knockdown TRPS1 could lead to mitosis, apoptosis, and tumor growth reduction, which is a pedigree-specific transcriptional inhibitor for the survival and mitosis of breast cancer cells [Citation38]. As TRPS1 is a transcription factor, its regulatory mechanism in GC may also be different from that in other tumors, and these specific differences need to be further elucidated.
Finally, we further analyzed of the function of TRPS1. By signaling pathway analysis, we analyzed the important role of TRPS1 in the extracellular matrix and noted that TRPS1 was involved in actin binding and proteoglycans in cancer. FN1 and ITGB1 were identified as the hub genes of TRPS1 by PPI. They were highly expressed in GC, and were positively correlated with TRPS1. It has been reported that fibronectin 1 (FN1) is up-regulated in GC and is also an important prognostic indicator [Citation39,Citation40]. In addition, the combination of miRNA-200 c and FN1 can inhibit the proliferation, invasion and migration of GC cells [Citation40]. This is consistent with the biological behavior and prognostic value of TRPS1 in GC cells. As for the relationship between ITGB1 and GC, it also has been found that integrin β1 (ITGB1) is up-regulated in GC and inhibition of ITGB1 significantly reduces the ability of GC cells to adhere to fibronectin, while decreased expression of ITGB1 results in a significant decrease in GC invasion and migration [Citation41]. This is also in line with our results regarding the expression pattern and function of TRPS1. Therefore, these data regarding the expression of TRPS1 in GC and the malignant biological behavior of GC cells are more convincing and strengthen the notion that TRPS1 is an oncogene in GC.
Conclusion
In summary, TRPS1 may be a tumor promoter in the development of GC and promote the development of GC by influencing the malignant biological behaviors of GC. Meanwhile, TRPS1 is expected to be one of the key diagnostic and prognostic indicators for GC patients and has great potential in molecular-targeted therapy for GC. Our research group will continue to focus on the still unclear molecular regulatory mechanism of TRPS1 in GC.
Supplemental Material
Download Zip (5.5 MB)Acknowledgments
The authors thank all the teachers and friends for their help and support.
Disclosure statement
Theauthors declare that they have no competing interests.
Data and material sharing statement
The datasets used during the current study are available from the corresponding author on reasonable request.
Supplementary material
Supplemental data for this article can be accessed here.
Additional information
Funding
Related Research Data
References
- Bray F, Ferlay J, Soerjomataram I, et al. Global cancer statistics 2018: GLOBOCAN estimates of incidence and mortality worldwide for 36 cancers in 185 countries. CA Cancer J Clin. 2018;68(6):394–424. .
- Siegel RL, Miller KD, Jemal A. Cancer statistics, 2019. CA Cancer J Clin. 2019;69(1):7–34.
- Marques-Lespier JM, Gonzalez-Pons M, Cruz-Correa M. Current perspectives on gastric Cancer. Gastroenterol Clin North Am. 2016;45(3):413–428.
- Gai Z, Gui T, Muragaki Y. The function of TRPS1 in the development and differentiation of bone, kidney, and hair follicles. Histol Histopathol. 2011;26(7):915–921.
- Wilke CM, Hess J, Klymenko SV, et al. Expression of miRNA-26b-5p and its target TRPS1 is associated with radiation exposure in post-Chernobyl breast cancer. Int J Cancer. 2018;142(3):573–583.
- Hu J, Su P, Jiao M, et al. TRPS1 suppresses breast cancer epithelial-mesenchymal transition program as a negative regulator of SUZ12. Transl Oncol. 2018;11(2):416–425.
- Rangel R, Lee SC, Hon-Kim Ban K, et al. Transposon mutagenesis identifies genes that cooperate with mutant Pten in breast cancer progression. 2016;113(48):E7749–e7758.
- Wu L, Wang Y, Liu Y, et al. A central role for TRPS1 in the control of cell cycle and cancer development. Oncotarget. 2014;5(17):7677–7690.
- Bach AS, Derocq D, Laurent-Matha V, et al. Nuclear cathepsin D enhances TRPS1 transcriptional repressor function to regulate cell cycle progression and transformation in human breast cancer cells. Oncotarget. 2015;6(29):28084–28103.
- Stinson S, Lackner MR, Adai AT, et al. miR-221/222 targeting of trichorhinophalangeal 1 (TRPS1) promotes epithelial-to-mesenchymal transition in breast cancer. Sci Signal. 2011;4(186):pt5.
- Hong J, Sun J, Huang T. Increased expression of TRPS1 affects tumor progression and correlates with patients’ prognosis of colon cancer. Biomed Res Int. 2013;2013:454085.
- Fischer SB, Attenhofer M, Gultekin SH, et al. TRPS1 gene alterations in human subependymoma. J Neurooncol. 2017;134(1):133–138.
- Huang ML, Wu H, Lu ZL. Expression of TRPS1 in gastric cancer and its bioinformatics analysis. Snake. 2019;31(2):188–192+ 201. (Chinese).
- Fan D. Expression of TRPS1 in epithelial ovarian cancer and its clinical significance [D]. China Medical University; 2018. (Chinese).
- Zhang L, Luo B, He RQ, et al. Clinical significance of microRNA-196b-5p in hepatocellular carcinoma and its potential molecular mechanism. J Cancer. 2019;10(22):5355–5370.
- Gao L, Zhang LJ, Li SH, et al. Role of miR-452-5p in the tumorigenesis of prostate cancer: a study based on the cancer genome atl (TCGA), gene expression omnibus (GEO), and bioinformatics analysis. Pathol Res Pract. 2018;214(5):732–749.
- Zhang Y, Li XJ, He RQ, et al. Upregulation of HOXA1 promotes tumorigenesis and development of non‑small cell lung cancer: a comprehensive investigation based on reverse transcription-quantitative polymerase chain reaction and bioinformatics analysis. Int J Oncol. 2018;53(1):73–86.
- He RQ, Wu PR, Xiang XL, et al. Downregulated miR-23b-3p expression acts as a predictor of hepatocellular carcinoma progression: a study based on public data and RT-qPCR verification. Int J Mol Med. 2018;41(5):2813–2831.
- Tremblay M, Sanchez-Ferras O, Bouchard M. GATA transcription factors in development and disease. Development. 2018;145:20.
- Su P, Hu J, Zhang H, et al. Association of TRPS1 gene with different EMT markers in ERalpha-positive and ERalpha-negative breast cancer. Diagn Pathol. 2014;9:119.
- Chen JQ, Bao Y, Litton J, et al. Expression and relevance of TRPS-1: a new GATA transcription factor in breast cancer. Horm Cancer. 2011;2(2):132–143.
- Lin HY, Zeng, Liang YK, et al. GATA3 and TRPS1 are distinct biomarkers and prognostic factors in breast cancer: database mining for GATA family members in malignancies. Oncotarget. 2017;8(21):34750–34761.
- Hu J, Su P, Jia M, et al. TRPS1 expression promotes angiogenesis and affects VEGFA expression in breast cancer. Exp Biol Med (Maywood). 2014;239(4):423–429.
- Wang Y, Lin X, Gong X, et al. Atypical GATA transcription factor TRPS1 represses gene expression by recruiting CHD4/NuRD(MTA2) and suppresses cell migration and invasion by repressing TP63 expression. Oncogenesis. 2018;7(12):96.
- Lee-Six H, Øbro NF, Shepherd MS, et al. Population dynamics of normal human blood inferred from somatic mutations. Nature. 2018;561(7724):473–478.
- Yokoyama A, Kakiuchi N, Yoshizato T, et al. Age-related remodelling of oesophageal epithelia by mutated cancer drivers. Nature. 2019;565(7739):312–317.
- Martincorena I, Fowler JC, Wabik A, et al. Somatic mutant clones colonize the human esophagus with age. Science (New York, NY). 2018;362(6417):911–917.
- Panarese I, De Vita F, Ronchi A, et al. Predictive biomarkers along gastric cancer pathogenetic pathways. Expert Rev Anticancer Ther. 2017;17(5):417–425.
- Karimi Kurdistani Z, Saberi S, Tsai KW, et al. MicroRNA-21: mechanisms of oncogenesis and its application in diagnosis and prognosis of gastric cancer. Arch Iran Med. 2015;18(8):524–536.
- Wang F, Meng W, Wang B, et al. Helicobacter pylori-induced gastric inflammation and gastric cancer. Cancer Lett. 2014;345(2):196–202.
- Chen D, Liu G, Xu N, et al. Knockdown of ARK5 expression suppresses invasion and metastasis of gastric cancer. Cell Physiol Biochem. 2017;42(3):1025–1036.
- You W, Xu L, Zhang X, et al. High-throughput screening identifies miR-451 as a pleiotropic modulator that suppresses gastric cancer metastasis. SLAS Technol. 2017;22(2):136–143.
- Zhao X, Li X, Yuan H. microRNAs in gastric cancer invasion and metastasis. Front Biosci (Landmark Ed). 2013;18:803–810.
- Wuelling M, Pasdziernik M, Moll CN, et al. The multi zinc-finger protein Trps1 acts as a regulator of histone deacetylation during mitosis. Cell Cycle. 2013;12(14):2219–2232.
- Huang JZ, Chen M, Zeng M, et al. Down-regulation of TRPS1 stimulates epithelial-mesenchymal transition and metastasis through repression of FOXA1. J Pathol. 2016;239(2):186–196.
- Huang R, Zong X. Aberrant cancer metabolism in epithelial-mesenchymal transition and cancer metastasis: mechanisms in cancer progression. Crit Rev Oncol Hematol. 2017;115:13–22.
- Liu Y. Mechanism of mir-221 targeting TRPS1 protein regulating biological behavior of non-small cell lung cancer [d]. Zhengzhou University; 2018. (Chinese).
- Witwicki RM, Ekram MB, Qiu X, et al. TRPS1 is a lineage-Specific transcriptional dependency in breast cancer. Cell Rep. 2018;25(5):1255–1267.e1255.
- Li L, Zhu Z, Zhao Y, et al. FN1, SPARC, and SERPINE1 are highly expressed and significantly related to a poor prognosis of gastric adenocarcinoma revealed by microarray and bioinformatics. Sci Rep. 2019;9(1):7827.
- Zhang H, Sun Z, Li Y, et al. MicroRNA-200c binding to FN1 suppresses the proliferation, migration and invasion of gastric cancer cells. Biomed Pharmacothe. 2017;88:285–292. (undefined).
- Han TS, Hur K, Xu G, et al. MicroRNA-29c mediates initiation of gastric carcinogenesis by directly targeting ITGB1. Gut. 2015;64(2):203–214.