
ABSTRACT
The precise control of the cell cycle G2 phase to Mitosis (M phase) transition is central for cell fate determination. The commonly used methods for assessing G2 to M phase progression are based on synchronizing cells and involve perturbation of the natural cell cycle progression. Additionally, these methods are often time-consuming and labor-intensive. Here, we report a flow cytometry-based method that offers a kinetic analysis of G2 to M phase progression in asynchronous cells using nocodazole, 5-Ethynyl-2´-deoxyuridine staining, and histone H3 serine 28 phosphorylation (pH3) staining. Nocodazole is used to collect mitotic cells and prevent their progression into G1, at the same time EdU is added for use as a dump channel during analysis. The remaining cells can then be identified as either G1 or G2/M based on their DNA content. Finally, G2 and M phase cells can be separated based on a mitotic marker, phosphorylation of ser28 on histone H3. While developed to assay G2/M phase progression, this method also resolves G1/S phase progression with no additional steps other than analysis. Compared to double thymidine block, this method does not require extended pre-treatments and is compatible with a greater variety of cell lines, while at the same time offering enhanced consistency and temporal resolution.
KEYWORDS:
Introduction
Current methods for measuring G2 to M phase progression rely on arresting the cell cycle in G1 or S phase to achieve a synchronized population. Synchronization is achieved by inducing cell cycle arrest in a phase prior to the phase of interest. Among the most common methods for synchronizing cells include: (i) removing serum in the culture media to remove growth factors causing G1 arrest; (ii) inhibiting DNA synthesis to cause early S phase arrest, whether through a high concentration of thymidine, treatment with hydroxyurea or other DNA synthesis poison; (iii) adding topoisomerase poisons to cause arrest in G2, or; (iv) adding microtubule poisons, such as nocodazole, to cause arrest in M phase [Citation1,Citation2,Citation3,Citation4,Citation5]. These methods are effective only in specific cell types, require significant amounts of time and cause ill-defined secondary effects. In particular, thymidine synchronization is the standard protocol for investigating G2 phase progression, but requires extensive pretreatment, knowledge of the timing of each cell cycle phase, and can be disrupted by treatments that cause arrest in phases other than the phase of interest.
Quastler and Sherman originally described a method of determining the length of G2 in unsynchronized cells. This method based on pulse labeling S-phase cells with tritiated thymidine and then assaying mitotic cells for tritium incorporation [Citation6,Citation7,Citation8]. Early samples show tritium negative cells, which were in G2 and M phase during the tritium pulse. Over time, tritium labeled cells complete S and G2 phases and enter mitosis. The length of G2 and ½ M phase can be calculated as the time from pulse labeling to time at which half of the mitotic population is tritium positive ()). Quastler and Sherman’s method has the advantage of dispensing with timely and restrictive synchronization procedures. Utilization of non-radioactive thymidine analogs, such as 5-bromo-2'-deoxyuridine (BrdU) and 5-Ethynyl-2´-deoxyuridine (EdU), precludes the need for working with radiolabeled thymidine. Our method uses Quastler and Sherman’s as a base with additional modifications that allows us to directly measure the progress of an asynchronous G2 population into mitosis, in a straightforward and timely manner ( and ). In brief, nocodazole is used to collect mitotic cells and prevent their progression into G1, at the same time EdU is added for use as a dump channel in flow cytometry analysis. The remaining cells can then be identified as either G1 or G2/M based on their DNA content. Finally, G2 and M phase cells can be separated based on a mitotic marker, phosphorylation of ser28 on histone H3 ( and ). While conceptually similar to Quastler and Sherman’s method, our more direct method offers some subtle advantages. A direct measurement makes it easier to convey the results of the assay and requires less time to perform ( and d)). Quastler and Sherman’s method requires multiple time points to accurately determine when mitotic cells are at 50% of peak label positivity; conversely, our method conveys substantial information with a few, or even a single time point. Additionally, by tracking the decrease in the G1 population, our method simultaneously resolves the rate at which cells are entering S phase.
Figure 1. (a) Overarching diagram of workflow. (b) A conceptual diagram shows how G2 and M phase cells can be isolated. EdU incorporation marks S phase cells for exclusion during analysis, while nocodazole prevents cells from leaving M phase. (c) Hypothetical data using our method. (d) Hypothetical data from Quastler and Sherman’s Labeled Mitosis methods
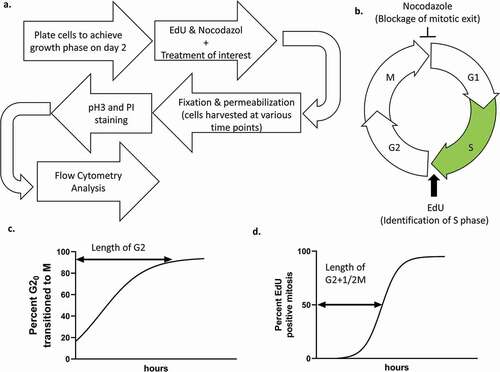
Figure 2. (a) diagram and run time of typical first-day work flow. (b) diagram and run time of second-day work flow. Step run times only include time spent centrifuging and incubating samples, not time spent manipulating samples. Total run time includes typical sample manipulation time
Figure 3. An outline of standard gating strategy when analyzing samples. Example data is typical for HeLa cells incubated with EdU and nocodazole for 8 hours. (a) In the first plot cells (E1) are gated on forward and side scatter to separate them from debris. (b) Next, singlets (E2) are identified based on the ratio of height and area for the DNA stain. G1 doublets may be present as having similar height but increased area compared to G2 singlets, with S and G2 doublets being proportional. Mitotic cells form a sub population with reduced signal area but similar height. (c) DNA content is plotted against EdU incorporation to resolve G1, S and G2/M (R3) phases. (d) Finally, p-Histone H3 (ser 28) is plotted against forward scatter to resolve mitotic cells (R4) and G2 cells (not gated)
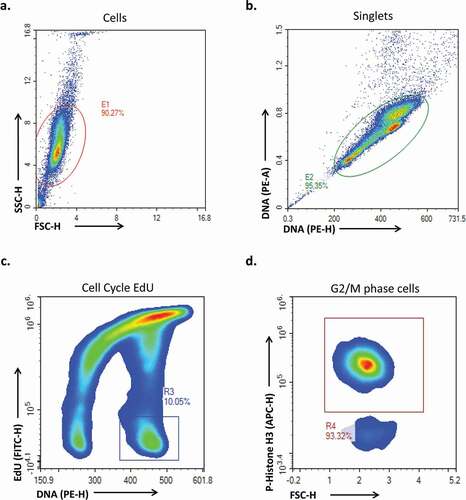
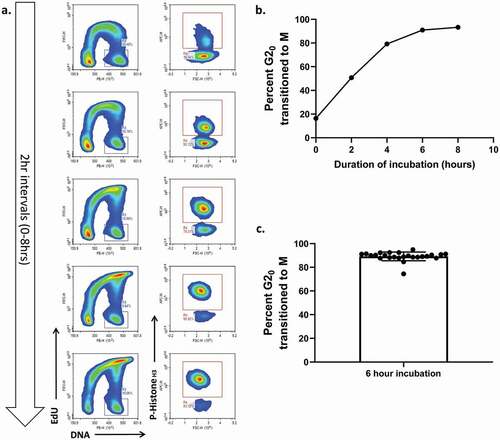
Figure 4. (a) representative flow plots at time points from 0 to 8 hours in HeLa cells under normal conditions. (b) A line plot of the same data showing the kinetics of G2 entry. (c) A plot of the percent of G2/M phase cells that have entered mitosis in the positive control sample across the 10 most recent experiments N = 25
When added to cells in culture, BrdU or EdU are incorporated into newly synthesized DNA and can later be fluorescently labeled with antibodies or a copper catalyzed covalent addition, respectively [Citation9–12]. Co-staining base analog incorporation and the DNA content of cells in an asynchronous population will generate three populations. (i) Cells with 2 N worth of DNA and negative for base analog incorporation are in G1 phase; (ii) Cells containing between 2 N and 4 N DNA and stain positive for base analog incorporation are in S phase; (iii) Cells with 4 N DNA and negative for base analog incorporation are in either G2 or M phase. Labeling an asynchronous population for a short time resolves the steady-state proportions of each population.
Incorporation of base analog is irreversible, as a result, any cells that take up base analog in S phase will retain it even as they progress into G2 phase. While incubating with the base analog, cells continue to progress through the cell cycle as normal. Over time, G2 cells progress through M phase and divide their DNA between daughter cells, G1 cells progress into S phase and begin to incorporate the base analog and S phase cells progress into G2 phase, but retain the base analog, and thus will appear the same as S phase cells when stained. Over extended incubations, the G2/M population diminishes while the S phase population accumulates, skewing analysis of phase proportions. In previous protocols, the time spent incubating with base analog is minimized and the resulting skew is minimal. Our protocol takes advantage of this to isolate the sub-population of cells that are in G2 and M phase at the time of base analog addition.
Our protocol uses EdU because of the more uniform results and the reduced time required for staining [Citation10,Citation11]. By adding EdU to the media at the beginning of the experiment, cells that are in G2 at time 0 can later be identified. Cells that progress from S phase to G2 during the experiment retain the EdU and can be excluded from further analysis. To prevent the G2/M phase cells from dividing over the course of the experiment, the microtubule poison nocodazole prevents the completion of mitosis [Citation1]. As a result, at time 0, the steady-state population of cells distributed across G2 (G20) and M (M0) phase becomes identifiable and will not reduce over time as a result of mitotic completion. Over the course of the protocol, the cells in G20 progress through the cell cycle at a minimally perturbed rate and enter M phase where they arrest. During analysis cells in the G2/M phase, population can be assigned to G2 phase or M phase based on staining for phosphorylation at ser 28 on histone H3. As cells enter mitosis phosphorylation of histone H3 on ser 28 facilitates chromatin condensation and acts as an easily identifiable, binary identifier for mitotic entry [Citation13,Citation14,Citation15].
This method allows us to simply and quickly compare the effects of various treatments on G2 progression with a robust and reproducible method. In addition, by taking samples at regular intervals our method resolves the kinetics of G2 progression through time. At the same time, progression from G1 phase into S phase can be assayed by checking samples for the fraction of cells that exit G1 in a given period of time. To further investigate samples, additional antibodies or dyes may be incorporated as equipment allows. There are several commercially available fluorescent azides in different colors, multiple DNA dyes with various fluorescent spectra, and antibodies against phospho ser 28 histone H3 with different fluorescent conjugates. The colors of each component may be adjusted to account for differences in available equipment and experimental design. The pH of the EdU reaction buffer can negatively affect fluorophores if surface staining is performed prior to EdU labeling, and ethanol fixation can allow nonmembrane bound antigens to escape, preventing later detection. When developing an experimental procedure including these steps, it may be necessary to consider alternative fixation and permeabilization methods. Since this method does not rely on cell line-specific responses, it is applicable to a wide variety of cell lines that would otherwise not be suitable for cell cycle investigations.
This protocol necessitates the use of a mitotic poison, and therefore may cause toxicity in specific cell lines. EdU staining requires that DNA synthesis is taking place, experimental treatments that completely inhibit DNA synthesis would prevent the identification of a static G2 population. Most importantly, this protocol relies on phosphorylation of ser 28 on histone H3 to identify chromatin condensation. If there is a sizable population of mitotic cells with condensed chromatin, they may be secondarily confirmed when comparing the height with either area or width of the DNA fluorescence. Mitotic cells fall into a disproportionately uniform population with reduced signal width compared to cells in G2. Some forms of DNA damage, such as exposure to UV-B radiation, can cause phosphorylation of histone H3 at ser 28 and confound identification of mitotic cells.
Materials
Reagents
Tris pH 8.5
Phosphate buffered saline (PBS)
Bovine serum albumin (BSA)
CuSO4 Sigma, Product no. 12,852
ascorbic acid Sigma, Product no. A4544
EdU Sigma, Product no. 900,584
Nocodazole Sigma, Product no. M1404
Azide in DMSO Thermo Fisher, Catalog no. A10266
Propidium Iodide Sigma, Product no. P4170
RNAse A Sigma, Product no. R4875
Alexa 647 conjugated anti-phospho ser 28 histone H3 Biolegend, Catalog no. 641,006
Recipes
EdU Click reaction buffer
Each component, except Tris, should only be added immediately before staining the samples. Components should be added in order from top to bottom, vortex briefly between each addition.
CuSO4 stock solution can be prepared beforehand stored at room temperature.
Ascorbic acid solution should be prepared fresh for each reaction.
Fluorescent Azide should be dissolved in DMSO and protected from excessive freeze-thaw cycles.
All other components are dissolved in DDiH2O
PI staining buffer
PI and RNAse stock solutions should be prepared in PBS.
RNAse stock solutions should be kept frozen at −20°C and should avoid excessive freeze-thaw cycles.
PI stock solutions should be kept at 4°C and protected from light.
Antibodies should be stored according to manufacturer instructions
Equipment
Round-bottom polypropylene tubes
Centrifuge with appropriate buckets and inserts
Flow cytometer able to detect PI, Alexa 488 and Alexa 647
Protocol
Day −1: Plate cells in an appropriate number of wells from a 12 well plate to be 60% to 80% confluent the following day (≤1 million cells). Plate one well for each replicate at each time point. Note 1: Be sure that each well contains the same number of cells by diluting trypsinized cells in media such that 1 ml of cell suspension contains the appropriate number of cells for each well. Add the 1 ml of cell suspension too each well first then add media on top if necessary. Once all wells have been plated shake the plate to ensure cells settle evenly across the surface of the well.
For multiple time points only: Time −1 h: Using growth media, make enough master mix, containing 10–30 µM 5-Ethynyl-2'-deoxyuridine (EdU), for each well. Incubate all wells for 30 minutes to 1 h. Note 2: This step will capture the steady-state percentage of cells in each stage of the cell cycle at the end of the incubation (at Time 0) to allow for comparisons between Time 0 and later time points.
Time 0 hr: Using media that will be the basis for your experimental conditions, such as conditional drop out media, make enough master mix, containing the same 10–30 µM EdU as well as 0.25 µg/mL nocodazole, for each well (Note 3). Remove the media from all wells and wash twice with PBS before adding the experimental media to each well. Note 3: Divide your master mix into a separate aliquot for each experimental treatment group and add any treatments necessary to the media. We recommend changing the media on one plate at a time if you have multiple. This will reduce the amount of time that cells spend out of the incubator or exposed to air without media.
If you have pretreated your cells to capture a time point at 0 hr, transfer all of the media from each well of this time point into a 5 ml polystyrene round-bottom tube. Without washing the well, add an excess of trypsin to each well. For one well of a 12 well dish we recommend 500 µL of trypsin (Note 4). Once cells are free from the plate, transfer the cell suspension to the round-bottom tube containing the corresponding media. Note 4: Cells treated with nocodazole can round up and detach from the plate as they enter mitosis, washing at this step would cause you to preferentially lose cells in mitosis, thus skewing the results. Using a large volume of trypsin helps to counteract residual FBS from the culture media and to reduce the number of cells that are caught in the meniscus when pipetting.
Centrifuge all sample tubes to pellet the cells, for many cells 300 g for 5 minutes is sufficient. Carefully dispose of the supernatant from each sample tube, making sure not to dislodge the cell pellet. Note 5: This step, and similar steps requiring that supernatant be discarded, can usually be accomplished by steadily inverting the tube and shaking gently to allow the supernatant to flow out of the tube freely. The supernatant that remains in the tube after inverting can be safely ignored without impairing subsequent steps. After a tube has been inverted once, the residual supernatant tends to dislodge the cell pellet as it runs back down the inner wall of the tube. For this reason, it is important that you do not invert a tube more than once without re-centrifuging. Doing so will likely result in a substantial fraction of the cell pellet being lost with the supernatant.
Using 500 µL of ice-cold 70% ethanol, carefully resuspend the cell pellet while vortexing the sample at a low speed, only just enough to mix the solution (Note 6). Then, store the sample at −20°C overnight to fix and permeabilize the cells (Note 7). PAUSE POINT Note 6: 70% ethanol can be prepared beforehand and stored at −20°C. The appropriate setting for your vortexer will vary by model, but a conical attachment will require a lower setting than a plate attachment. Note 7: When using ethanol to fix and permeabilize cells, samples should spend at least several hours being fixed at −20°C, but once fixed can be stably stored for at least 2 weeks at −20°C. Alternative methods can be used to fix and permeabilize the samples, such as fixation with 3.7% formaldehyde followed by permeabilization with triton x-100, but will typically result in larger CV values for flow cytometry. Since cells fixed with ethanol tend to lose cellular contents that are not organelle bound, such as free-floating fluorescent proteins, alternative fixation methods may be preferred when additional staining is necessary.
Repeat steps 4–6 for each time point.
Sample preparation for flow
Centrifuge samples at 300 g for 5 minutes. Discard supernatant while making sure not to disturb the cell pellet (Note 5).
Re-suspend the pellet in 500 µL of 0.5% BSA in PBS. Break up clumps of cells by pipetting up and down several times or vortexing at a low speed. Note 8: Cells fixed with ethanol can become permanently bound to the wall of the round-bottom tube. Including BSA in the wash step helps to prevent this, but when vortexing, care should be taken to minimize the area of the tube wall that the cell suspension is exposed to. Mixing substantial volumes of PBS and ethanol, such as making 70% ethanol by diluting 100% ethanol into PBS can exacerbate this issue.
Centrifuge samples at 300 g for 5 minutes. Discard supernatant while making sure not to disturb the cell pellet (Note 5).
CRITICAL STEP: Create a master mix of click reaction buffer immediately before staining the samples. Approximately 1 mL of reaction buffer contains:
679 µL of DDi H2O
100 µL of Tris pH 8.5 stock solution
20 µL of CuSO4 stock solution
200 µL Ascorbic acid fresh stock solution
2.5 µL fluorescent Azide stock solution
Vortex the mixture after adding each reagent and then add 500 µL of click reaction buffer to each sample. Mix gently by pipetting or vortexing and leave to stain at room temperature 30 min to 1 hr.
Centrifuge samples at 300 g for 5 minutes. Discard supernatant while making sure not to disturb the cell pellet (Note 5).
Repeat steps 9 and 10 two times.
CRITICAL STEP: Create a master mix of DNA and p-histone H3 stain.
Approximately 1 mL of reaction buffer contains:
1 mL of PBS
10 µL of RNAse A stock solution
40 µL of PI
12 µL of α-p-H3 Alexa 647 conjugated antibody
Vortex the mixture and add 330 µL of master mix to each sample. Mix gently by pipetting or vortexing and leave to stain at room temperature 30 min to 1 hr.
Run the samples through the flow cytometer using the following gating strategy to separate out EdU negative cells with 4 N DNA content (G2/M phase cells). Out of these cells, those that stain positive for p-histone H3 are mitotic and those that stain negative are in the G2 phase.
Troubleshooting
Disclosure statement
No potential conflict of interest was reported by the authors.
Additional information
Funding
References
- Jordan MA, Thrower D, Wilson L. Effects of vinblastine, podophyllotoxin and nocodazole on mitotic spindles. Implications for the role of microtubule dynamics in mitosis. J Cell Sci. 1992;102(3):401–416.
- Knehr M, Poppe M, Enulescu M, et al. A critical appraisal of synchronization methods applied to achieve maximal enrichment of HeLa cells in specific cell cycle phases. Exp Cell Res. 1995;217(2):546–553.
- Vasquez RJ, Howell B, Yvon AM, et al. Nanomolar concentrations of nocodazole alter microtubule dynamic instability in vivo and in vitro. Mol Biol Cell. 1997;8(6):973–985. .
- Bootsma D, Budke L, Vos O. Studies on synchronous division of tissue culture cells initiated by excess thymidine. Exp Cell Res. 1964;33(1):301–309.
- Campisi J, Morreo G, Pardee AB. Kinetics of G1 transit following brief starvation for serum factors. Exp Cell Res. 1984;152(2):459–466.
- Quastler H, Sherman FG. Cell population kinetics in the intestinal epithelium of the mouse. Exp Cell Res. 1959;17(3):420–438.
- Mitchison JM. The biology of the cell cycle. Vol. 313. Cambridge Eng.: University Press; 1971. p. 21–22.
- Prescott DM. Reproduction of eukaryotic cells. Vols. ix, 177. New York: Academic Press; 1976. p. 29–30.
- Gratzner H. Monoclonal antibody to 5-bromo- and 5-iododeoxyuridine: A new reagent for detection of DNA replication. Science. 1982;218(4571):474–475.
- Salic A, Mitchison TJ. A chemical method for fast and sensitive detection of DNA synthesis in vivo. Proc Nat Acad Sci. 2008;105(7):2415–2420.
- Cecchini MJ, Amiri M, Dick FA. Analysis of cell cycle position in mammalian cells. J Vis Exp. 2012;(59):e3491. doi:10.3791/3491(2012).
- Ormerod MG, Kubbies M. Cell cycle analysis of asynchronous cell populations by flow cytometry using bromodeoxyuridine label and Hoechst-propidium iodide stain. Cytometry. 1992;13(7):678–685.
- Crosio C, Fimia GM, Loury R, et al. Mitotic phosphorylation of histone H3: spatio-temporal regulation by mammalian aurora kinases. Mol Cell Biol. 2002;22(3):874–885.
- Goto H, Tomono Y, Ajiro K, et al. Identification of a novel phosphorylation site on histone H3 coupled with mitotic chromosome condensation. J Biol Chem. 1999;274(36):25543–25549. .
- GURLEY LR, D’ANNA JA, BARHAM SS, et al. Histone phosphorylation and chromatin structure during mitosis in chinese hamster cells. Eur J Biochem. 1978;84(1):1–15.