
ABSTRACT
Unusually high aneuploidy is a hallmark of epithelial serous ovarian cancer (SOC). Previous analyses have focused on aneuploidy on average across all tumor cells. With the expansion of single-cell sequencing technologies, however, an analysis of copy number heterogeneity cell-to-cell is now technically feasible. Here, we describe an analysis of single-cell RNA sequencing (scRNA-seq) data to infer arm-level aneuploidy in individual serous ovarian cancer cells. By first clustering high-quality sequenced epithelial versus non-epithelial cells, high-confidence tumor cell populations were identified. InferCNV was used to predict segmented copy-number alterations (CNAs), which were then used to determine arm-level aneuploidy at the single-cell level. Control comparisons of normal cells to normal cells showed zero arm-level aneuploidy, whereas a median of four aneuploid events were detectable in cancer cells. A heterogeneity analysis of high-grade tumor cells compared to low-grade tumor cells showed similar levels of cell-to-cell variation between cancer grades. Metastatic tumors potentially showed selection pressure with reduced cell-to-cell variation compared to cells from primary tumors. Minor cell populations with CNAs similar to metastatic cells were identified within the matched primary tumors. Taken together, these results provide a minimum estimate for single-cell aneuploidy in serous ovarian cancer and demonstrate the utility of single-cell sequencing for CNA analysis.
Introduction
Aneuploidy affects the balance of tumor suppressors and oncogenes [Citation1]. Aneuploid events are a defining genetic cancer lesion: 88% of cancers (primarily solid tumors) exhibit aneuploidy [Citation2]. An accepted definition of aneuploidy which is adhered to here is modification of a chromosome arm, not the entire chromosome [Citation3]. Copy-number alterations (CNAs) include these aneuploidy events as well as focal changes resulting from local deletion or amplification. Tumor CNAs are ten-fold more frequent than loss of heterozygosity events, since CNAs rarely overlap coding mutations [Citation4]. Tumors often select for loss of an arm on a single chromosome and a gain of the opposing arm. Chromosome 8p, for example, is often lost in SOC while chromosome 8q is often gained [Citation4,Citation5]. Modulation of a single chromosome arm can influence biological characteristics, including response to drugs. TALEN-mediated removal of chromosome 8p in nonmalignant MCF10A cells incurred resistance to microtubule-disrupting chemotherapeutics [Citation6], which is consistent with breast cancer patient data [Citation7,Citation8]. In some cases, the phenotypes resulting from aneuploidy can be attributed to single genes. Suppression of the autophagy genes BECN1 or MAP1LC3B, which are encoded on regions of common aneuploid losses, is able to sensitize ovarian cancer cells to autophagy-disrupting drugs chloroquine and nelfinavir [Citation9].
High-grade SOC is one of the most aneuploid cancer types, and may have as many as two-thirds of genes altered by copy-number alterations within the primary tumor [Citation5]. In ovarian cancer, CNAs can influence tumor biology and drug response. Subgroups of 72 high-grade serous ovarian cancers were analyzed by hierarchical clustering of CNAs and a significant difference in prognosis was observed [Citation10]. Taxanes are used for initial chemotherapy treatment of SOC in part because they are efficacious in aneuploid tumor cells [Citation11]. We previously found autophagy to be one of the most suppressed pathways in high-grade SOC. Interestingly, loss of autophagy genes leads to aneuploidy in SOC and other models. Unbiased chemical screens have found that autophagy drugs are selective for aneuploid cells [Citation12], suggesting autophagy drugs can exploit a CNA-driven therapeutic window. Further exacerbating aneuploidy in SOC is the near-universal mutation of TP53 in high-grade tumors. Loss of p53 function is significantly associated with aneuploidy (more than 100 log10 P-value units beyond any other gene) [Citation2], due to a loss of programmed cell death in response to aneuploidy. In endometrial cancer, p53 mutant tumors with higher aneuploidy have worse prognosis [Citation13,Citation14]. Because of intra-tumor heterogeneity, however, high aneuploidy does not necessarily mean high CNA heterogeneity among tumor cells in the same patient. Single-cell analysis is required to address this point.
Single-cell analysis can be used to directly assess genetic and biological variation within a tumor or within a patient. Previous estimates of variation in SOC have focused on RNA, cell lines, and technical validation [Citation15], or direct labeling of chromosomes in quantitative microscopy [Citation16,Citation17]. Chromosome instability (CIN) was shown to increase with disease progression and drug resistance in epithelial ovarian cancer, although immediately after drug treatment CIN levels temporarily decreased. The dynamic range of genomic instability relates to current treatment advances in PARP inhibitors; tumors which have defects in homologous recombination respond better to PARP inhibitor maintenance therapy [Citation18–21]. BRCA reversion events are one clear mechanism of PARP inhibitor resistance [Citation22]. Clonality assessments of CNAs may inform the design of new treatment regimens which evade this simple resistance mechanism.
Here, we investigate CNAs present across the whole genome in single ovarian cancer cells. Starting with scRNA-seq data, aneuploidy, whole-genome duplication, and sub-chromosomal CNAs were cataloged at the single-cell level. Heterogeneity estimates were made to determine if CNAs contribute to spontaneous genetic evolution at measurable and significant rates.
Materials and methods
Source data and samples
Here, we used the samples from different cell populations within ovarian cancer that were previously investigated using single-cell RNA-seq [Citation23]. All samples analyzed used the same naming convention – specifically “HG” and “LG” for High Grade and Low Grade, respectively, and “P” for primary and “M” for metastasis – and are listed in . Demultiplexed sample data were aligned to the hg19 human reference genome and gene expression was quantified. The unique molecular identifier (UMI) count matrix from the Gene Expression Omnibus (GEO series GSE118828) was used in our analysis, with genes as columns and cell barcodes as rows. Samples with insufficient epithelial cells for our analyses were not used. For all “normal” comparisons shown in the current study’s figures, the InferCNV CNA prediction comparing HG3P normal cells to HG1P normal cells was used.
Table 1. Description of samples and basic pre-processed data summary
Bulk genome data from The Cancer Genome Atlas (TCGA) were downloaded from the 2011 publication files [Citation5], specifically microarray RNA and CNA data. Bulk genomic data from the International Cancer Genome Consortium (ICGC) were downloaded from the ICGC Data Portal, using data from the Australian Ovarian Cancer study group [Citation22].
Data preprocessing
It was shown in the previous scRNA-seq study that each subject sample had different cell types that were clustered into epithelial and non-epithelial cells [Citation23]. To identify the CNVs in the tumor samples, we first needed to find the cluster of epithelial cells and non-epithelial cells in each sample. We used Seurat, an R package designed for exploration of single-cell RNA-seq data for clustering the different cell types [Citation24,Citation25]. As a first step a Seurat object was created with the count matrix, then genes were filtered on expression in at least three cells, and each cell needed to have at least 200 genes. After removing unwanted cells from the dataset, we then log-normalized the entire dataset. The highly variable genes were identified, and a principle component analysis of the most variable genes was performed. An elbow plot was used to select the principle components (PCs) capturing the most variance in the dataset. These PCs were used as edge weights in an unsupervised, graph-based clustering to identify the cell clusters. T-distributed stochastic neighbor embedding (tSNE) was used for visualization of the cell clusters. Expression levels of cell-type-specific markers were used to determine the putative identities of each cell cluster.
Copy number alteration prediction
InferCNV was used to predict the CNAs from scRNA-seq data (InferCNV of the Trinity CTAT Project: https://github.com/broadinstitute/InferCNV). InferCNV is the only currently available method that explores the expression intensity of genes across positions of tumor genomes in comparison to a set of reference “normal” cells to determine somatic changes [Citation26]. This method is therefore an ideal tool to explore tumor scRNA-seq data to identify large-scale chromosomal CNAs. We used InferCNV to predict CNAs using the following settings: cutoff = 0.1 (This value was found to generally work well with 10X Genomics and 3ʹ-end sequencing and droplet assays), HMM_type = ‘i6ʹ (Hidden Markov Model HMM-based CNA prediction) and HMM_report_by = c(“cell”) (which instructs InferCNV to report per-cell level CNAs). As a result of this method a heatmap was generated illustrating the relative expression intensities across each chromosome. This result shows which regions of the tumor genome are over-abundant or less-abundant as compared to that of normal cells. As we have used HMM-based CNA prediction, this method also provides a summary containing the CNA region coordinates, state assignments, and cell groupings. The candidate region CNAs were predicted with any of 6 CNA levels: 1–complete loss, 2–loss of one copy, 3–neutral, 4–addition of one copy, 5–addition of two copies, and 6–addition of more than two copies.
Ploidy correction and arm-level aneuploidy detection
Polyploid tumors were identified using copy-number states of cell populations within the epithelial cells. A sliding window approach was used centering around zero ± 1 ploidy level, since the majority of alterations are monoallelic. All CNAs were summed for each cell, creating a fractional ploidy state for each possible level of ploidy. Cellular ploidy fractions were then calculated per cell as in ). The center of a 0 ± 1 ploidy state was predicted to be the ploidy state of the tumor, based on whole sample ploidy sums. Ploidy states were then similarly re-calculated at the single-cell level, so that a single whole-genome addition or reduction would not result in inappropriately excessive CNAs. CNAs were then adjusted to this re-centered ploidy state, per cell.
We then determined single-cell CNAs relative to the cellular ploidy state. Chromosome-arm level aneuploidy was calculated by concatenating aneuploidy events on each arm. We identified specific chromosome-arms that exhibited events present in 50% of the arm using a custom R script. Location of the aneuploidies in the chromosomal arms were obtained by using centromeres and gene coordinates information from UCSC Table Browser using hg19, wherein the “ends” were the first and last genes on each arm (Supplemental Table 6). To compare to TCGA and ICGC datasets, identical calculations were performed on source data.
CNA heterogeneity
For heterogeneity calculations, copy-number alterations identified in epithelial cells in each sample were first corrected for cell ploidy, as described above. A reduced segment method [Citation27] was used to enable comparisons across cells from different samples. Similar to our previous report [Citation28], a Euclidean distance calculation was performed as a heterogeneity estimate arising from CNAs. This method is analogous to the height of tree branches formed in hierarchical clustering. Groups of 10 randomly picked epithelial cells per sample were used to estimate cell-to-cell variation per tumor. FairSubset was used to fairly equalize sample size between patients (N = 150 cells per tumor) [Citation29]. A custom R script was used for these calculations. For t-SNE plots, the Rtsne package was used, using arm-level CNA calls per cell as input data.
Statistics
For standard comparisons, a two-tailed student’s t-test was performed to generate a P-value, unless otherwise described. Boxplot whiskers represent 5% and 95% cutoffs.
Results
Epithelial cell identification in scRNA-seq data
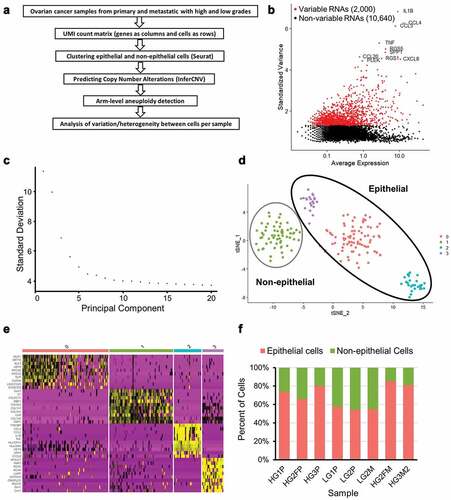
Ovarian cancer is epithelial in origin. To determine copy number alteration (CNA) events at the single-cell level, a determination of epithelial cells was first required. Single-cell RNA-sequencing (scRNA-seq) data from two low-grade (“LG” tumors) serous ovarian cancer patients and three high-grade (“HG” tumors) serous ovarian cancer patients were used, as previously described [Citation23]. Samples included ovarian and fallopian primary (“P”) tumors as well as metastatic (“M”) tumors (). ) depicts the conceptual steps of the workflow for this study. First, low quality sequenced cells were filtered out and the remaining cells normalized using Seurat (see Methods). A subset of genes that exhibit high cell-to-cell variation in the dataset was identified per sample. The top 10 variable genes were identified, with an example as shown in ). LG1P primary tumor cells showed elevated mRNA of CXCL8 and TNF. SST and RGS1 were highly expressed in HG3P tumor cells. After scaling the data, a linear dimensional reduction was performed on each sample. As an example, the majority of variance was captured in the first 15 principle components (PCs) for the sample LG1P, with an elbow around 5 PCs ()). In order to cluster similar cells together in low-dimensional space and visualize the cell clusters, t-Distributed Stochastic Neighbor Embedding (t-SNE) was used ()). The cell clusters are defined by the top 10 highest expressed markers per cluster derived by differential expression showed a high degree of cluster-specificity (), also see Supplementary Table 1). An upregulation of collagen genes including COL1A1, COL1A2, COL5A1, and COL6A3 was observed in non-epithelial clusters. Epithelial cell clusters exhibited dozens of differentially expressed genes, with the highest differential expression found in WFDC2, KRT8, SPP1, CXCL8, and RGS16. A total of 1,720 cells from 8 samples were clustered into epithelial (N = 1,231) and non-epithelial (N = 489) cells. The clustered epithelial cells range from 69 to 225 and non-epithelial cells range from 38 to 89 as shown in . Epithelial cancer cells were used for the remainder of this study, with the exception of “normal” control non-epithelial cells used for untransformed cell comparisons.
Figure 1. Preparation of ovarian cancer scRNA-seq data for CNA analysis. (a) Overview of scRNA-seq to CNA analysis. (b) Highly variable genes in LG1P (top 10 variable genes are labeled). (c) Elbow plot of LG1P principal components. (d) Identified cell clusters in LG1P using t-SNE clustering of scRNA-seq data (e) Top 10 markers that define each cell cluster in LG1P. Non-epithelial cell cluster (green) shows the upregulation of collagen genes (COL1A1, COL1A2, COL5A1, COL6A3). Column color labels match the clustered cell colors in panel D. (f) Proportion of epithelial and non-epithelial cells in each sample
Identification of copy number alterations
Using epithelial and non-epithelial cell clusters we identified CNAs for each sample by InferCNV. An InferCNV clustered heatmap was created per sample, which corresponds to the normalized expression values of normal cells plotted in the top panel and tumor epithelial cells in the bottom panel ()). Gene CNAs were determined by finding location-coordinated expression differences along each chromosome, relative to normal control cells. In the resultant CNA heatmap, the regions of gain are depicted in red and regions of loss in blue.
Figure 2. Copy-number alterations in epithelial cancer cells exceed normal control cells. (a) Heatmap illustrating the relative expression intensities across each chromosome from HG3P. Region-normalized expression values for non-epithelial cells are plotted in the top heatmap and the epithelial cells are plotted in the lower heatmap, with genes ordered from left to right across the chromosomes. The non-epithelial cell expression data is effectively subtracted from the epithelial cells to yield differences. Red blocks indicate chromosomal region amplification and blue blocks show chromosomal deletions. Expression differences across chromosomal segments were used to predict CNA regions. (b) Enlarged image of chr8 which highlights deletion in chr8p and amplification in chr8q. (c) Predicted CNAs from scRNA-seq data were summed across chromosome arms to derive what percentage of each arm was lost (blue) or gained (red). An example from HG3P is shown. (d) Comparison of normal, non-epithelial cells from sample HG3P to normal, non-epithelial cells from sample HG1P, by CNA prediction using methods identical to panel C
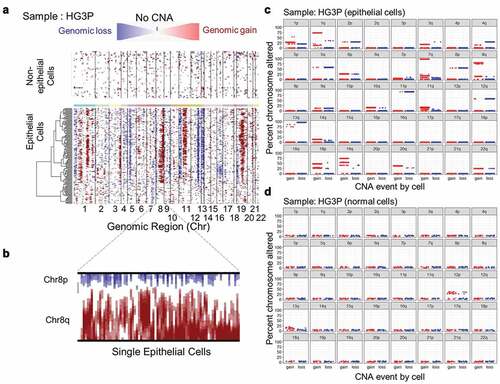
The analysis immediately revealed features that improve on other single-cell methods. Chromosome fluorescence in-situ hybridization (FISH) studies have used centromere painting to ascertain whole chromosome gains and losses [Citation16]. A problem with centromeric FISH analysis is that individual chromosome arms may be gained or lost on the same chromosome [Citation1,Citation9,Citation14,Citation30,Citation31]. A common antagonistically altered chromosome in ovarian cancer is chromosome 8 [Citation5]. Metabolic genes involved in repression of mevalonate synthesis are commonly deleted on chromosome 8p, as is ASAH1, acid ceramidase. Well-controlled TALEN-induced 8p loss experiments showed the predicted metabolic changes from deletions of these genes in addition to an enhanced invasion capability [Citation6]. 8p loss also sensitized cells to therapies targeting autophagy, which we have previously shown to be highly efficacious and safe for combination therapies in gynecologic cancers [Citation9,Citation32,Citation33]. Chromosome 8q, on the other hand, is the most frequent gain CNA in SOC. This is likely driven by the presence of the potent ovarian oncogenes MYC and PTK2 on 8q [Citation28,Citation34–36]. There was clear evidence of the coincident 8p loss and 8q gain in single cells using InferCNV on scRNA-seq data ()). FISH studies are limited to the individual chromosomes probed. In contrast, using InferCNV analysis of RNA-seq data, sub-chromosomal CNAs could be determined for every chromosome in every sample (Supplementary Table 2). Aneuploidy, especially in the oncology context, is defined by arm-level chromosome alterations [Citation3]. Based on an initial analysis of CNAs found in tumor cells ()) and normal cells ()), a cutoff of 50% of a chromosome arm was determined as optimal for specifically calling aneuploidy in tumor cells.
Whole-genome duplication and loss events
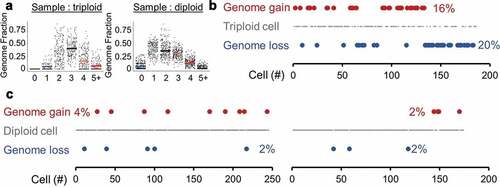
Triploidy and tetraploidy are common in solid tumors, including SOC [Citation37]. To ensure the CNA calls of InferCNV truly represent CNAs rather than spontaneous genome gains or losses, ploidy was estimated for each whole-tumor sample. Since most CNAs in cancer are monoallelic, this was determined by determining the peak ploidy state, which includes ± 1 copy level. This method clearly identified triploid tumors: HG1P and HG2FM ()). As further confirmation that diploid cells in a triploid tumor are not normal cell contaminants, CNA, and aneuploidy levels were confirmed to be present (Supplementary Figure 1). All other studied tumors were diploid in their average state. The same approach to identify ploidy was then applied to each individual cell within a sample. Interestingly, the triploid high-grade primary tumor exhibited high rates of spontaneous genome loss (20% of cells) or gain (16% of cells) ()). Diploid high-grade primary tumors exhibited an order of magnitude lower rate of spontaneous ploidy change at 2–4% of cells ()). However, even this small subpopulation of cells contributes to tumor heterogeneity and may underlie long-term drug resistance.
Figure 3. Spontaneous ploidy alterations. (a) Tumors were thresholded for average ploidy by finding where InferCNV states were centered, using a sliding window of fractional genome states. An example of a triploid genome (left, HG1P) and diploid genome (right, HG2FP) are shown. Geometric means of each ploidy fraction are overlaid over single-cell data. (b) A triploid high-grade serous ovarian tumor (HG1P) with estimations of diploid and tetraploid cells. (c) Diploid high-grade serous ovarian tumors with estimations of haploid and triploid cells. Left: HG2FP, right: HG3P
Aneuploidy and CNA estimates per SOC cell
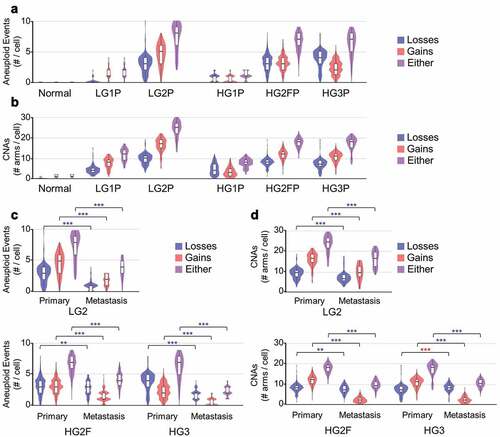
Aneuploidy and CNA estimates of SOC in whole-tumor samples range from 20% to 80% of the human genome [Citation5,Citation22]. Normalized, ploidy-corrected data were next used to ascertain CNAs. By a conservative definition of 50% of a chromosome altered in the same direction from normal, aneuploidy in SOC ranged from 1 to 4 events per cell in minimally altered tumors (HG1P and LG1P) to up to 5–9 aneuploidy events in highly altered tumor samples (LG2P, HG2FP, HG3P; )). Smaller CNA events were similar in number, comprising 7–30 chromosome arms altered by CNAs per cell ()). Interestingly, low-grade SOC cells did not differ in CNA or aneuploidy frequency relative to high-grade tumors. However, all grades and all tumors contained higher aneuploidy (P < 0.001) and CNAs (P < 0.001) than normal cells, as expected.
Figure 4. Aneuploidy and CNA estimates per cell. (a) Violin and boxplots of number of aneuploid events from all primary tumor samples studied, wherein aneuploidy is defined as arm-level alterations covering > 50% of the coding region of a chromosome arm (ANOVA, all post hoc to normal P < 2.2e-16) (b) Copy number alterations (CNAs) detected within each primary tumor chromosome arm are summed across the genome. (c) Tumor-metastasis pairs are compared for detectable aneuploidy rates per cell. (d) Tumor-metastasis pairs are compared for detectable CNA rates per cell. Blue ** P < 0.01 and *** P < 0.001 with a reduction in metastasis, red *** P < 0.001 with an increase in metastasis
These called aneuploidy frequencies are almost certainly underestimated. Low gene expression and high variability on chromosome 17 (which is frequently lost due to the presence of p53 and other tumor suppressors) precluded the discovery of chr17 loss in most cells. As further evidence of an underestimation, arm-level CNAs and aneuploidy calls were performed on The Cancer Genome Atlas (TCGA) high-grade serous ovarian cancer somatic copy-number alteration (SCNA) data [Citation5] and International Cancer Genome Consortium high-grade serous ovarian cancer SCNA data [Citation22]. The bulk sequencing-based cohort, ICGC, had less aneuploidy calls than the InferCNV data (Supplementary Figure 2a), but higher sub-aneuploidy CNA calls (Supplementary Figure 2b). The array-based cohort (TCGA) identified higher arm-level aneuploidy and higher CNAs than the InferCNV method.
Studies have shown metastatic niches select for particular clones, ultimately decreasing overall alterations at each metastatic site [Citation38]. Yet metastatic tumors can be more difficult to treat than primary tumors, suggesting their ability to adapt is increased. To address these possibilities in the context of CNAs, metastatic samples from patients with a matched primary tumor were compared. From the three tumor pairs compared, increased aneuploidy was never observed ()), and decreased CNAs were found in 8 of 9 comparisons ()). Some caution should be warranted, however, that increased RNA variation would decrease the power to determine aneuploid events.
CNA cell-to-cell heterogeneity
Low-grade tumors have a better 5-year survival prognosis than high-grade tumors, with overall survival surpassing 50% even for stage III and IV tumors [Citation39]. Given that CNA burden can confer a worse prognosis in other solid tumors [Citation40], we investigated CNA heterogeneity in these high- and low-grade serous ovarian tumors. CNAs for groups of 10 cells were compared using a Euclidean distance metric, which is analogous to the height of hierarchical clustering trees. This heterogeneity metric showed elevated heterogeneity in all primary tumors relative to normal cells (all P < 0.001) ()). However, low-grade cell-to-cell CNA heterogeneity was comparable to high-grade heterogeneity, with patient-to-patient differences exceeding grade differences.
Figure 5. Cell to cell CNA heterogeneity. Groups of 10 cells were compared for CNA heterogeneity for all samples. A Euclidean distance metric was determined for each set of 10 cells and represents Y-axis quantitation. (a) Primary tumor epithelial ovarian cancer cells exhibited 3–6 fold more heterogeneity than normal cells. (b) FairSubset groups from the BECN1± tumor (HG2FP) are compared to equally sized cell groups of all other tumors, for CNA heterogeneity. (c) LG2P was compared to LG2M for CNA heterogeneity. (d) Metastatic tumor cells for HG2 (left) and HG3 (right) were compared for CNA heterogeneity with primary tumor cells. ***P < 0.001 by Wilcoxon rank sum test
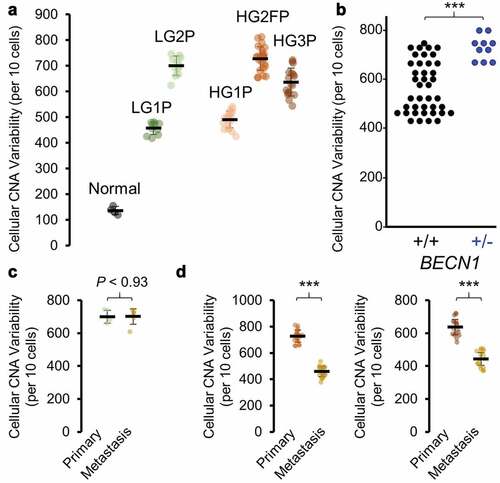
We recently published that heterozygous loss of the autophagy gene BECN1 is able to increase anaphase bridge formation, genomic instability as defined by increased CNAs, and tumor formation in ovarian cancer models [Citation28]. While scRNA-seq data only captured any expression of BECN1 in <20% of cells, the CNA analysis was able to highlight HG2FP as a tumor containing a loss in BECN1 (Supplementary Table 2). We note that this tumor had the greatest level of cell-to-cell CNA variability of any tumor tested. Using FairSubset to fairly equalize sample size between patients [Citation29], HG2FP heterogeneity remained higher than all other primary tumors combined, complementing our previous Becn1 studies (), P< 4.1E-05 by Wilcoxon rank-sum test). Broad interpretation should be cautioned, however, since only a single primary tumor exhibited a detectable BECN1 loss. RNA and protein of BECN1 is observed at equivalent levels in cell lines with loss or no loss of BECN1 [Citation41], and expression of BECN1 in TCGA high-grade serous ovarian cancer does not correlate with lower levels of aneuploidy or SCNAs (Supplementary Figure 3). It remains a challenge to directly analyze the role of BECN1 in human cancer’s genomic instability, since euploid dosage may be only physiologically relevant during a small sliver of the cell cycle during kinetochore and centrosome assembly [Citation42,Citation43].
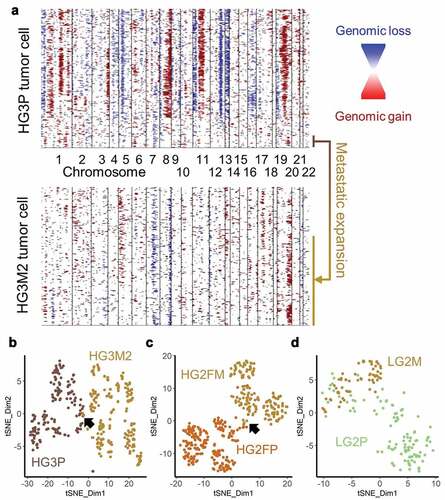
Metastatic tumors are often thought to be “more aggressive” and may therefore contain more inherent heterogeneity. From the three patients compared, increased heterogeneity was never observed. Equivalent heterogeneity was observed once in the low-grade tumor pair ()) and reduced heterogeneity were observed in the high-grade tumor pairs ()). Upon comparing CNAs from the metastatic sample of patient HG3 to the primary tumor, it appears unlikely the metastatic tumor arose from the predominant clone of the primary tumor. To address the possibility that the metastatic tumor arose from a sub-clone of the observed primary tumor, clustering analyses were performed. Hierarchical clustering of InferCNV data of HG3 primary tumor data revealed a small cluster of cells with characteristics of the metastatic cells. A unique signature of Chr19q gain, Chr7q loss, and variable CNAs on Chr1p were found in metastatic cells as well as this small population of cells in the primary tumor ()). Clustering by t-distributed stochastic neighbor embedding (t-SNE) confirmed a small overlap between high-grade primary and metastatic tumor pairs (). The low-grade pair exhibited more overlap ()). Primary and metastatic tumors alike were multi-clonal using InverCNV aneuploidy data, as indicated by multiple t-SNE clusters, indicating further evolution after metastatic seeding. These data support the hypothesis that single-cell sequencing can yield important information at diagnosis regarding sub-clones with potential metastatic capability.
Figure 6. Cells with metastatic CNAs identified in primary tumor. (a) InferCNV plots of HG3 primary (upper plot) and metastatic (lower plot) tumors, with a shared population highlighted (b) HG3P (light brown) were clustered by t-SNE with HG3M2 (gold). Arrow indicates a small overlap. (c) HG2FP (brown) were clustered by t-SNE with HG2FM (gold). Arrow indicates a small overlap. (d) LG2P (green) CNAs were clustered by t-SNE with LG2M (gold)
Discussion
Recent whole-genome sequencing pan-cancer studies report 4–5 driver mutations present in solid tumors [Citation44], consistent with previous pan-cancer analyses [Citation45]. However, these estimates do not include “moderate” or “modest” tumor suppressors and oncogenes, which can cumulatively affect tumor progression [Citation1,Citation46]. Ignoring these drivers is akin to ignoring the variation present in the normal human population; heterozygous changes drive the majority of human-to-human differences. Here, we show that scRNA-seq data can be utilized to determine copy-number changes in SOC across the genome at the single-cell level. We find 4.3 ± 2.8 detectable aneuploidy events per SOC genome. Single-cell variation measures discovered at least 4% of cells randomly gain or lose an entire genome. Heterogeneity between cancer cells in CNA patterns was many fold higher than the noise found in normal-normal comparisons, but surprisingly did not differentiate high-grade and low-grade tumors. Metastatic tumors did not exhibit more variation than primary tumors, and two of three tumors actually exhibited reduced CNA variation.
Multiple technologies exist to ascertain CNAs in tumor samples. While scRNA-seq is a growing field, the method has limitations. One is that the number of patients is much smaller than other studies, only five patients were analyzed here, and may or may not be representative of SOC as a whole. The sorting process to isolate cells may preclude an analysis of polyploid giant cancer cells, which are present in SOC and other solid tumors [Citation47,Citation48] and may contribute to CNA heterogeneity. While the breadth of detectable CNAs improves upon the chromosome-specific limitations of centromeric FISH studies, the resolution is not yet sufficient to determine focal changes of single genes, such as CDKN2A deletions known to drive some tumors [Citation4]. This resolution will only increase as the technology matures. Array technologies used to determine CNAs have been used for decades, yet arrays remain limited by platform-to-platform CNA call differences. The differences on arrays can be substantial, ranging from four CNAs to 489 CNAs when measuring an identical sample [Citation49]. FISH studies can over-report aneuploidy [Citation17], whereas our study and others indicate single-cell sequencing methods likely under-report aneuploidy.
Despite the limitations, there are many strengths of utilizing scRNA-seq data for CNA analysis. Aneuploidy is the strongest driver of RNA expression changes in a pan-cancer analysis [Citation50]. RNA levels translate to protein changes in the majority of genes, specifically in SOC [Citation51]. Since InferCNV utilizes information from many genes across chromosome regions, the method described here can provide copy number estimates for individual genes with low levels of expression, which the scRNA-seq sample barcoding and analysis pipeline itself cannot yet detect. There does not appear to be a universal limitation in detecting CNAs by scRNA-seq analysis. The CNA rates detected here are on the same order or magnitude as whole-genome sequencing and array platforms [Citation49]. Unlike centromeric FISH, the p- and q-arm can be independently tested on each chromosome, which is important for chromosomes like chr8.
The main novelty in this CNA analysis is the discovery and quantitation of heterogeneity between cells. The observation that 4% of high-grade SOC tumor cells have randomly gained or lost a copy of the genome is concerning. Ploidy provides a difference in cellular biology which is independent of other signaling events and tumor stemness [Citation52,Citation53]. This aneuploid variation was not limited to the whole-genome scale; every tumor sample contained some cancer cells which had spontaneously lost or gained an allele of the otherwise predominantly altered chromosome arm. Thus, if a drug only targets the predominant cell population as determined by bulk sequencing methods, there likely already exist cells that are resistant to the drug. One implication of our analysis is that combination therapies will be needed for SOC, which contains very few 100% penetrant driver mutations.
Supplemental Material
Download Zip (2.3 MB)Disclosure statement
No potential conflict of interest was reported by the authors.
Supplementary material
Supplemental data for this article can be accessed here.
Additional information
Funding
Related Research Data
References
- Davoli T, Xu AW, Mengwasser KE, et al. Cumulative haploinsufficiency and triplosensitivity drive aneuploidy patterns and shape the cancer genome. Cell. 2013;155:948–962.
- Taylor AM, Shih J, Ha G, et al. Genomic and functional approaches to understanding cancer aneuploidy. Cancer Cell. 2018;33:676–89 e3.
- Ben-David U, Amon A. Context is everything: aneuploidy in cancer. Nat Rev Genet. 2019;21(1):44–62.
- Tschaharganeh DF, Bosbach B, Lowe SW. Coordinated tumor suppression by chromosome 8p. Cancer Cell. 2016;29:617–619.
- Cancer Genome Atlas Research N. Integrated genomic analyses of ovarian carcinoma. Nature. 2011;474:609–615.
- Cai Y, Crowther J, Pastor T, et al. Loss of chromosome 8p governs tumor progression and drug response by altering lipid metabolism. Cancer Cell. 2016;29:751–766.
- Lebok P, Mittenzwei A, Kluth M, et al. 8p deletion is strongly linked to poor prognosis in breast cancer. Cancer Biol Ther. 2015;16:1080–1087.
- Yang W, Soares J, Greninger P, et al. Genomics of Drug Sensitivity in Cancer (GDSC): a resource for therapeutic biomarker discovery in cancer cells. Nucleic Acids Res. 2013;41:D955–61.
- Delaney JR, Patel CB, Willis KM, et al. Haploinsufficiency networks identify targetable patterns of allelic deficiency in low mutation ovarian cancer. Nat Commun. 2017;8:14423.
- Engler DA, Gupta S, Growdon WB, et al. Genome wide DNA copy number analysis of serous type ovarian carcinomas identifies genetic markers predictive of clinical outcome. PLoS One. 2012;7:e30996.
- Kawakami M, Liu X, Dmitrovsky E. New Cell Cycle Inhibitors Target Aneuploidy in Cancer Therapy. Annu Rev Pharmacol Toxicol. 2019;59:361–377.
- Tang YC, Williams BR, Siegel JJ, et al. Identification of aneuploidy-selective antiproliferation compounds. Cell. 2011;144:499–512.
- Kandoth C, Schultz N, Cherniack AD; Cancer Genome Atlas Research N. Integrated genomic characterization of endometrial carcinoma. Nature. 2013;497:67–73.
- Delaney JR, Stupack DG. Whole genome pathway analysis identifies an association of cadmium response gene loss with copy number variation in mutant p53 bearing uterine endometrial carcinomas. PLoS One. 2016;11:e0159114.
- Campbell KR, Steif A, Laks E, et al. clonealign: statistical integration of independent single-cell RNA and DNA sequencing data from human cancers. Genome Biol. 2019;20:54.
- Penner-Goeke S, Lichtensztejn Z, Neufeld M, et al. The temporal dynamics of chromosome instability in ovarian cancer cell lines and primary patient samples. PLoS Genet. 2017;13:e1006707.
- Andriani GA, Maggi E, Pique D, et al. A direct comparison of interphase FISH versus low-coverage single cell sequencing to detect aneuploidy reveals respective strengths and weaknesses. Sci Rep. 2019;9:10508.
- Longo DL. Personalized Medicine for Primary Treatment of Serous Ovarian Cancer. N Engl J Med. 2019;381:2471–2474.
- Coleman RL, Fleming GF, Brady MF, et al. Veliparib with first-line chemotherapy and as maintenance therapy in ovarian cancer. N Engl J Med. 2019;381:2403–2415.
- Gonzalez-Martin A, Pothuri B, Vergote I, et al. Niraparib in patients with newly diagnosed advanced ovarian cancer. N Engl J Med. 2019;381:2391–2402.
- Ray-Coquard I, Pautier P, Pignata S, et al. Olaparib plus bevacizumab as first-line maintenance in ovarian cancer. N Engl J Med. 2019;381:2416–2428.
- Patch AM, Christie EL, Etemadmoghadam D, et al. Whole-genome characterization of chemoresistant ovarian cancer. Nature. 2015;521:489–494.
- Shih AJ, Menzin A, Whyte J, et al. Identification of grade and origin specific cell populations in serous epithelial ovarian cancer by single cell RNA-seq. PLoS One. 2018;13:e0206785.
- Butler A, Hoffman P, Smibert P, et al. Integrating single-cell transcriptomic data across different conditions, technologies, and species. Nat Biotechnol. 2018;36:411–420.
- Stuart T, Butler A, Hoffman P, et al. Comprehensive integration of single-cell data. Cell. 2019;177:1888–902 e21.
- Ortega MA, Poirion O, Zhu X, et al. Using single-cell multiple omics approaches to resolve tumor heterogeneity. Clin Transl Med. 2017;6:46.
- Olshen AB, Venkatraman ES, Lucito R, et al. Circular binary segmentation for the analysis of array-based DNA copy number data. Biostatistics. 2004;5:557–572.
- Delaney JR, Patel CB, Bapat J, et al. Autophagy gene haploinsufficiency drives chromosome instability, increases migration, and promotes early ovarian tumors. PLoS Genet. 2020;16:e1008558.
- Ortell KK, Switonski PM, Delaney JR. FairSubset: A tool to choose representative subsets of data for use with replicates or groups of different sample sizes. J Biol Methods. 2019;6:e118.
- Sack LM, Davoli T, Li MZ, et al. Profound tissue specificity in proliferation control underlies cancer drivers and aneuploidy patterns. Cell. 2018;173:499–514 e23.
- Solimini NL, Xu Q, Mermel CH, et al. Recurrent hemizygous deletions in cancers may optimize proliferative potential. Science. 2012;337:104–109.
- Delaney JR, Patel C, McCabe KE, et al. A strategy to combine pathway-targeted low toxicity drugs in ovarian cancer. Oncotarget. 2015;6:31104–31118.
- Davis MA, Delaney JR, Patel CB, et al. Nelfinavir is effective against human cervical cancer cells in vivo: a potential treatment modality in resource-limited settings. Drug Des Devel Ther. 2016;10:1837–1846.
- Sulzmaier FJ, Jean C, Schlaepfer DD. FAK in cancer: mechanistic findings and clinical applications. Nat Rev Cancer. 2014;14:598–610.
- Ward KK, Tancioni I, Lawson C, et al. Inhibition of focal adhesion kinase (FAK) activity prevents anchorage-independent ovarian carcinoma cell growth and tumor progression. Clin Exp Metastasis. 2013;30:579–594.
- Diaz Osterman CJ, Ozmadenci D, Kleinschmidt EG, et al. FAK activity sustains intrinsic and acquired ovarian cancer resistance to platinum chemotherapy. Elife. 2019;8:e47327.
- Zack TI, Schumacher SE, Carter SL, et al. Pan-cancer patterns of somatic copy number alteration. Nat Genet. 2013;45:1134–1140.
- Massague J, Obenauf AC. Metastatic colonization by circulating tumour cells. Nature. 2016;529:298–306.
- Gockley A, Melamed A, Bregar AJ, et al. Outcomes of women with high-grade and low-grade advanced-stage serous epithelial ovarian cancer. Obstet Gynecol. 2017;129:439–447.
- Hieronymus H, Murali R, Tin A, et al. Tumor copy number alteration burden is a pan-cancer prognostic factor associated with recurrence and death. Elife. 2018;7. DOI:10.7554/eLife.37294
- Correa RJ, Valdes YR, Shepherd TG, et al. Beclin-1 expression is retained in high-grade serous ovarian cancer yet is not essential for autophagy induction in vitro. J Ovarian Res. 2015;8:52.
- Fremont S, Gerard A, Galloux M, et al. Beclin-1 is required for chromosome congression and proper outer kinetochore assembly. EMBO Rep. 2013;14:364–372.
- Park JM, Tougeron D, Huang S, et al. Beclin 1 and UVRAG confer protection from radiation-induced DNA damage and maintain centrosome stability in colorectal cancer cells. PLoS One. 2014;9:e100819.
- Consortium ITP-CAoWG. Pan-cancer analysis of whole genomes. Nature. 2020;578:82–93.
- Kandoth C, McLellan MD, Vandin F, et al. Mutational landscape and significance across 12 major cancer types. Nature. 2013;502:333–339.
- Liu Y, Chen C, Xu Z, et al. Deletions linked to TP53 loss drive cancer through p53-independent mechanisms. Nature. 2016;531:471–475.
- Zhang S, Mercado-Uribe I, Xing Z, et al. Generation of cancer stem-like cells through the formation of polyploid giant cancer cells. Oncogene. 2014;33:116–128.
- White-Gilbertson S, Lu P, Jones CM, et al. Tamoxifen is a candidate first-in-class inhibitor of acid ceramidase that reduces amitotic division in polyploid giant cancer cells-Unrecognized players in tumorigenesis. Cancer Med. 2020;9:3142–3152.
- Haraksingh RR, Abyzov A, Urban AE. Comprehensive performance comparison of high-resolution array platforms for genome-wide Copy Number Variation (CNV) analysis in humans. BMC Genomics. 2017;18:321.
- Group PTC, Calabrese C, Davidson NR, Demircioglu D. et al. Genomic basis for RNA alterations in cancer. Nature. 2020;578:129–136.
- Zhang H, Liu T, Zhang Z, et al. Integrated proteogenomic characterization of human high-grade serous ovarian cancer. Cell. 2016;166:755–765.
- Coward J, Harding A. Size does matter: why polyploid tumor cells are critical drug targets in the war on cancer. Front Oncol. 2014;4:123.
- Schulze S, Petersen I. Gender and ploidy in cancer survival. Cell Oncol (Dordr). 2011;34:199–208.