
ABSTRACT
Heavy metal pollution is a problem that cannot be ignored. Due to the prevalence of cadmium in the environment and its harmful effects on humans, cadmium pollution has become a research hotspot recently. The mechanism of cadmium-induced toxicity has also drawn much attention and most studies have been conducted using whole cells, but the toxicological mechanism of cadmium remains unclear. In this study, we aimed to obtain NRK-52E cells at different growth stages by various methods and analyze the differences in cadmium toxicity. The results show that the cadmium sensitivity of cells in each phase was different and the late apoptotic rate was increased significantly after 5 µM Cd treatment. In addition, cadmium easily induces apoptosis of G0- and S-phase cells, as well as necrosis of S- and M-phase cells, but has no significant effect on G1-phase cells. Overall, we first explored the differences in the effects of cadmium on NRK-52E cells at various growth phases. Besides, the findings of this study might provide a theoretical basis for further exploration of the toxicological mechanism of cadmium.Abbreviations Cd: cadmium; CDK: cyclin-dependent kinases; DAPI 2-(4-amidinophenyl)-1H-indole-6-carboxamidine; TBST: Tris-buffered saline with Tween-20; PI: propidium iodide; DMEM: Dulbecco’s Modified Eagle Medium; BCA: bicinchoninic acid
1. Introduction
Cadmium (Cd) is a ubiquitous environmental pollutant with toxic effects on the kidney, bone, testis, liver, brain, and other organs [Citation1–4]. In addition, Cd exposure can cause DNA damage and affect the health of the next generation [Citation5,Citation6]. Although extensive toxicological studies have been carried out in recent years, most of them have not been conducted using synchronized cells. However, cell cycle synchronization may affect the results of the experiment. It is well known that during the process of cell proliferation, except for cells in the G0 phase that stop proliferating, most of the cells are in the G1, S, and G2 phases, and some are in the M phase [Citation7,Citation8]. Cells in different phases of division have different responses to drug intervention [Citation9]. So, in order to study the toxicological mechanism of Cd, it is necessary to explore the sensitivity of cells to Cd toxicity at various phases.
The cell cycle can be divided into G0, G1, S G2, and M phases. In the G0 phase, cells leave the cell cycle and temporarily stop dividing, but can reenter the cycle if stimulated by certain signals [Citation10]. Studies have reported that certain poisonous substances and lack of nutrition can induce apoptosis in G0-phase cells [Citation11,Citation12]. The G1 phase is characterized by active metabolism of substances, rapid synthesis of RNA and protein, and significant increase in cell volume. The S phase is the DNA synthesis phase, during which DNA and histones can be synthesized [Citation13]. During the G2 period, DNA synthesis is terminated, besides, a large amount of RNA and proteins are synthesized, including tubulin and pro-maturation factors [Citation14]. There are two stages in the cell cycle that are most important, G1 to S and G2 to M. Because a series of complex and active molecular changes take place in these two stages, they are easily affected by environmental conditions.
Many studies have shown that the various phases of the cell cycle are driven by the interaction between different cyclins and cyclin-dependent kinases [Citation15]. In addition, cyclins can be divided into G1-, S-, and M-phase cyclins. In vertebrates, cyclin D and cyclin E were expressed in the G1 phase but disappeared in the S phase. The S-phase cyclin mainly includes cyclin A, which is expressed during the S phase but begins to disappear in the middle phase. Besides, cyclin B is expressed in the S phase, reaches a peak in the G2/M phase, and disappears in mid-to-late transition. Cyclin D mainly binds to CDK4/CDK6 and regulates its activity. Moreover, cyclin E and cyclin A bind to CDK2 and activate its kinase activity. Moreover, the G2/M phase is mainly regulated by CDK1 kinase [Citation16,Citation17]. Studies in the past found that S-synchronized fibroblasts are more sensitive to Cd toxicity than cells in the G1 phase [Citation18], suggesting that Cd may target certain elements of DNA replication.
NRK-52E cells is a relatively stable and commonly used rat renal tubular epithelial cell line [Citation19–21]. When cells are exposed to harmful stimulation, apoptosis and necrosis are two common ways of death. Cd has the most significant effect on renal cells, furthermore, previous studies have shown that Cd can induce NRK-52E cell cycle arrest and apoptosis as well as necrosis [Citation22–24]. In addition, the mechanism is related to oxidative stress and inhibition of NF-kB activity, and Nrf2 has a protein effect on Cd-induced apoptosis [Citation25,Citation26]. However, it is still unclear whether the Cd cytotoxicity of cells is consistent across all phases. Therefore, in this study, we obtained G0-, G1-, S-, and M-phase NRK-52E cells by serum starvation or drug-induced methods. Next, the differences in sensitivity to Cd toxicity at various cell cycle phases were investigated. Our findings provide a basis for further exploration of the toxicological mechanism of Cd.
2. Materials and methods
2.1. Cell culture
NRK-52E cell line was available from shanghai Cell Bank of China Academy of Sciences and was grown in DMEM (Gibco, 12800–017) medium supplemented with 10% FBS (Gibco, 10437–028). When cells reached confluency, they were digested with trypsin (0.25%) for 1–3 min, following which trypsinization was stopped with serum-containing medium. And then the cells were resuspended in fresh complete medium, take a third of cells into a new culture flask and further incubated at 37°C in a 5% CO2 atmosphere. Cd chloride (Sigma-Aldrich, 202908) stock solution was dissolved in sterile ultrapure water and used in this research, and the working concentration used is determined by the results of previous studies [Citation23,Citation27].
2.2. Analysis of cell morphology using high-content imaging
NRK-52E cells were seeded into a 96-well PE Cell Carrier Ultra microplate and treated with Cd for 6 h. On reaching 60% confluency, cells were fixed with 4% paraformaldehyde for 30 min, washed twice with PBS and permeabilized with 0.5% Triton-100 for 15 min at 25°C. Next, cells were washed twice with PBS, blocked in 5% bovine serum albumin for 2 h, washed twice with PBS, incubated with 5 μg/mL TRITC-phalloidin for 20 min in the dark. Finally, washed two times with PBS again, cells were stained with 100 μg/mL DAPI for 15 min and washed twice with PBS. The cell morphology was analyzed using a high-content imaging and analysis instrument (USA; Operetta CLS).
2.3. Western blotting
Protein concentration was determined using the Pierce BCA Protein Assay Kit (Beyotime Biotechnology, Shanghai, China). Following this, 20–40 μg protein per sample was separated on the sodium dodecyl sulfate-polyacrylamide gel and transferred to a polyvinylidene fluoride membrane. The membrane was blocked with 5% skimmed milk in Tris-buffered saline with Tween-20 (TBST) for 120 min at 25°C, incubated overnight at 4°C with primary antibodies (dilute according to recommended dilution), washed three times with TBST on a horizontal shaker for 10 min, and then incubated with secondary antibodies for 120 min. Then, membranes were again washed three times with TBST on a horizontal shaker for 10 min. The grayscale values of the protein band were then determined and analyzed using the Image Lab software. The primary antibodies used were as follows: anti-β-actin (CST; 4970S), anti-p53 (CST; 32532S), anti-p21 (Abcam; ab109199), anti-Bax (Abcam; ab32503), anti-Bcl-2 (Abcam; ab136285), anti-cleaved caspase-9 (CST; 9508S), anti-cleaved caspase-3 (CST; 9664S), anti-CDK4 (Abcam; ab68266), anti-CDK2 (CST; 2546S), anti-cyclin D1 (CST; 55506S), and anti-cyclin E1 (CST; 20808S).
2.4. Flow cytometry
After obtaining synchronized cells, cells were collected directly or after treatment with 5 μM Cd for 6 h and subjected to flow cytometric analysis. For cell cycle analysis, cells were harvested with trypsin and fixed in 70% ethanol at 20°C for 24 h. Next, cells were washed three times with PBS and incubated with 500 μM PI/RNase staining buffer in the dark for 20 min. Cell cycle progression was analyzed using the CyAn ADP 7 flow cytometer (Beckman Coulter, Brea, CA, USA). In addition, apoptosis and necrosis were detected using the Annexin V-FITC/PI Apoptosis Detection Kit (Vazyme Biotech Co., Ltd.; A211), and after staining with FITC and PI, the apoptosis and necrosis rate were determined by flow cytometry. In the flow chart, the Q2 and Q3 quadrants are apoptotic cells and the Q1 quadrant is necrotic cells.
2.5. G0-phase cell synchronization
Serum starvation was used for synchronization of G0 phase cells. Briefly, 4 mL about 2 × 10⁵ NRK-52E cells were inoculated into a 60 mm dish and cultured for 24 h. The serum was eliminated from the DMEM medium at different time points of 0, 4, 8, 12, 18, and 24 h. Cells were then collected for flow cytometry or cell cycle analysis after incubation with Cd for 6 h.
2.6. G1-phase cell synchronization
First, the cells were blocked in the M phase. The medium was replaced with normal DMEM and cells were cultured for 5, 6, 7, and 8 h. Next, cells were collected, and cell cycle analysis was performed by flow cytometry. The optimal culture time for obtaining G1-phase cells was determined.
2.7. S-phase cell synchronization
Synchronization of S phase cells was performed using the thymidine double blocking method. Briefly, NRK-52E cells were grown to the early stages of the exponential growth phase and cultured in a medium containing 2.5 mmol/L thymidine for 15 h. The thymidine medium was then discarded, and cells were washed 3 times with PBS and cultured in fresh medium for 9 h. Following this, cells were again treated with 2.5 mmol/L thymidine for 15 h. The medium containing thymidine was discarded. Cells were washed 3 times with PBS and the medium was replaced with ordinary DMEM medium. After incubation for 1 h, cells were collected for flow cytometry analysis or Cd treatment.
2.8. M-phase cell synchronization
Synchronization of M-phase cells was performed using colchicine inhibition. Cells were first grown to an exponential growth phase, following which they were cultured in DMEM containing 0.1 μg/mL demecolcine (Sigma-Aldrich; D1925) for 6 h. The cell sample was then centrifuged at 500 g for 10 min and the supernatant was discarded. The precipitate was collected and contained cells in the M phase.
2.9. Statistical analysis
Data were presented as the mean ± standard deviation (SD) of at least three independent experiments. Differences between groups were evaluated with one-way analysis of variance (ANOVA) using SPSS 22 software and followed by the post hoc Fisher’s Least Significance Difference (LSD) test, P < 0.05 was considered statistically significant. The criteria for cell sensitivity to Cd were the ratio of Cd-treated synchronized cells/synchronized cells to the Cd-treated unsynchronized cells/unsynchronized cells, the ratio was compared to 1 and a difference of more than 0.1 was considered to be sensitive.
3. Results
3.1. Effect of Cd on cell morphology and expression of apoptosis-related proteins
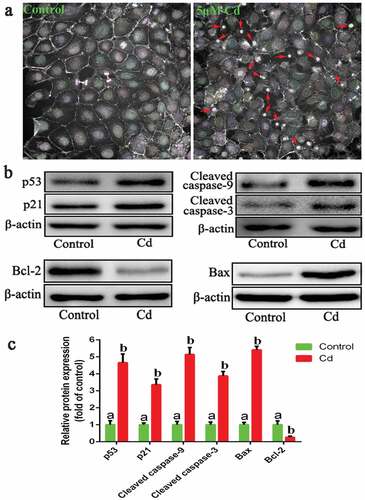
First, we analyzed the effect of Cd on cell morphology using a high-content imaging and analysis instrument. The results showed that after 6 h of Cd treatment, many cells contracted and damaged with altered morphology (shown by the red arrow), resulting in cell death (). Western blot analysis showed that the protein expression of p53, p21, Bax, cleaved caspase-9 and cleaved caspase-3 were significantly increased in the Cd treatment group, while Bcl-2 was significantly decreased compared to the control group (). These results indicated that Cd induces apoptosis in NRK-52E cells.
Figure 1. Effect of Cd on NRK-52E cell morphology and apoptosis. (a) High-content imaging and analysis of Cd damage to cells (40×). (b) the expression of apoptosis-related proteins. (c) the gray value analysis results of protein bands. Statistical significance between samples was evaluated by one-way ANOVA, followed by LSD test. Groups marked with different letters, the difference between them was significant (P < 0.05)
3.2. Cd is easy to induce apoptosis in G0 cells rather than necrosis
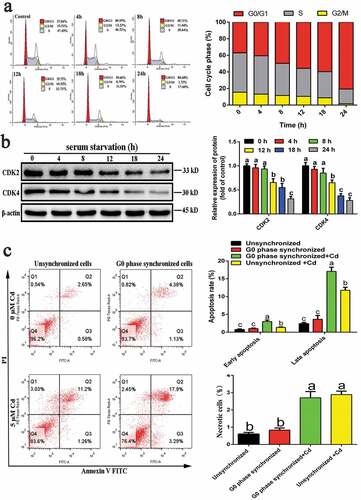
G0-phase cells were obtained by serum starvation. Results showed that serum starvation for 24 h increased the proportion of G0-/G-phase cells from 37.04% to 80.68% (), and significantly reduced the expression of CDK2 and CDK4 (). Furthermore, most cells were arrested in the G0 phase after serum starvation for 24 h. G0-phase-synchronized cells and unsynchronized cells were treated with Cd for 6 h, and the changes in apoptosis and necrosis rates were detected by flow cytometry. Besides, the results () showed that, compared with the untreated group, Cd treatment significantly increased the early and late apoptotic rates of G0-phase cells and unsynchronized cells, as well as the necrosis rate. Besides, compared with that of Cd-treated unsynchronized cells, the apoptosis rate of Cd-treated G0-synchronized cells was significantly higher; however, there was no significant difference in the necrosis rate.
Figure 2. Acquisition of G0-phase NRK-52E cells and the effect of Cd on its apoptosis and necrosis rates. (a) The effect of serum starvation on cell cycle distribution. (b) Western blotting was used to detect the expression of cyclins associated with G0 phase. (c) The effect of Cd on the apoptosis and necrosis rates of G0-phase-synchronized cells was detected by flow cytometry. Statistical significance between samples was evaluated by one-way ANOVA, followed by LSD test. Groups marked with different letters, the difference between them was significant (P < 0.05)
3.3. G1-phase cells are less sensitive to Cd
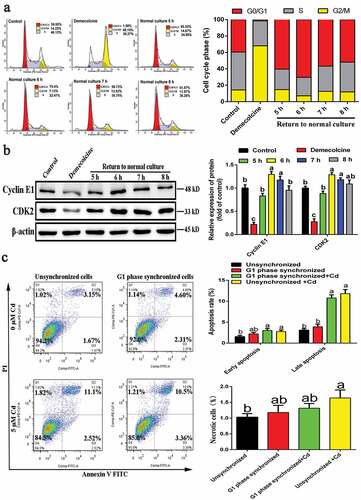
G1-phase cells were obtained as shown in and the results showed that, at 6 h, the number of cells in the G0/G1 phase increased from 1.58% to 70.4%, and that of cells in the G1 phase reached a maximum. In addition, western blotting results () showed that the expression levels of cyclin E1 and CDK2 in the demecolcine treatment group were significantly reduced compared to the control group, but began to increase after the medium was replaced with DMEM complete medium, reaching a maximum at 6 h. Therefore, 6 h was selected as the acquisition time for G1-phase cells. G1-phase-synchronized cells and unsynchronized cells were subjected to Cd treatment for 6 h, and the changes in apoptosis and necrosis rates were detected by flow cytometry. As shown in , compared with the unstained Cd group, Cd treatment significantly increased the late apoptotic rate of G1-phase cells and unsynchronized cells, and significantly altered the necrosis rate of unsynchronized cells. Besides, there was no significant difference in the apoptotic as well as necrosis rates between Cd-treated G1-synchronized and unsynchronized cells.
Figure 3. Acquisition of G1-phase NRK-52E cells and the effect of Cd on its apoptosis and necrosis rates. (a) Flow cytometry was used to detect the cell cycle distribution of demecolcine-treated and restored normal culture cells. (b) Western blotting was used to detect the expression of cyclins associated with G1 phase. (c) The effect of Cd on the apoptosis and necrosis rates of G1-phase-synchronized cells was detected by flow cytometry. Statistical significance between samples was evaluated by one-way ANOVA, followed by LSD test. Groups marked with different letters, the difference between them was significant (P < 0.05)
3.4. Cd exposure significantly affects the apoptosis and necrosis rate of S-phase cells
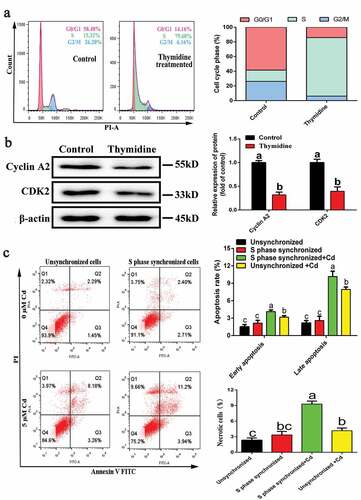
S-phase cells were obtained as shown in . After double blocking with thymidine, the number of S-phase cells increased from 15.32% to 79.68%. Western blotting results showed that the expression levels of the key proteins, cyclin A2 and CDK2, were significantly reduced in S-phase cells (). These results indicated that synchronization of S-phase cells was successful. S-phase-synchronized cells and unsynchronized cells were subjected to Cd treatment for 6 h, and changes in apoptosis and necrosis rates were examined by flow cytometry. As shown in , compared with the unstained Cd group, Cd exposure significantly increased the early and late apoptotic rates of S-phase cells and unsynchronized cells, and significantly altered the necrosis rate. In addition, the apoptotic and necrosis rates of the S-synchronized cells stained with the Cd group were significantly higher than those of the unsynchronized cells stained with the Cd group.
Figure 4. Acquisition of S-phase NRK-52E cells and the effect of Cd on its apoptosis and necrosis rates. (a) Flow cytometry was used to detect cell cycle distribution after thymidine treatment. (b) Western blotting was used to detect the expression of cyclins associated with S phase. (c) The effect of Cd on the apoptosis and necrosis rates of S-phase-synchronized cells was detected by flow cytometry. Statistical significance between samples was evaluated by one-way ANOVA, followed by LSD test. Groups marked with different letters, the difference between them was significant (P < 0.05)
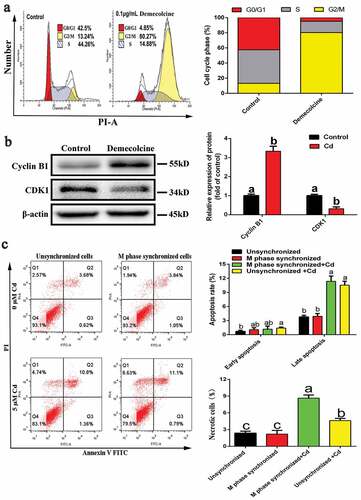
3.5. The effect of Cd on necrosis rate is stronger than that on apoptosis rate in M-phase cells
M-phase cells were obtained as shown in . The number of G2-/M-phase cells increased from 13.24% to 80.27% after double blocking with demecolcine. In addition, the results of western blot showed that the expression of cyclin B1 was significantly increased while CDK1 was significantly decreased (). These results indicated that synchronization of M-phase cells was successful. Then, the M-phase-synchronized cells and unsynchronized cells were subjected to Cd treatment for 6 h, and the changes in apoptosis and necrosis rates were examined by flow cytometry. As shown in , compared with the unstained Cd group, Cd exposure significantly increased the late apoptotic rate of M-phase cells and unsynchronized cells, and significantly increased the necrosis rate of M-phase cells. In addition, compared with that of unsynchronized cells stained with the Cd group, the necrosis rate of M-phase-synchronized cells stained with the Cd group was significantly higher; however, there was no significant difference in the apoptotic rate.
Figure 5. Acquisition of M-phase NRK-52E cells and the effect of Cd on its apoptosis and necrosis rates. (a) Flow cytometry was used to detect cell cycle distribution after demecolcine treatment. (b) Western blotting was used to detect the expression of cyclins associated with M phase. (c) The effect of Cd on the apoptosis and necrosis rates of M-phase-synchronized cells was detected by flow cytometry. Statistical significance between samples was evaluated by one-way ANOVA, followed by LSD test. Groups marked with different letters, the difference between them was significant (P < 0.05)
3.6. Sensitivity of cells to Cd at different phases
Statistical analysis of the apoptotic and necrosis rates () was performed. The results showed that Cd was more likely to induce apoptosis in G0- and S-phase cells and affect the necrosis rate of S- and M-phase cells, while G1-phase cells were less sensitive to Cd ().
Table 1. Sensitivity of cells to Cd at different phases
4. Discussion
To date, most of the toxicological studies have been conducted using whole-cell populations. However, due to differences in cells at various growth stages, their response to toxins is different. In addition, although the toxicological mechanism of Cd has been extensively studied [Citation28,Citation29], there are no reports on the Cd sensitivity of G0-, G1-, S-, G2-, and M-phase cells. Therefore, in this study, we aimed to reveal the differences in Cd cytotoxicity of NRK-52E cells at various time periods. Our results showed that the NRK-52E cells have different sensitivities to Cd in different periods, and Cd treatment can significantly increase the late apoptotic rate in each period.
p21 is a downstream protein of p53, a cell cycle inhibitory protein with the broadest kinase inhibition activity, which can inhibit various cyclin-CDK complexes. When cells are subjected to damage in vivo or in vitro, p53 triggers p21 expression, and p21/p53 together act as the G1-phase checkpoint [Citation30,Citation31], and they play an important role in apoptosis and cell cycle [Citation32]. Cd is a toxic heavy metal. After entering the body through the respiratory and food chains, Cd will cause damage to tissues and cells as well as induce the development of various diseases. Previous studies have shown that Cd exposure can induce oxidative stress and apoptosis in a variety of cells [Citation33–35]. Our findings revealed that the expression of p53, p21, and related apoptotic proteins were increased significantly after Cd treatment. In addition, flow cytometry results showed that Cd mainly induced late apoptosis in NRK-52E cells, and the late apoptotic rate was significantly higher than the early apoptotic rate, which may be related to Cd toxicity.
In several previous studies, serum starvation has been used to obtain G0-synchronized cells [Citation36,Citation37]. When the serum concentration was low, the cell growth and the expression of cyclin-dependent kinases (CDK2 and CDK4) were inhibited due to the lack of sufficient growth factors [Citation38]. Therefore, a large number of cells originally in the S and G2/M phases enter a resting state, and the cell cycle is arrested in the G0/G1 phase. Demecolcine has been shown to inhibit spindle formation and microtubule polymerization and has been used to obtain M phase cells. However, due to its cytotoxicity, it is necessary to control its dosage [Citation39]. The S-phase synchronization method is based on the principle of blocking DNA synthesis by excess thymidine [Citation40]. In order to enhance the effect of cell synchronization, double blocking is often performed. Because the M phase is followed by the G1 phase, G1-phase cells are obtained by re-adding M-phase cells to the complete medium, followed by culture for 1–10 h. In this study, serum starvation, demecolcine and thymidine were used to synchronize cell cycle. Although the results of cell synchronization were good, it also had some adverse effects on cells. So it is necessary to further explore the methods of cell synchronization.
The results of this study show that Cd is more likely to induce apoptosis in G0- and S-phase cells. It may be due to the relatively fragile G0-phase cells obtained by serum starvation, and cells in the S phase (phase of rapid DNA synthesis) are very active. Hence, environmental toxins, like Cd can easily cause DNA damage and inhibits DNA synthesis [Citation18,Citation41]. The G1 phase, known as the pre-DNA synthesis phase, is the first phase of the cell cycle. The results of this study showed that Cd has little effect on G1 cells, which may be related to the fact that DNA synthesis has not been carried out during this period. Our results also showed that, compared with the unsynchronized cells stained with Cd group, Cd exposure induced necrosis in M-phase cells but had no significant effect on the apoptotic rate. This may be due to the fact that M phase is the cell cleavage phase and is more sensitive to toxins. Additionally, it has been reported that Cd has a relatively high toxic effect on spindle formation and cell division [Citation42], so it is likely to cause cell death. The toxic damage of Cd to the kidney has been clear, but its toxicity mechanism needs further study. In addition, whether there is a connection between nephrotoxicity and the cell cycle is not yet clear. In this study, NRK-52E cells were used for synchronization-related research, which showed that the toxicity of Cd to kidney cells is related to the period of the cells. Although this study revealed the effect of Cd on NRK-52E cells at various growth stages, its potential mechanism of action remains to be further explored.
In conclusion, the findings of our study showed that Cd treatment significantly increased the late apoptotic rate of cells in each period and the effect of Cd on late apoptosis was stronger than that on early apoptosis. In addition, we demonstrated that NRK-52E cells at different phases had different toxic responses to Cd, among them, G0 and S-phase cells were prone to apoptosis, S- and M-phase cells were prone to necrosis, besides, G1 cells were less affected.
Disclosure statement
The authors declare that they have no conflict of interest.
Additional information
Funding
References
- Gong ZG, Wang XY, Wang JH, et al. Trehalose prevents cadmium-induced hepatotoxicity by blocking Nrf2 pathway, restoring autophagy and inhibiting apoptosis. J Inorg Biochem. 2019;192(62–71):62–71.
- Avallone B, Agnisola C, Cerciello R, et al. Structural and functional changes in the zebrafish (Danio rerio) skeletal muscle after cadmium exposure. Cell Biol Toxicol. 2015;31:273–283.
- Nasiadek M, Danilewicz M, Klimczak M, et al. Subchronic exposure to cadmium causes persistent changes in the reproductive system in female wistar rats. Oxid Med Cell Longev. 2019;2019:6490820.
- Wang JC, Zhu HL, Zhang C, et al. Baicalein ameliorates cadmium-induced hepatic and renal oxidative damage in rats. Indian J Anim Res. 2019;53:523–527.
- Zhang T, Gao X, Luo X, et al. The effects of long-term exposure to low doses of cadmium on the health of the next generation of mice. Chem Biol Interact. 2019;312:108792.
- Tan HW, Liang Z-L, Yao Y, et al. Lasting DNA damage and aberrant DNA repair gene expression profile are associated with post-chronic cadmium exposure in human bronchial epithelial cells. Cells. 2019;8(8):842.
- Hagen M, Pfister E, Kosel A, et al. Cell cycle re-entry sensitizes podocytes to injury induced death. Cell Cycle. 2016;15:1929–1937.
- Boward B, Wu T, Dalton S. Concise review: control of cell fate through cell cycle and pluripotency networks. Stem Cells. 2016;34:1427–1436.
- Coquelle A, Mouhamad S, Pequignot MO, et al. Enrichment of non-synchronized cells in the G1, S and G2 phases of the cell cycle for the study of apoptosis. Biochem Pharmacol. 2006;72:1396–1404.
- Otsuki L, Brand AH. Cell cycle heterogeneity directs the timing of neural stem cell activation from quiescence. Science. 2018;360(6384):99–102.
- Saleh AM, El-Abadelah MM, Aziz MA, et al. Antiproliferative activity of the isoindigo 5ʹ-Br in HL-60 cells is mediated by apoptosis, dysregulation of mitochondrial functions and arresting cell cycle at G0/G1 phase. Cancer Lett. 2015;361:251–261.
- Dalman A, et al. Synchronizing cell cycle of goat fibroblasts by serum starvation causes apoptosis. Reprod Domest Anim. 2010;45:e46–53.
- Poncelet L, Garigliany M, Ando K, et al. Cell cycle S phase markers are expressed in cerebral neuron nuclei of cats infected by the feline panleukopenia virus. Cell Cycle. 2016;15:3482–3489.
- Yamada T, Das Gupta TK, Beattie CW. p28-mediated activation of p53 in G2-M phase of the cell cycle enhances the efficacy of DNA damaging and antimitotic chemotherapy. Cancer Res. 2016;76:2354–2365.
- Venuto S, Merla G. E3 ubiquitin ligase TRIM proteins, cell cycle and mitosis. Cells. 2019;8:510.
- Chen MJ, Cheng AC, Lee MF, et al. Simvastatin induces G1 arrest by up-regulating GSK3beta and down-regulating CDK4/cyclin D1 and CDK2/cyclin E1 in human primary colorectal cancer cells. J Cell Physiol. 2018;233:4618–4625.
- Korzelius J, The I, Ruijtenberg S, et al. Caenorhabditis elegans cyclin D/CDK4 and cyclin E/CDK2 induce distinct cell cycle re-entry programs in differentiated muscle cells. PLoS Genet. 2011;7:e1002362.
- Cao F, Zhou T, Simpson D, et al. p53-dependent but ATM-independent inhibition of DNA synthesis and G2 arrest in cadmium-treated human fibroblasts. Toxicol Appl Pharmacol. 2007;218:174–185.
- Fongsupa S, Soodvilai S, Muanprasat C, et al. Activation of liver X receptors inhibits cadmium-induced apoptosis of human renal proximal tubular cells. Toxicol Lett. 2015;236:145–153.
- Wang X, Nichols L, Grunz-Borgmann EA, et al. Fascin2 regulates cisplatin-induced apoptosis in NRK-52E cells. Toxicol Lett. 2017;266:56–64.
- Hsu YH, Chen T-H, Chen Y-C, et al. Urotensin II exerts antiapoptotic effect on NRK-52E cells through prostacyclin-mediated peroxisome proliferator-activated receptor alpha and Akt activation. Mol Cell Endocrinol. 2013;381:168–174.
- Xie J, Shaikh ZA. Cadmium induces cell cycle arrest in rat kidney epithelial cells in G2/M phase. Toxicology. 2006;224:56–65.
- Luo T, Yuan Y, Yu Q, et al. PARP-1 overexpression contributes to cadmium-induced death in rat proximal tubular cells via parthanatos and the MAPK signalling pathway. Sci Rep. 2017;7:4331.
- Messner B, Turkcan A, Ploner C, et al. Cadmium overkill: autophagy, apoptosis and necrosis signalling in endothelial cells exposed to cadmium. Cell Mol Life Sci. 2016;73:1699–1713.
- Xie J, Shaikh ZA. Cadmium-induced apoptosis in rat kidney epithelial cells involves decrease in nuclear factor-kappa B activity. Toxicol Sci. 2006;91:299–308.
- Chen J, Shaikh ZA. Activation of Nrf2 by cadmium and its role in protection against cadmium-induced apoptosis in rat kidney cells. Toxicol Appl Pharmacol. 2009;241:81–89.
- Luo T, Yu Q, Zou H, et al. Role of poly (ADP-ribose) polymerase-1 in cadmium-induced cellular DNA damage and cell cycle arrest in rat renal tubular epithelial cell line NRK-52E. Environ Pollut. 2020;261:114149.
- Zhang H, Reynolds M. Cadmium exposure in living organisms: a short review. Sci Total Environ. 2019;678:761–767.
- Bertin G, Averbeck D. Cadmium: cellular effects, modifications of biomolecules, modulation of DNA repair and genotoxic consequences (a review). Biochimie. 2006;88:1549–1559.
- Liu G, Zhang Q, Xia L, et al. RNA-binding protein CELF6 is cell cycle regulated and controls cancer cell proliferation by stabilizing p21. Cell Death Dis. 2019;10:688.
- Ou HL, Schumacher B. DNA damage responses and p53 in the aging process. Blood. 2018;131:488–495.
- Wang X, Simpson ER, Brown KA. p53: protection against tumor growth beyond effects on cell cycle and apoptosis. Cancer Res. 2015;75:5001–5007.
- Zhu HL, Xu X-F, Shi X-T, et al. Activation of autophagy inhibits cadmium-triggered apoptosis in human placental trophoblasts and mouse placenta. Environ Pollut. 2019;254:112991.
- Luo T, Zhang H, Yu Q, et al. ERK1/2 MAPK promotes autophagy to suppress ER stress-mediated apoptosis induced by cadmium in rat proximal tubular cells. Toxicol In Vitro. 2018;52:60–69.
- Chiarelli R, Roccheri MC. Heavy metals and metalloids as autophagy inducing agents: focus on cadmium and arsenic. Cells. 2012;1:597–616.
- Tong J, Sun D, Yang C, et al. Serum starvation and thymidine double blocking achieved efficient cell cycle synchronization and altered the expression of p27, p53, bcl-2 in canine breast cancer cells. Res Vet Sci. 2016;105:10–14.
- Zhao Q, Wu Y, Shan Z, et al. Serum starvation-induced cell cycle synchronization stimulated mouse rDNA transcription reactivation during somatic cell reprogramming into iPSCs. Stem Cell Res Ther. 2016;7:112.
- Shin JS, et al. Serum starvation induces G1 arrest through suppression of Skp2-CDK2 and CDK4 in SK-OV-3 cells. Int J Oncol. 2008;32:435–439.
- Li S, Kang J-D, Jin J-X, et al. Effect of demecolcine-assisted enucleation on the MPF level and cyclin B1 distribution in porcine oocytes. PLoS One. 2014;9:e91483.
- Galgano PJ, Schildkraut CL. G1/S phase synchronization using double thymidine synchronization. CSH Protoc. 2006;2006. DOI:10.1101/pdb.prot4487.
- Zhang S, et al. Cadmium disrupts the DNA damage response by destabilizing RNF168. Food Chem Toxicol. 2019;133:110745.
- Liu Y, Wang P, Wang Y, et al. The influence on cell cycle and cell division by various cadmium-containing quantum dots. Small. 2013;9:2440–2451.