
ABSTRACT
CST (CTC1-STN1-TEN1) is a heterotrimeric, RPA-like complex that binds to single-stranded DNA (ssDNA) and functions in the replication of telomeric and non-telomeric DNA. Previous studies demonstrated that deletion of CTC1 results in decreased cell proliferation and telomere DNA damage signaling. However, a detailed analysis of the consequences of conditional CTC1 knockout (KO) has not been fully elucidated. Here, we investigated the effects of CTC1 KO on cell cycle progression, genome-wide replication and activation of the DNA damage response. Consistent with previous findings, we demonstrate that CTC1 KO results in decreased cell proliferation, G2 arrest and RPA-bound telomeric ssDNA. However, despite the increased levels of telomeric RPA-ssDNA, global ATR-dependent CHK1 and p53 phosphorylation was not detected in CTC1 KO cells. Nevertheless, we show that RPA-ssDNA does activate ATR, leading to the phosphorylation of RPA and autophosphorylation of ATR. Further analysis determined that inactivation of ATR, but not CHK1 or ATM, suppressed the accumulation of G2 arrested cells and phosphorylated RPA following CTC1 removal. These results suggest that ATR is localized and active at telomeres but is unable to elicit a global checkpoint response through CHK1. Furthermore, CTC1 KO inhibited CHK1 phosphorylation following hydroxyurea-induced replication stress. Additional studies revealed that this suppression of CHK1 phosphorylation, following replication stress, is caused by decreased levels of the ATR activator TopBP1. Overall, our results identify CST as a novel regulator of the ATR-CHK1 pathway.
Introduction
DNA damage can arise from both endogenous and exogenous factors, such as replication stress, ionizing radiation and oxidation. To prevent genome instability and disease, cells have evolved elaborate signaling pathways to sense the damage, arrest the cell cycle and repair the damaged DNA. This process, known as the DNA damage response (DDR), is primarily mediated by three members of the Phosphatidylinositol-3-kinase-related kinase (PIKK) family, namely ataxia telangiectasia mutated (ATM), ataxia telangiectasia and Rad3-related (ATR) and DNA-dependent protein kinase (DNA-PK) [Citation1]. Activation of these kinases in response to DNA damage leads to the phosphorylation of downstream effectors and stabilization of the tumor suppressor, p53. p53 in turn induces transcription of downstream targets, such as p21, that facilitate cell cycle arrest and eventual apoptosis or senescence, if the damage is not resolved.
ATM and DNA-PK are primarily activated in response to double-strand breaks (DSBs), whereas ATR coordinates the repair of DNA damage arising from single stranded DNA (ssDNA) gaps or breaks. ATR plays a primary role in managing replication stress during S-phase and is essential for the survival of dividing cells [Citation2–4]. During S-phase, ssDNA can arise from uncoupling of the helicase from the replisome and nucleolytic processing of various replication and repair intermediates [Citation5,Citation6]. Once exposed, large regions of ssDNA are quickly bound by the ssDNA binding protein, replication protein A (RPA) [Citation7]. ATR interacting protein (ATRIP) then associates with the RPA-bound ssDNA (RPA-ssDNA), which localizes ATR [Citation8]. Localization of ATR, however, is insufficient to fully activate ATR kinase activity.
In vertebrates, two major ATR activating proteins have been identified, topoisomerase 2-binding protein 1 (TopBP1) and Ewing’s tumor-associated antigen 1 (ETAA1) [Citation9–12]. Both proteins contain ATR activating domains (AAD) that modulate ATR kinase activity [Citation13]. ETAA1 was only recently discovered and less is known about the mechanism by which it activates ATR. However, recent work suggests that ETAA1 plays only a minor role in ATR activation during the DDR [Citation14,Citation15]. Instead, ETAA1 plays a primary function in proper chromosome alignment and checkpoint activation in metaphase as well as preventing untimely entry into G2. On the other hand, TopBP1 is essential for ATR activation in response to ssDNA damage [Citation12]. Localization of TopBP1 involves interaction with RPA-ssDNA and the RAD9-RAD1-HUS1 (9-1-1) complex, which is loaded at 5 'ssDNA-dsDNA junctions [Citation16–18]. Once activated, ATR phosphorylates numerous downstream targets, including checkpoint kinase 1 (CHK1) and p53 [Citation19–21]. CHK1 then promotes the degradation of CDC25A, leading to inactivation of cyclin-dependent kinases and inhibition of replication origin firing [Citation22]. Failure to activate the ATR-CHK1 pathway, particularly following treatment with replication inhibitors or in cancer cells with high levels of genome instability, leads to impaired growth and cell death. Several ATR/CHK1 inhibitors are currently in clinical trials or in development as cancer therapeutics [Citation23].
In the current study, we examined the effects of conditional gene knockout of the largest subunit of CST (CTC1-STN1-TEN1), CTC1, on checkpoint activation at telomeres and following genome-wide replication stress. CST is a conserved, ssDNA binding protein with similarities to RPA (RPA1-RPA2-RPA3) [Citation7]. Both RPA and CST are heterotrimeric and contain a number of oligonucleotide-oligosaccharide binding folds (OB-folds), which are used for DNA binding and protein-protein interactions. Structural studies demonstrate a high degree of structural homology between the OB-folds in CST and RPA [Citation24,Citation25]. Despite their similarities, RPA and CST appear to have distinct modes of binding and cellular function with CST having preference for G-rich DNA sequences [Citation26–28]. CST plays a critical role in telomere replication and less characterized functions in genome-wide replication and DSB repair [Citation27,Citation29–35]. At telomeres, CST promotes telomerase dissociation following telomere extension and is then required to convert the G-rich ssDNA overhang (G-overhang) to duplex DNA through a process known as C-strand fill-in [Citation28,Citation36].
Previous work demonstrated that conditional deletion of human CTC1 leads to growth inhibition and unregulated lengthening of the G-overhang by telomerase as well as shortening of telomeres from the inability to perform C-strand fill-in [Citation37]. Since telomeres resemble DNA breaks, they must be protected from recognition by the DDR. Telomere G-overhangs are typically protected by POT1, a member of the shelterin complex. However, these extended G-overhangs in CTC1 deleted cells exhaust the cellular pools of POT1, leading to telomeric RPA-ssDNA and telomeric γH2AX, a marker of DNA damage. While this accumulation of RPA-ssDNA is predicted to elicit activation of the ATR-CHK1 pathway, this was not directly tested in previous studies [Citation37,Citation38].
Here, we examined how conditional CTC1 KO affects DNA damage signaling. In agreement with previous studies, we find that CTC1 deletion leads to decreased proliferation, the accumulation of G2 arrested cells and telomeric damage signaling [Citation35,Citation37]. Unexpectedly, we demonstrate that while CTC1 deletion leads to ATR activation and the phosphorylation of telomeric RPA, global CHK1 phosphorylation is not detected. Further analysis revealed that TopBP1 levels are decreased following CTC1 deletion, leading to a significant decrease in ATR-mediated CHK1 activation following HU-induced fork stalling. Overall, this work implicates CST as a novel regulator of the ATR-CHK1 pathway and that ATR acts independently of CHK1 to induce cell cycle arrest following CTC1 deletion.
Materials and methods
Cell culture
HCT116 CTC1F/F and CTC1F/F+ Flag-CTC1 cells were generously provided by Dr. Carolyn Price [Citation37] and were maintained in McCoy’s 5A media supplemented with 10% fetal bovine serum and 1% penicillin/streptomycin at 37ºC with 5% CO2. Cells were checked regularly for mycoplasma contamination. To induce Cre-ER mediated recombination of the CTC1 gene, a final concentration of 10 nM tamoxifen (TAM) was added to CTC1F/F and CTC1F/F+ Flag-CTC1 cells. The initial addition of TAM is indicated as day 0. At each passage, 10 nM TAM was again added to ensure CTC1 gene disruption. For siRNA knockdown, 5 nM ON-TARGETplus siRNA SMART pools to p53 (L-003329-00), ATM (L-003201-00-0005), ATR (L-003202-00-0005), CHK1 (L-003255-00-0005) or a non-targeting control (D-001810-10-05) (Dharmacon) were transfected into cells with Lipofectamine RNAiMAX (Thermo Fisher Scientific). siRNA treatment lasted 72 h and began on day 8 after TAM addition. For Flag-TopBP1 transfection, cells were plated 24 h before transfection in 100 mm dishes at 1 × 10⁶ cells. 12.5 μg of pcDNA3-TopBP1 was mixed with 25 μl of Polyethylenimine (1 mg/ml) (Polysciences) in a total volume of 550 μl for each transfection. The pcDNA3-TopBP1 plasmid was generously provided by Dr. Weei-Chen Lin [Citation39]. After 48 h, the cells were collected and whole cell protein extraction performed (see below).
Whole cell protein extraction
Cell pellets were lysed, sonicated and nuclease-treated, as previously described [Citation30]. The supernatant was collected and protein concentration measured by BCA assay (Thermo Fisher). The samples were then mixed with SDS-PAGE loading buffer and analyzed by Western blot, as described below.
Subcellular fractionation for protein extraction
Cell pellets were lysed in 200 µL Buffer A (10 mM HEPES pH 7.9, 10 mM KCl, 1.5 mM MgCl2, 0.34 M Sucrose, 1 mM DTT, 0.1% Triton X-100, 1x phosphatase inhibitors [4 mM β-glycerophosphate, 4 mM sodium vanadate, and 20 mM sodium fluoride] and 1x protease inhibitors [1 µg/mL pepstatin A, 5 µg/mL leupeptin, 1 µg/mL E64, 2 µg/mL aprotinin, and 5 µg/mL antipain]) and incubated on ice for 10 min. Cell lysates were centrifuged at 4ºC 1300 x g for 5 min. The supernatant was transfered to a new tube and excess cell debris was removed by centrifugation at 20,000x g for 15 min at 4ºC. The supernatant (soluble fraction) was transferred to a new tube. Cell pellets containing nuclei were resuspended in 100 µl Buffer B (3 mM EDTA pH 8.0, 0.2 mM EGTA, 1 mM DTT, 1x phosphatase inhibitors, and 1x protease inhibitors) and incubated on ice for 30 min with mixing at 15 and 30 min. The samples were then centrifuged at 2,000 x g for 5 min at 4ºC and the supernatant containing the soluble nuclear fraction was transferred to a new tube. Cell pellets containing the chromatin bound fraction were resuspended in 100 µL Buffer A and then sonicated at 40% amplitude for 3 cycles of 10 seconds on and 5 seconds rest. Samples were then treated with Benzonase (0.0625 U/µL; EMD Millipore) for 1 h on ice followed by centrifugation at 15,800 x g for 10 min at 4ºC and the supernatant saved as the chromatin fraction. Protein concentrations were determined with the BCA assay and samples analyzed by Western blot, as described below.
Western blot analysis
20–40 µg of protein were run by SDS-PAGE and transferred to a nitrocellulose membrane. All membranes were checked with Ponceau S staining for transfer efficiency and total protein loading. Membranes to analyze CTC1 levels were blocked with 3% BSA in 1x phosphate-buffered saline (PBS) plus 0.1% Tween 20 (PBST) for at least 2 h, and all subsequent antibodies were diluted in 3% BSA-PBST. For analysis of phosphorylated CHK1 S317, CHK S345 and ATR T1989, membranes were blocked in 5% nonfat milk in 1x Tris-buffered saline (TBS) plus 0.1% Tween 20 (TBST) for at least 2 h, and all subsequent antibodies were diluted in 5% nonfat milk-TBST. For all other western blots, membranes were blocked in 5% nonfat milk-PBST for at least 2 h. Primary antibodies were diluted in 5% nonfat milk-PBST and incubated at 4°C overnight. The membranes were then washed 3 x for 10 min each in PBST (TBST for pCHK1 S317, pCHK1 S345 and pATR T1989). Secondary antibodies were diluted in the solution indicated above for at least 2 h at room temperature. After incubation the blots were then developed with Western Lightning Plus ECL (Perkin Elmer) or ECL Prime (GE Healthcare).
Flow cytometry
The cells were collected and washed with 1x PBS. After the supernatant was removed, 5 mL of ice-cold 100% methanol was added drop wise with gentle vortexing. Tubes were then placed at −20ºC for 10 min followed by centrifugation at 2000 x g for 5 min. The supernatant was removed and the cell pellets were washed with 5 mL 1x PBS and centrifuged again at 2000 x g for 5 min. Cell pellets were then stored at 4ºC overnight.
To detect S-phase cells, EdU (50 μM) was added 30 min prior to collection. EdU was detected by Click-iT chemistry, according to the manufacturer’s instructions (Thermo Fisher). Cells were resuspended in 250 µL of Click-iT reaction cocktail and incubated for 30 min at RT protected from light. 5 mL of 1% BSA-PBST was then added and samples were spun down at 1000 x g for 5 min and the supernatant removed. The cells were then resuspended in 650 µL of fresh DAPI Staining Solution (0.1% Triton X-100, 0.1 mg/mL RNase, 1 µg/mL DAPI diluted in 1x PBS). The samples were spun at 50 x g for 30 s to remove cell clumps and debris through filter-capped tubes (Corning) and run on a BD LSR II Flow Cytometer in the Microscopy and Flow Cytometry Facility at the University of South Carolina, College of Pharmacy. At least 10,000 cells were analyzed per experiment.
DNA combing
Cells were labeled with IdU (50 μM) for 30 min, washed three times with 1x PBS and then labeled with CldU (100 μM) for 30 min. Cells were then collected, washed once with 1x PBS and diluted to ~3,300/μl. Agarose plugs were then made and prepared for DNA combing, as previously described [Citation40]. DNA fibers were combed on silanized coverslips according to the manufacturer’s instructions (Genomic Vision). Coverslips were then baked at 80°C for 2 h, washed once with 1x PBS and denatured with 0.5 M NaOH/1 M NaCl for 8 min. Following two 1x PBS washes, the coverslips were blocked in 3% BSA/1x PBS for 30 min followed by incubation with two α-BrdU antibodies (Accurate Chemical [OBT0030] and BD [347,580]) (1:100), each with specificity to either IdU or CldU, for 2 h at 37°C. After three PBST washes, goat α-mouse AlexaFluor 594 and goat α-rat AlexaFluor 488 (1:500) secondary antibodies were incubated on the coverslips for 1 h at 37°C. Coverslips were washed three times with 1x PBST, dehydrated and mounted on slides with mounting media. Images were then taken under a 40x objective on an EVOS epifluorescence microscope (Thermo) and scored using ImageJ.
Immunofluorescence (IF) and IF-fluorescence in situ hybridization (IF-FISH)
Cells were plated onto coverslips and allowed to grow for 24 hours to 50–70% confluency. 50 µM EdU was added for 30 min prior to collection. For detection of phosphorylated H2AX S140 (γH2AX), Histone H3 S10, and RPA32 S33, cells were fixed with 4% formaldehyde in 1x PBS for 10 min at RT. After formaldehyde incubation, cells were rinsed twice with 1x PBS and then permeabilized with 0.5% Triton X-100 diluted in 1 x PBS for 10 min at RT. Slides were washed with 1 x PBS then stored 4°C overnight in 1x PBS. For detection of chromatin-bound RPA32, cells were pre-extracted with 0.1% Triton X-100 in 1x CSK buffer (10 mM HEPES pH 7.4, 300 mM Sucrose, 100 mM NaCl, 3 mM MgCl2) for 5 min at room temperature. Slides were then washed once with 1 x PBS and fixed by adding 100% ice cold methanol. Slides were incubated at −20°C for 10 min, washed with 1x PBS and stored at 4°C overnight in 1x PBS. IF was then performed as previous described for γH2AX (1:5000), phosphorylated Histone H3 S10 (1:500), phosphorylated RPA32 S33 (1:1000) or RPA32 (1:500) [Citation30]. Nuclear signal intensity of γH2AX was measured in ImageJ as previously described [Citation30].
For IF-FISH, IF was performed for chromatin-bound RPA32, as described above. Telomere FISH was then performed, as previously described [Citation41]. Briefly, after the last wash, following secondary antibody incubation, the coverslips were fixed with 2% formaldehyde in 1x PBS for 10 min at RT. After two washes with 1x PBS, the coverslips were dehydrated and incubated with a telomeric G-strand PNA probe (AlexaFluor 488-TTAGGG3; PNA Bio) in hybridization buffer (10 mM Tris pH 7.4, 70% formamide, 1% blocking reagent [Roche]) for 10 min at 80°C. Coverslips were then incubated at RT for 2–3 h followed by two washes in wash buffer (10 mM Tris pH 7.4, 70% formamide) for 15 min each. The coverslips were subsequently washed three times with 1x PBS, dehydrated and mounted on slides with mounting media containing 0.2 μg/ml DAPI. IF and IF-FISH images were then taken under 40x or 60x objectives on an EVOS epifluorescence microscope (Thermo). Foci and co-localizing foci were scored using ImageJ.
Antibodies and chemical inhibitors
Primary: CTC1 [Citation37], STN1 (Abcam, 119,263), Actinin (Santa Cruz, sc17829), α-Tubulin (Sigma, T-9026), ATM (Cell Signaling 2837), ATR (Cell Signaling 13934S), pATR T1989 (Cell Signaling 30632S), CHK1 (Bethyl, A300-298A), pCHK1 S317 (Bethyl, A304-673A), pCHK1 S345 (Cell Signaling, 2348 T), p53 (Cell Signaling, 9282), p-p53 S15 (Cell Signlaing, 9286), p21 (Santa Cruz, sc-6246), H3 (Cell Signaling, 9715), pH3 S10 (Cell Signaling, 9706), Rad9 (Santa Cruz, sc-74,464), RPA32 (Abcam, ab16850), pRPA32 S33 (Bethyl, A300-246A), TopBP1 (Bethyl, A300-111A), ETAA1 (kindly provided by Dr. David Cortez), γH2AX (Bethyl, A300-081A) and POT1 (Abcam, ab124784). Secondary: Thermo: anti-rabbit-HRP (32,460); anti-mouse-HRP (32,430); Molecular Probes: goat-anti-rabbit AlexaFluor 647 (A21244), goat-anti-mouse AlexaFluor 647 (A21235), goat-anti-mouse AlexaFluor 594 (A11032), goat-anti-rabbit AlexaFluor 594 (A11037). ATR inhibitor: VE-821 5 µM for 24 h (Selleckchem, S8007).
Results
CTC1 deletion induces G2 arrest and apoptosis but does not alter S-phase progression
To more precisely examine the effects of conditional CTC1 KO, we performed time course analysis of the cell cycle in HCT116 conditional CTC1 knockout (CTC1−/-) cells. This cell line was previously generated by the addition of loxP sites surrounding exon 5 of both endogenous CTC1 alleles (CTC1F/F) [Citation37]. Cells were then stably selected for expression of a Cre recombinase linked to the estrogen receptor (Cre-ER). Addition of tamoxifen (TAM) results in localization of Cre-ER to the nucleus and removal of exon 5 by Cre-induced recombination. Gene disruption was confirmed by Western blot and PCR analysis following the addition of TAM, as previously described ( and S1A) [Citation37]. To control for possible off-target effects, a stable cell line was developed, expressing Flag-CTC1 in the CTC1F/F line (CTC1F/F+ Flag-CTC1) [Citation37]. Following the addition of TAM (CTC1−/-+Flag-CTC1), the endogenous CTC1 is disrupted, while the exogenous Flag-CTC1 expression remains unchanged ( and S1A).
Figure 1. CTC1 deletion results in a partial G2 arrest but not altered global replication. (a) Western blot of CTC1 knockout in HCT116 cells. Tamoxifen (TAM) was added to CTC1F/F and CTC1F/F+ Flag-CTC1 cell lines at day 0 to disrupt CTC1 (CTC1−/-). Representative gel showing days 8, 11 and 13. Actinin and Ponceau S staining are used as loading controls. (b) Representative growth curve of three independent, biological replicates. (c-d) Flow cytometry analysis of HCT116 CTC1F/F, CTC1−/-, and CTC1−/- +Flag-CTC1 cells. (c) Percentage of cells in each cell cycle phase, as indicated. (n = 3 independent, biological replicates) (d) Representative histograms from flow cytometry analysis. Left panel: DNA content (DAPI) versus cell count. Right panel: DNA content versus replicating cells (EdU+). (e-f) DNA combing analysis, as indicated. Cells were collected and processed 11 days after TAM addition. (n = 2 independent, biological replicates) (e) Dot plot of track length for elongating forks (Red-Green). Black line and numbers below the graph indicate the mean length in arbitrary units (AU). n indicates the number of total tracks scored. (f) Percentage of different replication events. Red-only: stalls or terminations, Green-only: origins fired during second label (CldU), Red-Green: elongating forks, G-R-G (Green-Red-Green): origins fired in first label (IdU), R-G-R (Red-Green-Red): terminations. Number of events scored: CTC1F/F: 451, CTC1−/-: 393, CTC1−/-+Flag-CTC1: 572. (e) Mitotic index is based on the levels of phosphorylated Histone H3 as measured by immunofluorescence. (n = 3 independent, biological replicates) Error bars indicate ±SEM. P-values were calculated by a one-way ANOVA test (*P ≤ 0.05, **P ≤ 0.01, ***P ≤ 0.001, ****P ≤ 0.0001)
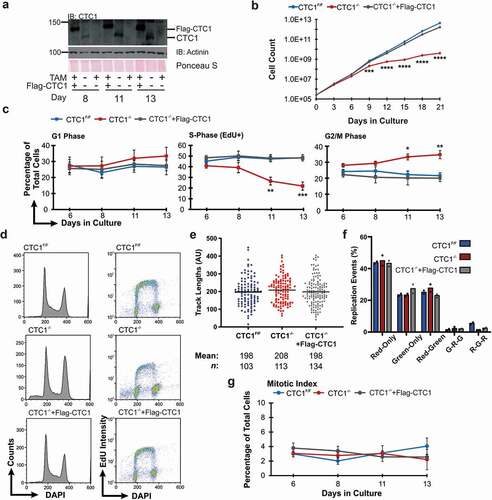
Previous studies found that CTC1 deletion lead to decreased proliferation and an accumulation of G2/M arrested cells [Citation35,Citation37]. In agreement with these studies, we observed decreased cell proliferation and the accumulation of G2/M cells starting around six days after conditional CTC1 deletion, which became more severe 10–12 days (). In addition to its role in telomere replication, CST aids in several aspects of genome-wide replication, including replication of G-rich DNA, dormant origin activation following replication stress and origin licensing [Citation30,Citation33,Citation34,Citation42]. Since past studies focused on telomere and not genome-wide replication, we tested whether CTC1 deletion affected global replication rates. To test this, we examined the levels of DNA synthesis in CTC1−/- cells by flow cytometry and DNA combing. Flow cytometry revealed a significant decrease in the number of S-phase cells following CTC1 deletion (). However, the cells within S-phase retained similar levels of DNA synthesis (i.e. EdU intensity per cell) compared to controls (). Additionally, the number of S-phase EdU negative cells was not substantially increased (Figure S1B), suggesting that global replication is not inhibited in the CTC1−/- cells under normal conditions. To confirm this result, we performed DNA fiber analysis on day 11 after TAM addition ( and S1C). Again, we failed to detect any significant changes in DNA synthesis or replication events following CTC1 deletion. These findings indicate that S-phase progression and global DNA synthesis are not significantly altered following CTC1 removal, which is in line with the idea that CST acts as a specialized, not general, replication factor to promote replication at G-rich DNA or dormant origin activation following replication stress [Citation33,Citation34].
Since CTC1 deletion induces the accumulation of G2/M phase cells, we sought to distinguish between G2 versus M-phase. Accordingly, IF was performed to assess the number of phosphorylated Histone H3 S10 positive cells, as a readout of the mitotic index () [Citation43]. The percentage of mitotic cells was not increased in the CTC1−/- cells compared to controls, indicating that CTC1 deletion causes an accumulation of G2 rather than M-phase cells. In addition, we observed an increase in the sub-G1 population (), which could arise from increased apoptosis. Indeed, we found that CTC1 deletion led to increased apoptosis, as measured by increased caspase 3/7 activity (Figure S1D). Conditional CTC1 deletion also leads to increased senescence in human and mouse cells, suggesting that both apoptosis and senescence contribute to overall growth inhibition in CTC1−/- cells [Citation35,Citation37,Citation44].
CTC1 KO does not induce global ATR-CHK1 signaling
Since CTC1 deletion leads to an increased number of G2 arrested cells, we next wanted to determine the cause of this arrest. Previous work determined that loss of CTC1 increases G-overhang length, leading to RPA binding and presumably activation of the DDR through ATR-CHK1 [Citation37]. Nevertheless, whether the ATR-CHK1 pathway is activated following CTC1 deletion was not directly tested. Following the accumulation of RPA-ssDNA, ATR should be recruited leading to the phosphorylation of several downstream ATR targets, including H2AX, CHK1 and p53. As a readout of ATR activation, we measured the phosphorylation of CHK1 (pCHK1) S317 and S345, and p53 S15 (p-p53 S15) in whole cell lysates collected at days 8, 11 and 13 after TAM addition ( and S2). Additionally, global γH2AX levels were measured by IF (). However, CTC1 KO did not result in detectable pCHK1 S317/S345 or p-p53 S15, suggesting that the ATR-CHK1 pathway is not globally activated in CTC1−/- cells under these conditions. Total γH2AX levels were also not increased, implying that cells do not contain high levels of DNA damage signaling. Interestingly, while p53 S15 phosphorylation was not observed, total p53 levels were increased in the CTC1−/- cells, suggesting activation of a DDR (). In agreement with p53 activation, p21 levels also increased starting at eight days after TAM addition (), which corresponds to the partial G2 arrest and growth inhibition in the CTC1−/- cells (). Finally, CTC1−/- cells were treated with siRNA to p53 to determine whether the G2 arrest was p53-dependent (). However, p53 knockdown did not suppress the accumulation of G2 cells following CTC1 deletion, suggesting that p53-independent mechanisms also promote G2 arrest following CTC1 deletion ().
Figure 2. CTC1 deletion increases p53/p21 but not ATR-mediated CHK1 phosphorylation. (a) Levels of phosphorylated p53 S15 (p-p53 S15) or CHK1 S317 (pCHK1 S317) and total p53 or CHK1 , as indicated. (b) Left: Representative images of γH2AX levels at 13 days after addition of TAM. DAPI: blue, γH2AX: red. Right: Dot plots of mean γH2AX intensity per nucleus in arbitrary fluorescent units (AFU). Black line and numbers below the graph indicate the mean AFU and number of nuclei scored (n). 24 h HU sample serves as a positive control for γH2AX. (n = 3 three independent, biological experiments) (c) Levels of p21, as indicated. (d-e) Cells were treated with siRNA to a non-targeting control (siNT) or p53 (sip53) for 72 hours prior to collection starting on day 8 after TAM addition. (d) Levels of p53 following siRNA knockdown, as indicated. * indicates nonspecific band. (e) Percentage of G2/M cells following siRNA knockdown of p53 (n = 3 independent, biological replicates). For Western blots, Actinin and Ponceau S staining serve as loading controls. 24 h HU indicates CTC1F/F cells treated for 24 h with 2 mM HU and were used as a control for activation of the DDR. Error bars indicate the ±SEM. P-values were calculated by an unpaired, two tailed Mann-Whitney test in (b) and an unpaired, two tailed t test in (e) (*P ≤ 0.05, **P ≤ 0.01, ****P ≤ 0.0001)
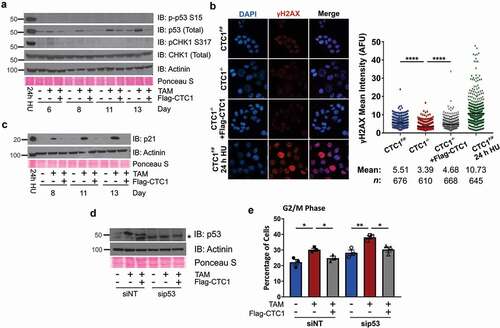
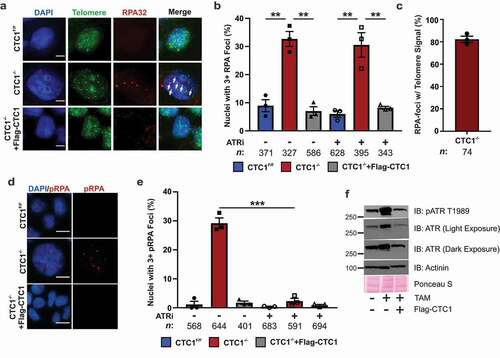
Figure 3. Telomeric phosphorylated RPA levels increase in response to CTC1 KO and are ATR-dependent. (a) Representative images of RPA foci and telomere FISH signal on day 13 after TAM addition. Cells were pre-extracted prior to fixation to identify chromatin-bound RPA. DAPI: blue, RPA32: red, Telomere (TTAGGG3): green. Scale bar represents 5 µm. (b) Percentage of nuclei with three or more RPA foci. (n = 3 independent, biological replicates.) (c) Percentage of RPA-foci containing telomere signal in CTC1−/- cells. (n = 3 independent, biological replicates.) (d) Representative images of phosphorylated RPA32 S33 (pRPA) foci on day 13 after TAM addition, as indicated. Scale bar represents 25 µm. (e) Percentage of cells with greater than three pRPA foci. (n = 3 independent biological replicates). (f) Levels of total and phosphorylated ATR T1989 (pATR) on day 13 after TAM addition, as indicated. ATRi: treatment with the ATR inhibitor VE-821 for 24 h. n indicates the number of total nuclei scored. Error bars indicate the ±SEM. P-values were calculated by an unpaired, two tailed t test (**P ≤ 0.01, ***P ≤ 0.001)
ATR is activated and phosphorylates telomere-bound RPA in CTC1−/- cells
As mentioned previously, CTC1 KO leads to telomeric RPA and γH2AX staining on metaphase chromosomes [Citation37]. Under normal conditions, excess RPA-ssDNA should lead to ATR activation and CHK1 phosphorylation. Since pCHK1 was not detected following CTC1 deletion, we determined whether ATR was active and localized to RPA-bound telomeres. First, we confirmed that RPA-ssDNA was present at telomeres following CTC1 deletion by IF combined with fluorescence in situ hybridization (IF-FISH) to measure chromatin-bound RPA at telomeres. In agreement with previous findings, RPA foci were increased in interphase CTC1−/- cells and these foci were almost exclusively at telomeres (~80%) () [Citation37]. Interestingly, increased RPA foci typically corresponded to enlarged nuclei in CTC1−/- cells (Figure S3A). The increased levels of chromatin-bound RPA in the CTC1−/- cells was also confirmed by flow cytometry of pre-extracted cells (Figure S3B-C).
Recruitment of ATRIP-ATR to RPA-ssDNA typically leads to ATR-dependent phosphorylation of RPA32 S33 (pRPA) [Citation45]. Since pCHK1 was not detected in cell extracts but RPA was increased at telomeres, pRPA was measured as a readout of ATR activation (). Similar to total chromatin-bound RPA, we observed a significant increase in pRPA. This suggested that, although pCHK1 is not present in CTC1−/- cells, ATR is active and present at telomeres. To confirm this, CTC1−/- and control cells were treated with the ATR inhibitor (ATRi) VE-821 for 24 hours and the number of pRPA and RPA foci were determine (, e). Treatment with ATRi suppressed the pRPA foci in CTC1−/- cells. However, total RPA foci remained unchanged, indicating that the phosphorylation of RPA in the CTC1−/- cells is ATR-dependent. A previous study also found telomeric γH2AX in CTC1−/- cells on metaphase spreads [Citation37]. In agreement with this study, we found that RPA-foci co-localized with γH2AX in interphase CTC1−/- cells (Figure S4). Nevertheless, these foci were difficult to distinguish from background γH2AX foci in the control cells without RPA staining, which likely precluded their detection in the global γH2AX analysis in . To more directly test ATR activation, Western blot analysis was performed to measure the levels of autophosphorylated ATR at T1989 (pATR). In contrast to pCHK1, pATR was significantly increased in CTC1−/- cells (). Additionally, there was an overall increase in total ATR levels, which suggest that CTC1 deletion may alter ATR gene expression. Together, these results indicate that ATR localizes to telomeric RPA-ssDNA and is activated in CTC1−/- cells. However, ATR activation is insufficient to induce detectable levels of pCHK1 S317/S345 or p-p53 S15 in the absence of CTC1 ().
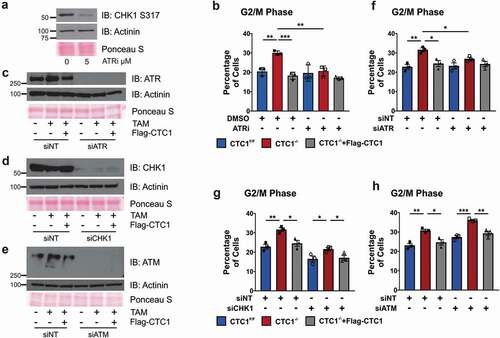
Figure 4. G2 arrest following CTC1 KO is ATR-dependent. (a) Western blot analysis of CTC1F/F cells treated with 5 µM ATRi (VE-821) for 24 h to confirm ATR inhibition. 2 mM HU was added 2 h prior to collection to induce CHK1 S317 phosphorylation. (b) Graph of the percentage of G2/M cells at 13 day after TAM addition with DMSO or ATRi treatment for 24 h. (n = 3 independent, biological replicates) (c-h) Cells were treated with siRNA for 72 hours prior to collection, starting on day 8 after TAM addition. (c-e) Analysis of siRNA knockdown of ATR (c), CHK1 (d) or ATM (e). siNT: non-target control. Actinin and Ponceau S staining serve as loading controls. (f-h) Graphs of the percentage of G2/M cells following siRNA knockdown of ATR (f), CHK1 (g) or ATM (h) (n = 3 independent, biological replicates). Error bars indicate the ±SEM. (*P ≤ 0.05, **P ≤ 0.01, ***P ≤ 0.001)
ATR, but not ATM or CHK1, promotes G2 arrest in CTC1 deleted cells
To assess whether ATR activation contributes to the accumulation of G2 arrested cells following CTC1 KO, we performed flow cytometry on cells treated with ATRi for 24 h or siRNA to ATR (, S5 and S6). ATR inhibition or knockdown prevented the accumulation of G2/M cells following CTC1 deletion. ATR inhibition also resulted in increased apoptosis in CTC1−/- cells, as measured by caspase 3/7 activity (Figure S1D). As a control, cells were also treated with siRNA to ATM or CHK1 to confirm that the increased number of G2 cells were ATR-dependent (). Unlike knockdown of ATR, depletion of ATM was unable to suppress the increase in G2 arrested cells following CTC1 deletion. Depletion of CHK1 was also unable to suppress the increase in G2 cells. However, these results are somewhat complicated by the fact that CHK1 knockdown leads to an overall increase in G1 and decrease in G2/M phase cells across all cell lines (Figure S5 and S6). Despite alterations in the cell cycle, comparison of the fold increase in G2/M cells between CTC1−/- and control cells was similar following treatment with siNT (CTC1−/-/CTC1F/F/:1.39, CTC1−/-/CTC1−/-+Flag-CTC1:1.29) and siCHK1 (CTC1−/-/CTC1F/F:1.30, CTC1−/-/CTC1−/-+Flag-CTC1:1.26) (see Figure S6). Still, our results do not exclude the possibility that CHK1 may be partially responsible for the G2 arrest. Together, these results indicate that the accumulation of G2 arrested cells following CTC1 KO is ATR-dependent.
CTC1 KO leads to decreased levels of TopBP1
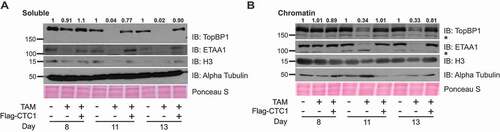
To fully activate ATR in response to ssDNA, TopBP1 is recruited. Since this step is independent of ATRIP-ATR binding, we examined whether defects in TopBP1 recruitment and protein expression could explain why CHK1 is not phosphorylated despite significant levels of RPA-ssDNA and ATR activation after CTC1 deletion (). TopBP1 protein levels were measured at days 8, 11 and 13 following TAM addition ( and S7A). Surprisingly, we observed a decrease in TopBP1 following conditional CTC1 KO starting at day 11 after TAM addition. These findings are significant as the timing of TopBP1 decline corresponds to the increase in RPA-ssDNA and accumulation of G2 cells following CTC1 removal. This suggested that ATR-mediated CHK1 signaling could be defective due to decreased cellular and chromatin-bound TopBP1. We also examined the levels of the other major ATR activator ETAA1 and found that it was also decreased in the CTC1−/- cells ( and S7A). Since ETAA1 appears to play a minor role in ATR-mediated CHK1 activation following DNA damage, it is unclear how this might affect checkpoint signaling. However, it is possible that decreased ETAA1 could contribute to changes in cell cycle progression. We next examined whether decreased TopBP1 was due to changes in gene expression. We performed qPCR to measure TopBP1 mRNA levels but did not observe any significant changes at day 8 and only minor changes at days 11 and 13 that were not statically significant, suggesting that decreased protein stability and not gene expression is likely responsible for the observed changes in TopBP1 levels (Figure S7B).
Figure 5. CTC1 deletion leads to decreased TopBP1. Western blots of soluble (a) and chromatin (b) fractions at days 8, 11, and 13, as indicated. Ponceau S serves as a loading control for total protein. α-Tubulin and H3 serve as controls for the soluble and chromatin extracts, respectively. Quantification of TopBP1 signal intensity is indicated above the image. α-Tubulin and H3 were used to normalize the TopBP1 signal in the soluble and chromatin fractions, respectively. * indicates nonspecific bands
CTC1 promotes ATR-mediated CHK1 signaling following exogenous replication stress
Since TopBP1 is important for ATR-CHK1 activation, we hypothesized that CST promotes CHK1 phosphorylation in the presence of exogenous replication stress by stabilizing TopBP1. This would be consistent with previous findings demonstrating that shRNA depletion of TopBP1 reduces pCHK1 S317/S345 following replication stress [Citation46]. To test our hypothesis, we measured CHK1 phosphorylation in cells following treatment with hydroxyurea (HU), which is known to induce global replication fork stalling, create excess ssDNA and activate the ATR-CHK1 pathway [Citation47]. Cells were treated with HU for 2 h before collection to generate ssDNA but not cause fork collapse and DSBs [Citation48]. Phosphorylation of CHK1 and γH2AX staining were then assessed by Western blot and IF, respectively (). In line with our hypothesis, we observed a decrease in the levels of pCHK1 S317/S345 and γH2AX in CTC1 deleted cells compared to controls.
Figure 6. CTC1 promotes ATR-CHK1 signaling following HU treatment. (a-b) Western blots of pCHK1 S317 (a) or pCHK1 S345 (b) from whole cell lysates after treatment with 2 mM HU for 2 h, as indicated. Quantification of pCHK1 signal intensity is indicated above the gel. Total CHK1 levels were used to normalize the pCHK1 signal. (c) Cells were treated with 2 mM HU for 24 hours at 13 days after TAM addition, as indicated. Left: Representative images of γH2AX signal. DAPI: blue, γH2AX: red. Right: Dot plots of mean γH2AX intensity per nucleus in arbitrary fluorescent units (AFU). Black line and numbers below the graph indicate the mean AFU (n = 3 independent, biological replicates). P-values were calculated by an unpaired, two-tailed Mann-Whitney test (****P ≤ 0.0001). (d) Cells were transfected with pcDNA3-TopBP1 on day 8 and then collected on day 11. Western blot analysis of TopBP1 and pCHK1 S317 in whole cell lysates. For HU treated samples, cells were treated with 2 mM HU for 2 h just prior to collection. 24 h HU indicates CTC1F/F cells treated for 24 h with 2 mM HU and were used as a positive control for pCHK1. Total CHK1, Actinin and Ponceau S serve as loading controls. (e) Model of CTC1 function in ATR-CHK1 activation following fork stalling. Following RPA binding, ATRIP-ATR and the 9-1-1 complex are recruited to the ssDNA damage. In the presence of CTC1 (CTC1F/F), TopBP1 is then recruited for ATR-CHK1 activation and G2 arrest (left). However, when CTC1 is absent (CTC1−/-), TopBP1 is destabilized leading to the inhibition of CHK1 phosphorylation (right)
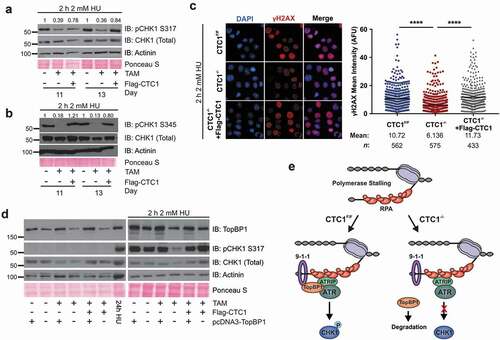
To see whether we could rescue pCHK1 levels, Flag-tagged TopBP1 was exogenously expressed in CTC1−/- and control cell lines at day 8 after TAM addition. At day 11, cells were treated with HU for 2 h and then collected for Western blot analysis. Transfection with exogenous TopBP1 resulted in similar levels of TopBP1 in the CTC1F/F, CTC1−/- and CTC1−/-+Flag-CTC1 cells (). pCHK1 S317 was then measured as a readout of ATR-dependent CHK1 activation (). While CHK1 phosphorylation was inhibited in the CTC1−/- cells, we found that expression of exogenous TopBP1 rescued CHK1 phosphorylation in response to HU treatment. A possible explanation for the decreased pCHK1 is that it arises from the lower number of S-phase cells following CTC1 KO (). To exclude this possibility, we determined the number of S-phase cells with and without expression of Flag-TopBP1 (Figure S8). In both cases, the number of S-phase cells is decreased in CTC1−/- cells, however, pCHK1 S317 is rescued with TopBP1 expression after HU treatment. These findings strongly suggest that the lower level of S-phase cells do not account for the decreased levels of pCHK1 observed in the CTC1−/- cells after HU treatment. Interestingly, while addback of TopBP1 rescued pCHK1 following replication stress, it did not rescue global pCHK1 in CTC1−/- cells in the absence of HU treatment. Thus, restoration of TopBP1 levels alone is not sufficient to rescue ATR-CHK1 signaling arising from telomere-bound RPA and additional factors likely contribute to the telomere DNA damage response in the absence of CST. Overall, these results indicate that CTC1 regulates TopBP1 and is required to fully activate the ATR-CHK1 pathway in response to genome-wide replication stress (). These results could in part explain how CST promotes recovery from replication stress.
Discussion
In this study, we sought to address the underlying cause(s) of decreased cell proliferation and cell cycle arrest associated with CTC1 removal. In agreement with previous studies, we find that conditional deletion of CTC1 leads to a partial G2 arrest, which is primarily caused by telomeric RPA-ssDNA [Citation35,Citation37]. Unexpectedly, we found that, while ATR is actively recruited to telomeric RPA-ssDNA, loss of CTC1 prevents global CHK1 phosphorylation. Upon further analysis, we discovered that CST regulates the ATR activator TopBP1 and that removal of CTC1 leads to a substantial decrease in CHK1 phosphorylation following global replication stress. Together, these findings highlight an unanticipated function of human CST in maintaining genome stability through the regulation of CHK1 phosphorylation.
Our results combined with previous findings indicate that CST plays multiple functions in the DDR at telomeres. First, it prevents ATR-mediated checkpoint activation by inhibiting telomerase from hyperextending G-overhangs, leading to RPA-ssDNA [Citation28,Citation37] (this study). Second, it promotes ATR-CHK1 signaling once telomeres are bound by RPA. Despite significant ATR activity at RPA-bound telomeres in CTC1−/- cells, our results suggest that this is insufficient to induce global CHK1 phosphorylation (). While it is possible that low levels of pCHK1 are present at telomeres but not detectable by Western blot, this seems unlikely, as a significant portion of the CTC1−/- cells (~25%) contain three or more large RPA foci and ATR is clearly activated (). Furthermore, attempts to detect pCHK1 at telomeres were unsuccessful. Previous work also found that replication fork stalling at a single defined repeat sequence is sufficient to induce detectable ATR-dependent CHK1 phosphorylation [Citation49]. Thus, the significant levels of RPA-ssDNA from elongated G-overhangs in CTC1−/- cells should induce CHK1 phosphorylation, as previously observed following POT1 deletion in mice and chicken cells [Citation50,Citation51]. Why CHK1 is not activated in CTC1−/- cells is unclear. Yet, unlike with HU-induced fork stalling, it is not solely based on decreased levels of TopBP1 (). A recent study in mouse cells showed that CST is required to override POT1b-mediated telomere protection in S/G2, suggesting that CST may activate ATR-CHK1 signaling at telomeres in mice [Citation52]. In a similar vein, we propose that CST could both stabilize TopBP1 and be necessary to override telomere protection pathways to induce “repair” or shortening of the G-overhang. It is also possible that hyperextension of the G-overhang activates protection mechanisms that lead to TopBP1 degradation as a means to prevent recognition of the RPA-coated G-overhangs as recombination intermediates. Despite the lack of pCHK1, ATR activation from telomere RPA-ssDNA is sufficient to induce cell cycle arrest, suggesting an alternate ATR pathway is activated. Determining whether or not these extended G-overhangs are recognized as DDR and then repaired or shortened, what DDR pathway is activated and the interplay between POT1 and CST in ATR regulation will require further investigation. However, our work provides novel insight into ATR-CHK1 signaling at telomeres.
In regard to genome-wide ATR activation following replication stress, our results determined that regulation of TopBP1 by CST contributes to ATR-CHK1 signaling. While ATR was active at telomeres (i.e. pRPA), ATR-CHK1 signaling was compromised due to decreased TopBP1 levels, short-circuiting TopBP1-dependent ATR activation (). TopBP1 is integral to both checkpoint activation and DNA replication origin firing [Citation53], so why is DNA replication and origin firing not inhibited in these cells? We propose that it is due to the decreased but not complete absence of TopBP1 ( and S7). In this case, while there is enough TopBP1 for origin activation, these levels are insufficient to fully activate ATR-mediated CHK1 signaling. This suggests that it may be possible to separate TopBP1 functions through regulating its protein expression. The low levels of TopBP1would also explain why pCHK1 levels are decreased but not absent following global fork stalling in the CTC1−/- cells. Furthermore, this implies that TopBP1 is regulated through multiple pathways.
While the mechanism of ATR activation by TopBP1 has been closely examined, how TopBP1 levels are regulated remains poorly understood. Previous work has shown that TopBP1 is post-transcriptionally regulated by two E3 ubiquitin ligases, UBR5 (also known as EED1 and hHYD) and HUWE1 (also known as HECTH9 and MULE) [Citation54–56]. Interestingly, TopBP1 when not chromatin associated is targeted for degradation by the ubiquitin ligase, HUWE1 [Citation54]. This protection is at least partly facilitated by the transcriptional repressor Miz1. In a similar manner, CST could stabilize TopBP1 by recruiting it to the chromatin. As to the mechanism of CST recruitment to stalled forks, we recently showed that CST interacts with the MCM2-7 helicase [Citation30]. Thus, CST could be recruited to stalled forks by MCM2-7 and then recruit TopBP1 to prevent degradation, stimulating ATR-mediated CHK1 phosphorylation. Whether CST directly or indirectly stabilizes TopBP1 will require further studies.
In addition to TopBP1, ATR can also be activated by ETAA1. However, several studies suggest that TopBP1 is the dominant pathway for ATR-CHK1 activation following replication stress [Citation10,Citation57]. Recent work from the Cortez lab showed that, in HCT116 cells, deletion of the AAD of ETAA1 did not inhibit ATR activation. Yet, attempts to delete the AAD of TopBP1 resulted in cell death, indicating that, at least in HCT116 cells, TopBP1 is the major activator of ATR [Citation14]. Accordingly, it is unlikely that ETAA1 could compensate for decreased TopBP1. In addition, we find that ETAA1 levels are also decreased after CTC1 KO, suggesting this potential secondary pathway is not even available for ATR-mediated CHK1 activation (). Why ETAA1 levels are decreased following CTC1 deletion is unclear. However, it is possible that TopBP1 and ETAA1 are regulated through similar mechanisms.
In summary, our studies establish CTC1 as a regulator of ATR-CHK1 signaling at telomeres and in response to global replication stress. These findings may be relevant for the use of cell cycle checkpoint inhibitors for cancer therapy. Several of these inhibitors are currently in clinical trials [Citation58,Citation59]. Moreover, polymorphisms in CST are associated with an increased risk of developing several cancers [Citation60–66]. Thus, it will be interesting to test whether these polymorphisms affect ATR-CHK1 signaling in specific cancer types and sensitize cancer cells to treatment with cell cycle checkpoint inhibitors.
Supplemental Material
Download PDF (1.2 MB)Acknowledgments
We would like to thank Sasha Hodge, Kaury Thome and Alexander Welch for assistance with experiments. Drs. Alan Waldman, Michael Wyatt and Douglas Pittman and members of the Stewart lab for useful discussions and critical reading of the manuscript. We would also like to thank Dr. David Cortez for providing the ETAA1 antibody, Dr. Weei-Chen Lin for the pcDNA3-TopBP1 and Dr. Carolyn Price for the HCT116 CTC1F/F cell lines and critical reading of the manuscript. This study utilized the services of the Flow Cytometry Core Facility of the COBRE Center for Targeted Therapeutics at the University of South Carolina with assistance from Dr. Chang-uk Lim.
Disclosure statement
The authors declare that they have no conflict of interest with the contents of the article.
Supplementary material
Supplemental data for this article can be accessed here.
Additional information
Funding
References
- Blackford AN, Jackson SP. ATM, ATR, and DNA-PK: the Trinity at the heart of the DNA damage response. Mol Cell. 2017;66:801–817.
- Saldivar JC, Cortez D, Cimprich KA. The essential kinase ATR: ensuring faithful duplication of a challenging genome. Nat Rev Mol Cell Biol. 2017;18:622–636.
- Brown EJ, Baltimore D. ATR disruption leads to chromosomal fragmentation and early embryonic lethality. Genes Dev. 2000;14:397–402.
- de Klein A, Muijtjens M, van Os R, et al. Targeted disruption of the cell-cycle checkpoint gene ATR leads to early embryonic lethality in mice. Curr Biol. 2000;10:479–482.
- Byun TS, Pacek M, Yee MC, et al. Functional uncoupling of MCM helicase and DNA polymerase activities activates the ATR-dependent checkpoint. Genes Dev. 2005;19:1040–1052.
- Raderschall E, Golub EI, Haaf T. Nuclear foci of mammalian recombination proteins are located at single-stranded DNA regions formed after DNA damage. Proc Natl Acad Sci U S A. 1999;96:1921–1926.
- Chen R, Wold MS. Replication protein A: single-stranded DNA’s first responder: dynamic DNA-interactions allow replication protein A to direct single-strand DNA intermediates into different pathways for synthesis or repair. Bioessays. 2014;36:1156–1161.
- Zou L, Elledge SJ. Sensing DNA damage through ATRIP recognition of RPA-ssDNA complexes. Science. 2003;300:1542–1548.
- Lee YC, Zhou Q, Chen J, et al. RPA-binding protein ETAA1 is an ATR activator involved in DNA replication stress response. Curr Biol. 2016;26:3257–3268.
- Bass TE, Luzwick JW, Kavanaugh G, et al. ETAA1 acts at stalled replication forks to maintain genome integrity. Nat Cell Biol. 2016;18:1185–1195.
- Haahr P, Hoffmann S, Tollenaere MA, et al. Activation of the ATR kinase by the RPA-binding protein ETAA1. Nat Cell Biol. 2016;18:1196–1207.
- Kumagai A, Lee J, Yoo HY, et al. TopBP1 activates the ATR-ATRIP complex. Cell. 2006;124:943–955.
- Thada V, Cortez D. Common motifs in ETAA1 and TOPBP1 required for ATR kinase activation. J Biol Chem. 2019;294:8395–8402.
- Bass TE, Cortez D. Quantitative phosphoproteomics reveals mitotic function of the ATR activator ETAA1. J Cell Biol. 2019;218:1235–1249.
- Saldivar JC, Hamperl S, Bocek MJ, et al. An intrinsic S/G2 checkpoint enforced by ATR. Science. 2018;361:806–810.
- Delacroix S, Wagner JM, Kobayashi M, et al. The Rad9-Hus1-Rad1 (9-1-1) clamp activates checkpoint signaling via TopBP1. Genes Dev. 2007;21:1472–1477.
- Lee J, Kumagai A, Dunphy WG. The Rad9-Hus1-Rad1 checkpoint clamp regulates interaction of TopBP1 with ATR. J Biol Chem. 2007;282:28036–28044.
- Acevedo J, Yan S, Michael WM. Direct binding to replication protein A (RPA)-coated single-stranded DNA allows recruitment of the ATR activator TopBP1 to sites of DNA damage. J Biol Chem. 2016;291:13124–13131.
- Zhao H, Piwnica-Worms H. ATR-mediated checkpoint pathways regulate phosphorylation and activation of human Chk1. Mol Cell Biol. 2001;21:4129–4139.
- Liu Q, Guntuku S, Cui XS, et al. Chk1 is an essential kinase that is regulated by Atr and required for the G(2)/M DNA damage checkpoint. Genes Dev. 2000;14:1448–1459.
- Tibbetts RS, Brumbaugh KM, Williams JM, et al. A role for ATR in the DNA damage-induced phosphorylation of p53. Genes Dev. 1999;13:152–157.
- Sorensen CS, Syljuasen RG. Safeguarding genome integrity: the checkpoint kinases ATR, CHK1 and WEE1 restrain CDK activity during normal DNA replication. Nucleic Acids Res. 2012;40:477–486.
- Rundle S, Bradbury A, Drew Y, et al. Targeting the ATR-CHK1 axis in cancer therapy. Cancers (Basel). 2017;9:41–66.
- Bryan C, Rice C, Harkisheimer M, et al. Structure of the human telomeric Stn1-Ten1 capping complex. PLoS One. 2013;8:e66756.
- Lim CJ, Barbour AT, Zaug AJ, et al. The structure of human CST reveals a decameric assembly bound to telomeric DNA. Science. 2020;368:1081–1085.
- Hom RA, Wuttke DS. Human CST Prefers G-Rich but Not Necessarily Telomeric Sequences. Biochemistry. 2017;56:4210–4218.
- Bhattacharjee A, Wang Y, Diao J, et al. Dynamic DNA binding, junction recognition and G4 melting activity underlie the telomeric and genome-wide roles of human CST. Nucleic Acids Res. 2017;45:12311–12324.
- Chen LY, Redon S, Lingner J. The human CST complex is a terminator of telomerase activity. Nature. 2012;488:540–544.
- Bhattacharjee A, Stewart J, Chaiken M, et al. STN1 OB fold mutation alters DNA binding and affects selective aspects of CST function. PLoS Genet. 2016;12:e1006342.
- Wang Y, Brady KS, Caiello BP, et al. Human CST suppresses origin licensing and promotes AND-1/Ctf4 chromatin association. Life Sci Alliance. 2019;2:e201800270.
- Mirman Z, Lottersberger F, Takai H, et al. 53BP1-RIF1-shieldin counteracts DSB resection through CST- and Polalpha-dependent fill-in. Nature. 2018;560:112–116.
- Barazas M, Annunziato S, Pettitt SJ, et al. The CST complex mediates end protection at double-strand breaks and promotes PARP inhibitor sensitivity in BRCA1-deficient cells. Cell Rep. 2018;23:2107–2118.
- Chastain M, Zhou Q, Shiva O, et al. CST facilitates genome-wide RAD51 recruitment to GC-rich repetitive sequences in response to replication stress. Cell Rep. 2016;16:2048.
- Stewart JA, Wang F, Chaiken MF, et al. Human CST promotes telomere duplex replication and general replication restart after fork stalling. Embo J. 2012;31:3537–3549.
- Gu P, Min JN, Wang Y, et al. CTC1 deletion results in defective telomere replication, leading to catastrophic telomere loss and stem cell exhaustion. Embo J. 2012;31:2309–2321.
- Wang F, Stewart JA, Kasbek C, et al. Human CST has independent functions during telomere duplex replication and C-strand fill-in. Cell Rep. 2012;2:1096–1103.
- Feng X, Hsu SJ, Kasbek C, et al. CTC1-mediated C-strand fill-in is an essential step in telomere length maintenance. Nucleic Acids Res. 2017;45:4281–4293.
- Feng X, Hsu SJ, Bhattacharjee A, et al. CTC1-STN1 terminates telomerase while STN1-TEN1 enables C-strand synthesis during telomere replication in colon cancer cells. Nat Commun. 2018;9:2827.
- Liu K, Bellam N, Lin HY, et al. Regulation of p53 by TopBP1: a potential mechanism for p53 inactivation in cancer. Mol Cell Biol. 2009;29:2673–2693.
- Gali H, Mason-Osann E, Flynn RL. Direct visualization of DNA replication at telomeres using DNA fiber combing combined with telomere FISH. Methods Mol Biol. 2019;1999:319–325.
- Cesare AJ, Heaphy CM, O’Sullivan RJ. Visualization of telomere integrity and function in vitro and in vivo using immunofluorescence techniques. Curr Protoc Cytom. 2015;73:12 40 1–12 40 31.
- Zhang M, Wang B, Li T, et al. Mammalian CST averts replication failure by preventing G-quadruplex accumulation. Nucleic Acids Res. 2019;47:5243–5259.
- Hendzel MJ, Wei Y, Mancini MA, et al. Mitosis-specific phosphorylation of histone H3 initiates primarily within pericentromeric heterochromatin during G2 and spreads in an ordered fashion coincident with mitotic chromosome condensation. Chromosoma. 1997;106:348–360.
- Boccardi V, Razdan N, Kaplunov J, et al. Stn1 is critical for telomere maintenance and long-term viability of somatic human cells. Aging Cell. 2015;14:372–381.
- Marechal A, Zou L. RPA-coated single-stranded DNA as a platform for post-translational modifications in the DNA damage response. Cell Res. 2015;25:9–23.
- Liu S, Bekker-Jensen S, Mailand N, et al. Claspin operates downstream of TopBP1 to direct ATR signaling towards Chk1 activation. Mol Cell Biol. 2006;26:6056–6064.
- Cortez D. Preventing replication fork collapse to maintain genome integrity. DNA Repair (Amst). 2015;32:149–157.
- Petermann E, Orta ML, Issaeva N, et al. Hydroxyurea-stalled replication forks become progressively inactivated and require two different RAD51-mediated pathways for restart and repair. Mol Cell. 2010;37:492–502.
- Liu G, Myers S, Chen X, et al. Replication fork stalling and checkpoint activation by a PKD1 locus mirror repeat polypurine-polypyrimidine (Pu-Py) tract. J Biol Chem. 2012;287:33412–33423.
- Churikov D, Price CM. Pot1 and cell cycle progression cooperate in telomere length regulation. Nat Struct Mol Biol. 2008;15:79–84.
- Denchi EL, de Lange T. Protection of telomeres through independent control of ATM and ATR by TRF2 and POT1. Nature. 2007;448:1068–1071.
- Kratz K, de Lange T. Protection of telomeres 1 proteins POT1a and POT1b can repress ATR signaling by RPA exclusion, but binding to CST limits ATR repression by POT1b. J Biol Chem. 2018;293:14384–14392.
- Wardlaw CP, Carr AM, Oliver AW. TopBP1: A BRCT-scaffold protein functioning in multiple cellular pathways. DNA Repair (Amst). 2014;22:165–174.
- Herold S, Wanzel M, Beuger V, et al. Negative regulation of the mammalian UV response by Myc through association with Miz-1. Mol Cell. 2002;10:509–521.
- Honda Y, Tojo M, Matsuzaki K, et al. Cooperation of HECT-domain ubiquitin ligase hHYD and DNA topoisomerase II-binding protein for DNA damage response. J Biol Chem. 2002;277:3599–3605.
- Feng H, Lu J, Song X, et al. CK2 kinase-mediated PHF8 phosphorylation controls TopBP1 stability to regulate DNA replication. Nucleic Acids Res. 2020;48:10940-10952.
- Lyu K, Kumagai A, Dunphy WG. RPA-coated single-stranded DNA promotes the ETAA1-dependent activation of ATR. Cell Cycle. 2019;18:898–913.
- Bradbury A, Hall S, Curtin N, et al. Targeting ATR as cancer therapy: a new era for synthetic lethality and synergistic combinations? Pharmacol Ther. 2019;207:107450.
- Brown JS, O’Carrigan B, Jackson SP, et al. Targeting DNA repair in cancer: beyond PARP inhibitors. Cancer Discov. 2017;7:20–37.
- Walsh KM, Codd V, Rice T, et al. Longer genotypically-estimated leukocyte telomere length is associated with increased adult glioma risk. Oncotarget. 2015;6:42468–42477.
- Gudmundsson J, Thorleifsson G, Sigurdsson JK, et al. A genome-wide association study yields five novel thyroid cancer risk loci. Nat Commun. 2017;8:14517.
- Ojha J, Codd V, Nelson CP, et al. Genetic variation associated with longer telomere length increases risk of chronic lymphocytic leukemia. Cancer Epidemiol Biomarkers Prev. 2016;25:1043–1049.
- Phelan CM, Kuchenbaecker KB, Tyrer JP, et al. Identification of 12 new susceptibility loci for different histotypes of epithelial ovarian cancer. Nat Genet. 2017;49:680–691.
- Walsh KM, Whitehead TP, de Smith AJ, et al. Common genetic variants associated with telomere length confer risk for neuroblastoma and other childhood cancers. Carcinogenesis. 2016;37:576–582.
- Law MH, Bishop DT, Lee JE, et al. Genome-wide meta-analysis identifies five new susceptibility loci for cutaneous malignant melanoma. Nat Genet. 2015;47:987–995.
- Rode L, Nordestgaard BG, Bojesen SE. Long telomeres and cancer risk among 95 568 individuals from the general population. Int J Epidemiol. 2016;45:1634–1643.