
ABSTRACT
Circular RNAs (circRNAs) have been reported to be related to the development of human cancers. However, the function of circ-FOXM1 in non-small cell lung cancer (NSCLC) was largely unknown. Here, we revealed the role and functional mechanism of circ-FOXM1 in NSCLC progression. The relative expression of circ-FOXM1, microRNA-149-5p (miR-149-5p), and autophagy-related 5 (ATG5) was determined by quantitative real-time polymerase chain reaction (RT-qPCR). Cell Counting Kit-8 (CCK-8), flow cytometry, and transwell assay were employed to assess cell viability, apoptosis, and migration, respectively. The relative protein expression was detected by western blot. Furthermore, mouse xenograft was carried out to analyze the effect of circ-FOXM1 on tumor growth in vivo. In addition, the interaction between miR-149-5p and circ-FOXM1 or ATG5 was predicted by Starbase3.0 and confirmed by the dual-luciferase reporter assay and RNA pull-down assay. Circ-FOXM1 and ATG5 levels were upregulated, while the miR-149-5p level was downregulated in NSCLC tissues and cells. Circ-FOXM1 knockdown suppressed NSCLC cell viability, migration, and autophagy, and induced cell apoptosis. Interestingly, circ-FOXM1 targeted miR-149-5p to upregulate the ATG5 level. Moreover, circ-FOXM1 exerted function through repressing miR-149-5p expression, and miR-149-5p exerted function via inhibiting ATG5 expression. Our results suggested that circ-FOXM1 knockdown attenuated the development of NSCLC through modulating the miR-149-5p/ATG5 axis, providing a theoretical basis for the therapy of NSCLC.
Introduction
Lung cancer is one of the most common cancers and non-small cell lung cancer (NSCLC) accounts for approximately 85% of all lung cancer [Citation1,Citation2]. Despite the therapeutical methods including surgery and chemotherapy have achieved improvements, the prognosis of NSCLC patients is still poor due to the high recurrence and metastasis [Citation3,Citation4]. Therefore, it is urgent to analyze the mechanism of NSCLC development for the therapy of NSCLC patients.
Circular RNAs (circRNAs) are non-coding RNAs, which regulate a variety of cell progression in human cancers, such as cell proliferation, mobility, apoptosis, and autophagy [Citation5–7]. Nowadays, over 20,000 circRNAs were found in eukaryotes in 2014 [Citation8]. The present evidence demonstrated that circRNAs exerted pivotal functions in NSCLC development. For example, Lu et al. confirmed that circRNA HIPK3 promoted cell viability and repressed apoptosis through modulating miR-149 expression in NSCLC [Citation9]. Furthermore, circ-FOXM1 was reported to accelerate NSCLC development by targeting miR-1304-5p [Citation10]. However, the role and underlying mechanism of circ-FOXM1 in NSCLC need further exploration.
MicroRNAs (miRNAs), with about 18–25 nucleotides, exert function via inducing degradation or inhibiting translation of message RNA (mRNA) [Citation11]. Accumulating evidence showed that miRNAs regulated the development of various human cancers, including colon cancer [Citation12], gastric cancer [Citation13], hepatocellular carcinoma [Citation14], and NSCLC [Citation15]. Recent studies showed that miR-149-5p was downregulated in NSCLC tissues and cells [Citation16]. Furthermore, miR-149-5p inhibited cell growth and mobility and promoted apoptosis by inhibiting cyclin-dependent kinase 6 (CDK6) in NSCLC. These data indicated that miR-149-5p was an important regulator for the development of NSCLC. Therefore, the mechanism of miR-149-5p in NSCLC was explored in this study.
In this study, we analyzed circ-FOXM1, miR-149-5p, and ATG5 levels in NSCLC tissues and cells. Moreover, the regulatory mechanism of circ-FOXM1/miR-149-5p/ATG5 axis was investigated in NSCLC progression.
Materials and methods
Tissues and cell culture
NSCLC tissues and the adjacent normal tissues (N = 72) were obtained from patients at the hospital of West China Hospital, Sichuan University. The clinicopathologic features of these patients are presented in . Written informed consent was signed by each patient. This research was approved by the Ethics Review Committees of West China Hospital, Sichuan University.
Table 1. Correlation between circ-FOXM1 expression and the clinicopathologic features of NSCLC patients
Human bronchial epidermal cells (16HBE) were obtained from Biovector (Beijing, China). NSCLC cells (H1581 and A549) were provided by the American Type Culture Collection (ATCC, Manassas, VA, USA). All cells were cultured in Roswell Park Memorial Institute 1640 (RPMI-1640) medium (Invitrogen, Carlsbad, CA, USA) with 10% fetal bovine serum (FBS; Gibco, Grand Island, NY, USA) under 37°C and 5% CO2 condition.
Cell transfection
Small hairpin RNA (shRNA) against circ-FOXM1 (sh-circ-FOXM1) and the control sh-circ-NC, miR-149-5p mimic (miR-149-5p) and the negative control (miR-NC), miR-149-5p inhibitor (Anti-miR-149-5p) and the control (Anti-miR-NC), and shRNA against ATG5 (sh-ATG5) and the control (sh-NC) were provided by GenePharma (Shanghai, China). Then, H1581 and A549 cells (5 × 10⁵ cells/well) were transfected with 0.5 μg of the aforementioned oligonucleotides using 0.6 μL of Lipofectamine 3000 (Invitrogen). For the overexpression of circ-FOXM1 (5ʹ-TTCCCTGCACGACATGTTTG-3ʹ), its sequence was constructed into pcDNA3.1 vector (GenePharma). Subsequently, 0.2 μg of circ-FOXM1 was transfected in H1581 and A549 cells with 0.5 μL of Lipofectamine 3000 reagent (Invitrogen).
RNA extraction and quantitative real-time polymerase chain reaction (RT-qPCR)
Total RNA was isolated using Trizol reagent (Invitrogen) based on the user’s manual. Reverse transcription was carried out with the use of PrimeScript RT reagent Kit (Takara, Dalian, China). In brief, the transcription was conducted in a 10 μL reaction mixture, including polyadenylated RNA (100 ng), 5 × PrimeScript Buffer (2 μL), PrimeScript RT Enzyme Mix I (0.5 μL), RT primer mixture (1 μL), and RNase-free water. Then, the total reaction mixture was incubated at 50°C for 15 min and 85°C for 5 sec. RT-qPCR was performed using SYBR Green (Takara) with U6 or glyceraldehyde 3-phosphate dehydrogenase (GAPDH) as the endogenous control. The level of the gene was analyzed using the 2−ΔΔCt method. The amplification parameters were as follows: denaturation at 95°C for 10 min, followed by 40 cycles of denaturation at 95°C for 30 s, annealing at 60°C for 30 s, and extension at 72°C for 1 min. The primers used in this research were listed as follows: circ-FOXM1, forward (F) 5ʹ- ATTAACCACCCCACCATGCC-3ʹ and reverse (R) 5ʹ- TCCAGGGTCACTTCTGTCCT-3ʹ; mRNA-FOXM1, forward (F) 5ʹ-TCTGCCAATGGCAAGGTCTCCT-3ʹ and reverse (R) 5ʹ-CTGGATTCGGTCGTTTCTGCTG-3ʹ; miR-149-5p, F 5ʹ-TCTGGCTCCGTGTCTTCACTCCC-3ʹ and R 5ʹ-TATGGTTGTTCTGCTCTCTGTGTC-3ʹ; ATG5, F 5ʹ-GCAGATGGACAGTTGCACACAC-3ʹ and R 5ʹ-GAGGTGTTTCCAACATTGGCTCA-3ʹ; U6, F 5ʹ-TGCGGGTGCTCGCTTCGGCAGC-3ʹ and R 5ʹ-CCAGTGCAGGGTCCGAGGT-3ʹ; GAPDH, F 5ʹ-GCACCGTCAAGCTGAGAAC-3ʹ and R 5ʹ-TGGTGAAGACGCCAGTGGA-3ʹ
RNase R treatment
Briefly, total RNA was isolated from H1581 and A549 cells. Then, RNase R (3 U/μg; Epicenter Biotechnologies, Madison, WI, USA) was used to digest total RNA (5 μg) for 15 min at 37°C. Finally, RT-qPCR was employed to determine the levels of circ-FOXM1 and FOXM1.
Cell viability
Cell Counting Kit-8 (Sigma-Aldrich, St. Louis, MO, USA) was employed to assess cell viability based on the user’s manual. After transfection, H1581 and A549 cells were cultured for 0 h, 24 h, 48 h, or 72 h, respectively. Subsequently, the cells were incubated with CCK-8 solution. Finally, the absorbance was examined by the microplate reader (Bio-Rad, Richmond, CA, USA) at 450 nm.
Cell apoptosis
The apoptosis of H1581 and A549 cells was monitored by flow cytometry with an Annexin V-FITC/PI Apoptosis Detection Kit (BD Biosciences, Heidelberg, Germany). After 48 h transfection, H1581 and A549 cells were washed and fixed on ice for 1 h. Then, H1581 and A549 cells were resuspended with Binding buffer and stained with 5 μL Annexin V-FITC/PI in dark. At last, apoptotic H1581 and A549 cells were detected using the FACSan flow cytometry (BD Bioscience, San Jose, CA, USA) and analyzed using Cell Quest software (BD Bioscience). Finally, apoptosis rate was examined with the application of a flow cytometer (BD Biosciences).
Cell migration
Cell migration was investigated with the use of a transwell chamber (BD Biosciences) in line with the recommended protocol. In brief, the transfected NSCLC cells in 100 µL medium without PBS were added to the upper chamber, and the lower chamber was introduced with 500 µL medium containing 10% PBS. After 12 h, the migratory cells through the insert were analyzed using a microscope.
Western blot
Total proteins were extracted using lysis buffer (Beyotime Biotechnology, Shanghai, China). Subsequently, the proteins were subjected to 10% sodium dodecyl sulfate-poly-acrylamide gel electrophoresis (SDS-PAGE) and subsequently transferred to polyvinylidene difluoride (PVDF). Next, the membranes were blocked by 5% nonfat skim, and incubated with the primary antibodies against LC3-I, LC3-II, P62, ATG5, and GAPDH (1:1,000) at 4°C overnight and incubated with the relative secondary antibodies (1:2,000). Finally, the protein signal was examined by an enhanced chemiluminescence kit (Beyotime Biotechnology). PVDF and antibodies were provided by Millipore (Bedford, MA, USA) and Abcam (Cambridge, MA, USA), respectively.
Mouse xenografts
Six weeks old male BALB/c nude mice were used in this research. Briefly, the mice were subcutaneously injected with A549 cells (2 × 10⁶) transfected with sh-circ-FOXM1 or sh-NC. There were six mice in each group. Tumor volume (length × width2 × 0.5) was tested every 7 d, and tumor weight was analyzed after 35 d. This study was performed based on the guidance of the National Animal Care and Ethics Institution and approved by the Animal Research Committee of West China Hospital, Sichuan University.
The dual-luciferase reporter assay
Circ-FOXM1 or 3ʹ-UTR-ATG5 (wide-type or mutant-type) was cloned into pmirGLO luciferase reporter vector (Promega, Madison, WI, USA). Then, H1581 and A549 cells were co-transfected with 400 ng of the constructed plasmids, 50 ng of renilla luciferase reporter plasmid (pRL-TK), and 50 nM of miR-NC or miR-149-5p using Lipofectamine 2000 (Invitrogen). After transfection for 48 h, the luciferase density was determined by the Lucifer Reporter Assay System (Promega). Renilla luciferase activities were used as the internal control for the normalization of firefly luciferase activity.
Pull-down assay
Pull-down assay was performed using the biotin RNA labeling mix (Roche, Shanghai, China) in line with the user’s protocol. Briefly, H1581 and A549 cells were lysed and then incubated with the streptavidin magnetic beads labeled with biotin miR-149-5p or negative control at 4°C for 1 h. After washing and eluting, the RNA level was analyzed by RT-qPCR.
Statistical analysis
The results, from at least three independent experiments, were analyzed using Student’s t-test and Analysis of Variance (ANOVA) and represented as the means ± SEM. Pearson’s correlation coefficient was analyzed to assess the relationship between the two genes. P < 0.05 was considered significant.
Results
Circ-FOXM1 was upregulated in NSCLC tissues and cells
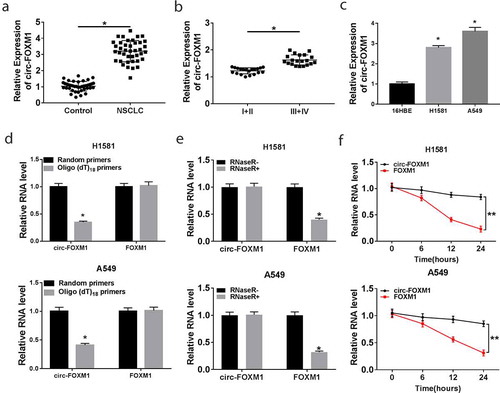
Firstly, we determined the level of circ-FOXM1 using RT-qPCR in NSCLC tissues and the adjacent normal tissues. The results suggested that the circ-FOXM1 level was significantly higher in NSCLC tissues than that in the adjacent normal tissues ()). Moreover, we found that circ-FOXM1 level in NSCLC patients at advanced TMN stage (stage III–IV) was higher than that in NSCLC patients at stage I–II ()). As shown in ), the circ-FOXM1 level was remarkably upregulated in NSCLC cells. To verify the characteristics of circ-FOXM1, random hexamer or oligo (dT) primers were used to carry out RT-qPCR. Compared with the random hexamer primer, the circ-FOXM1 level was remarkably decreased by oligo (dT) primers ()), suggesting that circ-FOXM1 had no poly-A tail. On the other hand, RNase R, a highly 3ʹ-5ʹ exoribonuclease that digested linear RNAs, was used to determine the circular structure of circ-FOXM1. As described in , circ-FOXM1 was resistant against RNase R. These data indicated that circ-FOXM1 might act as an oncogene in NSCLC development.
Figure 1. The level of circ-FOXM1 in NSCLC tissues and cells. (a) The level of circ-FOXM1 was detected by RT-qPCR in NSCLC tissues and adjacent normal tissues; Student’s t-test was performed for statistical analysis. (b) Circ-FOXM1 expression was examined in tissues isolated from various TNM stage (I+ II, III+IV) NSCLC patients by RT-qPCR; Student’s t-test was performed for statistical analysis. (c) The level of circ-FOXM1 was determined in NSCLC cells and normal cells; ANOVA followed via Tukey’s test was performed for statistical analysis. (d) Random hexamer or oligo (dT) primers were used to measure the levels of circ-FOXM1 and mRNA-FOXM1; Student’s t-test was performed for statistical analysis. (e and f) The levels of circ-FOXM1 and mRNA-FOXM1 were examined in NSCLC cells after the treatment of RNase R; Student’s t-test was performed for statistical analysis. *P < 0.05
Circ-FOXM1 knockdown repressed NSCLC cell viability, migration, autophagy and promoted apoptosis in vitro, as well as inhibited tumor growth in vivo
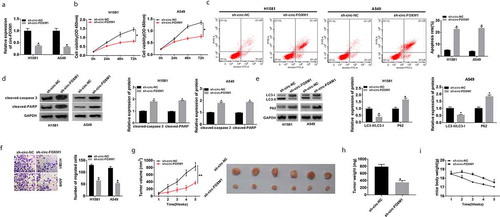
As shown in ), the knockdown efficiency of sh-circ-FOXM1 was confirmed by RT-qPCR ()). Next, CCK-8 was employed to assess cell viability. The results suggested that circ-FOXM1 knockdown significantly inhibited cell viability ()). Furthermore, flow cytometry analysis showed that circ-FOXM1 knockdown remarkably promoted cell apoptosis in H1581 and A549 cells ()). Moreover, circ-FOXM1 knockdown elevated the expression of cleaved-caspase-3 and cleaved-PARP in H1581 and A549 cells ()). Then, we determined the levels of three autophagy-related proteins and found that the ratio of LC3-II and LC3-I was downregulated, while the P62 level was upregulated by circ-FOXM1 knockdown ()). Transwell assay indicated that cell migration was dramatically suppressed by circ-FOXM1 knockdown ()). Besides, to analyze the effect of circ-FOXM1 on tumor growth in vivo, A549 cells transfected with sh-circ-FOXM1 or sh-NC were subcutaneously injected into the male BALB/c nude mice. Our data showed that tumor volume and weight were downregulated in the sh-circ-FOXM1 group compared with that in the sh-NC group, while circ-FOXM1 deletion showed no effect on the mice body weight (). Taken together, circ-FOXM1 knockdown repressed the development of NSCLC.
Figure 2. The function of circ-FOXM1 in NSCLC cells and tumor growth in vivo. (a-i) H1581 and A549 cells were transfected with sh-NC or sh-circ-FOXM1. (a) Circ-FOXM1 expression was determined by RT-qPCR. (b) CCK-8 was used to assess cell viability. (c) Flow cytometry was employed to analyze cell apoptosis rate. (d) The protein expression of cleaved-caspase-3 and cleaved PARP was detected by western blot. (e) Western blot assay was performed to detect the levels of LC3-I, LC3-II, and P62. (f) Cell migratory ability was measured by transwell assay. (g and h) Tumor volume and weight were calculated in sh-NC mice and sh-circ-FOXM1 mice. There were six mice in each group. (i) The mice body weight was calculated. Student’s t-test was performed for statistical analysis. *P < 0.05
Circ-FOXM1 was a sponge for miR-149-5p
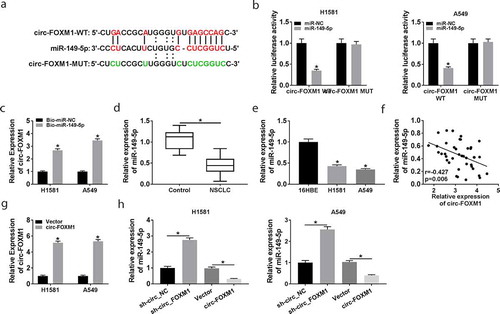
Bioinformatics tool starbase 3.0 predicted that miR-149-5p was a potential target gene of circ-FOXM1 (). To confirm this prediction, the dual-luciferase reporter assay was performed. The results showed that miR-149-5p overexpression significantly reduced the luciferase activity of the circ-FOXM1-WT group, but not the circ-FOXM1-MUT group (). Meanwhile, the interaction between circ-FOXM1 and miR-149-5p was verified by pull-down assay. As shown in , circ-FOXM1 was increased in the Bio-miR-149-5p group. Therefore, circ-FOXM1 directly interacted with miR-149-5p. Next, the level of miR-149-5p in NSCLC tissues and cells was explored. The results demonstrated that the miR-149-5p level was lower in NSCLC tissues and cells (). Furthermore, miR-149-5p expression was negatively correlated with circ-FOXM1 expression in NSCLC tissues (). Besides, whether circ-FOXM1 affected miR-149-5p expression was analyzed. The data showed that the transfection with circ-FOXM1 dramatically increased the expression of circ-FOXM1 (). Moreover, miR-149-5p expression was upregulated by circ-FOXM1 knockdown, and downregulated by circ-FOXM1 overexpression (). These data demonstrated that circ-FOXM1 negatively regulated miR-149-5p expression.
Figure 3. The interaction between circ-FOXM1 and miR-149-5p. (a) The interaction between circ-FOXM1 and miR-149-5p was predicted by starbase3.0. (b) Relative luciferase activity of H1581 and A549 cells co-transfected with circ-FOXM1 WT or circ-FOXM1 MUT and miR-149-5p or miR-NC was measured; ANOVA followed via Tukey’s test was performed for statistical analysis. (c) Pull-down assay was carried out to confirm the interaction between circ-FOXM1 and miR-149-5p; Student’s t-test was performed for statistical analysis. (d) The level of miR-149-5p was detected in NSCLC and normal tissues by RT-qPCR; Student’s t-test was performed for statistical analysis. (e) The level of miR-149-5p was detected in NSCLC cells and normal cells by RT-qPCR; ANOVA followed via Tukey’s test was performed for statistical analysis. (f) The relationship between circ-FOXM1 expression and miR-149-5p expression was analyzed in NSCLC tissues by Pearson correlation coefficient. (g) Circ-FOXM1 expression was examined in H1581 and A549 cells transfected with Vector or circ-FOXM1; Student’s t-test was performed for statistical analysis. (h) MiR-149-5p expression was determined in H1581 and A549 cells transfected with sh-NC, sh-FOXM, Vector, or circ-FOXM1, respectively; ANOVA followed via Tukey’s test was performed for statistical analysis. *P < 0.05
MiR-149-5p overexpression suppressed NSCLC cell growth, and this action was weakened by circ-FOXM1 upregulation
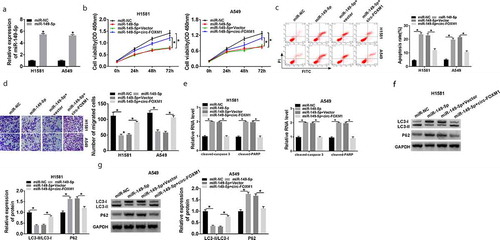
Firstly, RT-qPCR confirmed that transfection with miR-149-5p dramatically upregulated miR-149-5p expression (). As demonstrated in , cell viability was significantly suppressed by miR-149-5p overexpression, and then partly rescued by circ-FOXM1 upregulation (). Moreover, flow cytometry analysis demonstrated that miR-149-5p overexpression induced cell apoptosis, whereas this action was impaired by circ-FOXM1 upregulation (). Transwell assay suggested that the inhibition effect of miR-149-5p overexpression on cell migration was blocked by circ-FOXM1 upregulation (). Furthermore, miR-149-5p overexpression promoted the expression of cleaved-caspase-3 and cleaved-PARP, which was reversed by circ-FOXM1 upregulation ()). Besides, we detected the ratio of LC3-I as well as LC3-II and P62 level and found that the effect of miR-149-5p overexpression on them was weakened by circ-FOXM1 upregulation (). These data indicated that circ-FOXM1 repressed the development of NSCLC via inhibiting miR-149-5p expression.
Figure 4. The role of miR-149-5p in circ-FOXM1-regulated NSCLC progression. (a) MiR-149-5p expression was detected in H1581 and A549 cells transfected with miR-NC or miR-149-5p; Student’s t-test was performed for statistical analysis. (b-g) H1581 and A549 cells were transfected with miR-NC, miR-149-5p, miR-149-5p + Vector, or miR-149-5p + circ-FOXM1. (b) Cell viability was assessed by CCK-8; ANOVA followed via Tukey’s test was performed for statistical analysis. (c) Cell apoptosis was analyzed using flow cytometry; ANOVA followed via Tukey’s test was performed for statistical analysis. (d) Transwell assay was employed to measure cell migratory ability; ANOVA followed via Tukey’s test was performed for statistical analysis. (e) The relative level of cleaved-caspase-3 and cleaved-PARP was detected; ANOVA followed via Tukey’s test was performed for statistical analysis. (f and g) The levels of LC3-I, LC3-II, and P62 were investigated by western blot assay; ANOVA followed via Tukey’s test was performed for statistical analysis. *P < 0.05
MiR-149-5p targeted ATG5
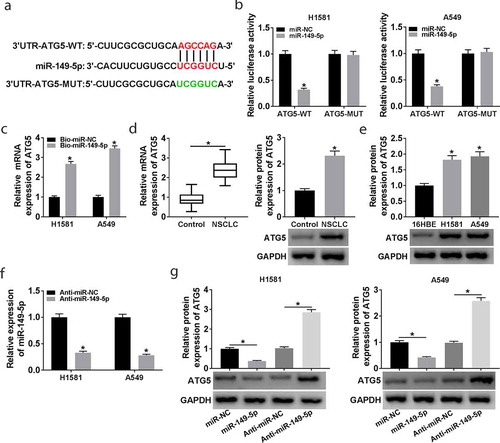
Bioinformatics tool starbase3.0 predicted that ATG5 was a potential target of miR-149-5p (). Dual-luciferase reporter assay indicated that the luciferase activity of ATG5-WT, but not ATG5-MUT, was remarkably reduced by miR-149-5p overexpression (). Moreover, the interaction between miR-149-5p and ATG5 was confirmed by pull-down assay, and the expression of ATG5 was upregulated in the Bio-miR-149-5p group (). These data suggested that miR-149-5p directly targeted ATG5. The results showed that the ATG5 level was increased in NSCLC tissues and cells (). Subsequently, the effect of miR-149-5p on ATG5 expression was explored. The data in showed a successful transfection efficiency of anti-miR-149-5p in H1581 and A549 cells. Moreover, our data indicated that ATG5 expression was downregulated by miR-149-5p overexpression and upregulated by miR-149-5p depletion (). These data demonstrated that miR-149-5p negatively modulated ATG5 expression.
Figure 5. The interaction between miR-149-5p and ATG5. (a) The interaction between miR-149-5p and ATG5 was predicted by starbase3.0. (b) Relative luciferase activity was determined in H1581 and A549 cells transfected with ATG5-WT or ATG5-MUT and miR-149-5p or miR-NC; ANOVA followed via Tukey’s test was performed for statistical analysis. (c) RNA pull-down assay was carried out to verify the interaction between ATG5 and miR-149-5p; Student’s t-test was performed for statistical analysis. (d and e) The mRNA and protein level of ATG5 were detected by RT-qPCR and western blot in NSCLC and normal tissues; Student’s t-test was performed for statistical analysis. (e) The protein expression of ATG5 in NSCLC cells and normal cells was measured by western blot; ANOVA followed via Tukey’s test was performed for statistical analysis. (f) MiR-149-5p expression was determined in H1581 and A549 cells transfected with Anti-miR-NC or Anti-miR-149-5p; Student’s t-test was performed for statistical analysis. (g) ATG5 expression was analyzed in H1581 and A549 cells transfected with miR-NC, miR-149-5p, Anti-miR-NC, or Anti-miR-149-5p, respectively; ANOVA followed via Tukey’s test was performed for statistical analysis. *P < 0.05
MiR-149-5p regulated NSCLC development through inhibiting ATG5 expression
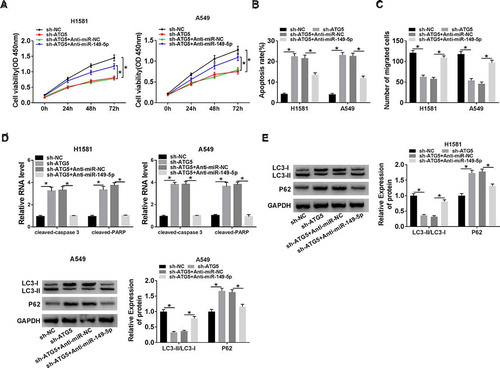
To explore whether miR-149-5p regulating NSCLC progression through inhibiting ATG5 expression, H1581 and A549 cells were transfected with sh-NC, sh-ATG5, sh-ATG5 + Anti-miR-NC, or sh-ATG5 + Anti-miR-149-5p, respectively. The results suggested that ATG5 knockdown repressed cell viability, whereas this action was reversed by miR-149-5p depletion (). Moreover, miR-149-5p depletion weakened the effect of ATG5 knockdown on cell apoptosis (). Furthermore, the transwell assay showed that cell migration was suppressed by ATG5 knockdown, which was rescued by miR-149-5p inhibitor in H1581 and A549 cells (). The promotion effects of ATG5 deletion on cleaved-caspase-3 and cleaved-PARP expression were blocked by miR-149-5p inhibitor (). Besides, we found that the effect of ATG5 knockdown on the ratio (LC3-II/LC3-I) and P62 level was impaired by miR-149-5p depletion (). Therefore, miR-149-5p repressed NSCLC development via suppressing ATG5 expression.
Figure 6. The role of ATG5 in miR-149-5p-regulated NSCLC cell progression. (a-e) H1581 and A549 cells were transfected with sh-NC, sh-ATG5, sh-ATG5 + Anti-miR-NC, or sh-ATG5 + Anti-miR-149-5p. (a) Cell viability was measured by CCK-8 assay. (b) Flow cytometry was used to analyze cell apoptosis rate. (c) Transwell assay was employed to determine cell migration. (d) The relative level of cleaved-caspase-3 and cleaved-PARP was determined. (e) Western blot assay was carried out to detect the levels of LC3-I, LC3-II, and P62. ANOVA followed via Tukey’s test was performed for statistical analysis. *P < 0.05
Circ-FOXM1 repressed miR-149-5p expression to upregulate ATG5 level
RT-qPCR and western blot assay confirmed that ATG5 expression was downregulated by circ-FOXM1 knockdown, which was reversed by miR-149-5p depletion (). Furthermore, our data confirmed that circ-FOXM1 overexpression upregulated ATG5 expression, whereas this action was impaired by miR-149-5p upregulation in A549 cells (). Taken together, circ-FOXM1 upregulated ATG5 level by sponging miR-149-5p.
Figure 7. The relationship among circ-FOXM1, miR-149-5p, and ATG5. (a and b) The expression of ATG5 was determined in H1581 cells transfected with sh-circ-NC, sh-circ-FOXM1, sh-circ-FOXM1 + Anti-miR-NC, or sh-circ-FOXM1 + Anti-miR-149-5p, respectively; ANOVA followed via Tukey’s test was performed for statistical analysis. (c and d) The expression of ATG5 was detected in A549 cells transfected with Vector, circ-FOXM1, circ-FOXM1 + miR-NC, or circ-FOXM1 + miR-149-5p, respectively; ANOVA followed via Tukey’s test was performed for statistical analysis. *P < 0.05
Discussion
Non-small cell lung cancer (NSCLC) is a common cancer that seriously threatens people’s lives and health [Citation17]. CircRNAs were identified as a kind of important regulators in the development of human cancers [Citation18]. Increasing studies suggested that circRNAs played important roles in NSCLC. For instance, Wang et al. confirmed that circRNA SMARCA5 repressed the proliferation and mobility of NSCLC cells via modulating miR-19b-3p expression [Citation19]. Zhang et al. demonstrated that circRNA ZFR upregulated cullin 4B (CUL48) level to promote the growth of NSCLC cells by targeting miR-101-3p [Citation20]. Xue et al. revealed that circRNA AGFG1 induced epithelial–mesenchymal transition (EMT) and metastasis of NSCLC through modulating the miR-203/zinc finger protein 281 (ZNF281) axis [Citation21]. However, the functional mechanisms of circRNAs in NSCLC development are still largely unknown. In recent years, the function of circ-FOXM1 in human cancers was less reported. The previous studies indicated that circ-FOXM1 was highly expressed in cancers and promoted the development of NSCLC and papillary thyroid cancer [Citation10,Citation22]. Therefore, more experiments should be performed for the analysis of the circ-FOXM1 functional mechanism. In this research, we found that circ-FOXM1 was remarkably upregulated in NSCLC tissues and cells. Furthermore, we found that circ-FOXM1 exerted an oncogenic role in NSCLC development. Our findings demonstrated that circ-FOXM1 deletion inhibited the progression of NSCLC, as evidenced by suppressing cell growth, autophagy, and promoted cell apoptosis.
It is well known that circRNA exerted functions through targeting miRNA and regulating its expression [Citation23]. For example, circ_0020123 modulated the growth of NSCLC cells via targeting miR-144 [Citation24]. To further explore the functional mechanism of circ-FOXM1 in NSCLC cells, the bioinformatics tool starbase3.0 was applied to predict the potential target genes. Our data indicated that miR-149-5p was a target of circ-FOXM1. Previous researches proved that miR-149-5p acted as a tumor suppressor in various human cancers, such as nasopharyngeal carcinoma [Citation25], melanoma [Citation26], human osteosarcoma [Citation27], and hepatocellular carcinoma [Citation28], and NSCLC [Citation29]. Our data suggested that miR-149-5p was remarkably downregulated in NSCLC tissues and cells. Furthermore, our results indicated that circ-FOXM1 negatively regulated miR-149-5p expression. The functional analysis demonstrated that circ-FOXM1 upregulation partly weakened the effect of miR-149-5p overexpression on NSCLC cell growth. Emerging evidence revealed that one circRNA targeted multiple miRNAs to affect cell growth [Citation30,Citation31]. Taken together, circ-FOXM1 affected the growth of NSCLC cells, at least partly, through suppressing miR-149-5p expression.
Multiple researches confirmed that miRNA regulated cell growth by targeting the downstream mRNA [Citation32,Citation33]. In this study, we confirmed that ATG5 was a target of miR-149-5p and negatively regulated by miR-149-5p. ATG5, a member of autophagy-related genes, was confirmed to affect cell survival through regulating autophagy [Citation34]. Autophagy is a lysosomal degradation pathway, participated in the regulation of survival, differentiation, development, and homeostasis [Citation35]. In cancer, autophagy has opposing, environment-dependent roles [Citation35,Citation36]. Studies have shown that enhanced autophagy could prevent cancer development [Citation37]. However, once the cancer is established, increased autophagic flux promotes the cell survival and growth of tumors [Citation38]. Focused on autophagy, especially inhibiting autophagy, was considered as a potential treatment strategy for cancers, including NSCLC [Citation39–41]. Thus, exploring the essential association of circ-FOXM1/miR-149-5p/ATG5 axis with autophagy will help to search novel molecular therapeutic targets for lung cancer.
Besides, a previous study reported that ATG5 function was related to intracellular Ca2+ homeostasis [Citation42]. Moreover, ATG5 interacted with ATG12 and ATG16L1 to inform the ATG12–ATG5-ATG16L1 complex, which was related to its function [Citation43]. More importantly, ATG5 exerted oncogenic function in human cancers, such as gastric cancer [Citation44], prostate cancer [Citation45], and hepatocellular carcinoma [Citation46]. Similar to autophagy, the function of ATG5 in human cancers was complicated. The function of ATG5 in human NSCLC was rarely reported. In this study, we demonstrated that ATG5 depletion suppressed the growth of NSCLC cells, which was weakened by miR-149-5p knockdown. Taken together, miR-149-5p exerted function via inhibiting ATG5 expression. Besides, our results indicated that circ-FOXM1 repressed miR-149-5p expression to upregulate ATG5 level.
In summary, we demonstrated that circ-FOXM1 knockdown suppressed the development of NSCLC through competitively targeting miR-149-5p to regulate ATG5 expression. Our findings demonstrated that the circ-FOXM1/miR-149-5p/ATG5 axis was involved in the progression of NSCLC, providing a potential target for the therapy of NSCLC.
Highlight
Circ-FOXM1 knockdown inhibits the growth of NSCLC cells.
Circ-FOXM1 interacts with miR-149-5p to regulate ATG5 expression.
Circ-FOXM1 regulates NSCLC cell growth through regulating the miR-149-5p/ATG5 axis.
Disclosure of interest
The authors declare that they have no financial conflicts of interest.
Supplemental Material
Download MS Excel (33.3 KB)Disclosure statement
No potential conflict of interest was reported by the authors.
Supplementary material
Supplemental data for this article can be accessed here.
Additional information
Funding
Related Research Data
References
- Rosell R, Karachaliou N. Avelumab in non-small-cell lung cancer. Lancet Oncol. 2018;19:1423–1424.
- Siegel RL, Miller KD, Jemal A. Cancer statistics, 2018. CA Cancer J Clin. 2018;68:7–30.
- Willers H, Azzoli CG, Santivasi WL, et al. Basic mechanisms of therapeutic resistance to radiation and chemotherapy in lung cancer. Cancer J. 2013;19:200–207.
- Molina JR, Yang P, Cassivi SD, et al. Non-small cell lung cancer: epidemiology, risk factors, treatment, and survivorship. Mayo Clin Proc. 2008;83:584–594.
- Wang J, Li H. CircRNA circ_0067934 silencing inhibits the proliferation, migration and invasion of NSCLC cells and correlates with unfavorable prognosis in NSCLC. Eur Rev Med Pharmacol Sci. 2018;22:3053–3060.
- Chen X, Mao R, Su W, et al. Circular RNA circHIPK3 modulates autophagy via MIR124-3p-STAT3-PRKAA/AMPKalpha signaling in STK11 mutant lung cancer. Autophagy. 2020;16:659–671
- Zhang J, Liu H, Hou L, et al. Circular RNA_LARP4 inhibits cell proliferation and invasion of gastric cancer by sponging miR-424-5p and regulating LATS1 expression. Mol Cancer. 2017;16:151.
- Glazar P, Papavasileiou P, Rajewsky N. circBase: a database for circular RNAs. Rna. 2014;20:1666–1670.
- Lu H, Han X, Ren J, et al. Circular RNA HIPK3 induces cell proliferation and inhibits apoptosis in non-small cell lung cancer through sponging miR-149. Cancer Biol Ther. 2020;21:113–121
- Liu G, Shi H, Deng L, et al. Circular RNA circ-FOXM1 facilitates cell progression as ceRNA to target PPDPF and MACC1 by sponging miR-1304-5p in non-small cell lung cancer. Biochem Biophys Res Commun. 2019;513:207–212.
- Cheng J, Zhuo H, Xu M, et al. Regulatory network of circRNA-miRNA-mRNA contributes to the histological classification and disease progression in gastric cancer. J Transl Med. 2018;16:216.
- Zhao J, Chen Y, Liu F, et al. Overexpression of miRNA-143 inhibits colon cancer cell proliferation by inhibiting glucose uptake. Arch Med Res. 2018;49:497–503.
- Wang R, Sun Y, Yu W, et al. Downregulation of miRNA-214 in cancer-associated fibroblasts contributes to migration and invasion of gastric cancer cells through targeting FGF9 and inducing EMT. J Exp Clin Cancer Res. 2019;38:20.
- Wang J, Lu L, Luo Z, et al. miR-383 inhibits cell growth and promotes cell apoptosis in hepatocellular carcinoma by targeting IL-17 via STAT3 signaling pathway. Biomed Pharmacother. 2019;120:109551.
- Chen Y, Min L, Ren C, et al. miRNA-148a serves as a prognostic factor and suppresses migration and invasion through Wnt1 in non-small cell lung cancer. PLoS One. 2017;12:e0171751.
- Liu L, Chen Y, Li Q, et al. lncRNA HNF1A-AS1 modulates non-small cell lung cancer progression by targeting miR-149-5p/Cdk6. J Cell Biochem. 2019;120:18736–18750.
- Lemjabbar-Alaoui H, Hassan OU, Yang YW, et al. Lung cancer: biology and treatment options. Biochim Biophys Acta. 2015;1856:189–210.
- Meng S, Zhou H, Feng Z, et al. CircRNA: functions and properties of a novel potential biomarker for cancer. Mol Cancer. 2017;16:94.
- Wang Y, Li H, Lu H, et al. Circular RNA SMARCA5 inhibits the proliferation, migration, and invasion of non-small cell lung cancer by miR-19b-3p/HOXA9 axis. Onco Targets Ther. 2019;12:7055–7065.
- Zhang H, Wang X, Hu B, et al. Circular RNA ZFR accelerates non-small cell lung cancer progression by acting as a miR-101-3p sponge to enhance CUL4B expression. Artif Cells Nanomed Biotechnol. 2019;47:3410–3416.
- Xue YB, Ding MQ, Xue L, et al. CircAGFG1 sponges miR-203 to promote EMT and metastasis of non-small-cell lung cancer by upregulating ZNF281 expression. Thorac Cancer. 2019;10:1692–1701.
- Pan Y, Xu T, Liu Y, et al. Upregulated circular RNA circ_0025033 promotes papillary thyroid cancer cell proliferation and invasion via sponging miR-1231 and miR-1304. Biochem Biophys Res Commun. 2019;510:334–338.
- Jin X, Feng CY, Xiang Z, et al. CircRNA expression pattern and circRNA-miRNA-mRNA network in the pathogenesis of nonalcoholic steatohepatitis. Oncotarget. 2016;7:66455–66467.
- Qu D, Yan B, Xin R, et al. A novel circular RNA hsa_circ_0020123 exerts oncogenic properties through suppression of miR-144 in non-small cell lung cancer. Am J Cancer Res. 2018;8:1387–1402.
- Kong YG, Cui M, Chen SM, et al. LncRNA-LINC00460 facilitates nasopharyngeal carcinoma tumorigenesis through sponging miR-149-5p to up-regulate IL6. Gene. 2018;639:77–84.
- Chen W, Zhang J, Xu H, et al. The negative regulation of miR-149-5p in melanoma cell survival and apoptosis by targeting LRIG2. Am J Transl Res. 2017;9:4331–4340.
- Xu RD, Feng F, Yu XS, et al. miR-149-5p inhibits cell growth by regulating TWEAK/Fn14/PI3K/AKT pathway and predicts favorable survival in human osteosarcoma. Int J Immunopathol Pharm . 2018;32:2058738418786656.
- Ji D, Wang Y, Li H, et al. Long non-coding RNA LINC00461/miR-149-5p/LRIG2 axis regulates hepatocellular carcinoma progression. Biochem Biophys Res Commun. 2019;512:176–181.
- Li J, Li Y, Wang B, et al. LncRNA-PCAT-1 promotes non-small cell lung cancer progression by regulating miR-149-5p/LRIG2 axis. J Cell Biochem. 2018:10.1002/jcb.28046
- Chang H, Qu J, Wang J, et al. Circular RNA circ_0026134 regulates non-small cell lung cancer cell proliferation and invasion via sponging miR-1256 and miR-1287. Biomed Pharmacother. 2019;112:108743.
- Wang Y, Li Y, He H, et al. Circular RNA circ-PRMT5 facilitates non-small cell lung cancer proliferation through upregulating EZH2 via sponging miR-377/382/498. Gene. 2019;720:144099.
- Wan C, Li Y. Integrative analysis of mRNA-miRNA-TFs reveals the key regulatory connections involved in basal cell carcinoma. Arch Dermatol Res. 2019. DOI:10.1007/s00403-019-02002-y
- Wang J, Yu XF, Ouyang N, et al. MicroRNA and mRNA interaction network regulates the malignant transformation of human bronchial epithelial cells induced by cigarette smoke. Front Oncol. 2019;9:1029.
- Pua HH, Dzhagalov I, Chuck M, et al. A critical role for the autophagy gene Atg5 in T cell survival and proliferation. J Exp Med. 2007;204:25–31.
- Levine B, Kroemer G. Autophagy in the pathogenesis of disease. Cell. 2008;132:27–42.
- Levy JMM, Towers CG, Thorburn A. Targeting autophagy in cancer. Nat Rev Cancer. 2017;17:528–542.
- Galluzzi L, Pietrocola F, Bravo-San Pedro JM, et al. Autophagy in malignant transformation and cancer progression. Embo J. 2015;34:856–880.
- Levy JM, Thorburn A. Targeting autophagy during cancer therapy to improve clinical outcomes. Pharmacol Ther. 2011;131:130–141.
- Towers CG, Thorburn A. Therapeutic targeting of autophagy. EBioMedicine. 2016;14:15–23.
- Guo J, Wu Y, Du J, et al. Deregulation of UBE2C-mediated autophagy repression aggravates NSCLC progression. Oncogenesis. 2018;7:49.
- Liu G, Pei F, Yang F, et al. Role of autophagy and apoptosis in non-small-cell lung cancer. Int J Mol Sci. 2017;18:367.
- Kania E, Pajak B, Orzechowski A. Calcium homeostasis and ER stress in control of autophagy in cancer cells. Biomed Res Int.2015;2015:352794
- Wible DJ, Chao HP, Tang DG. ATG5 cancer mutations and alternative mRNA splicing reveal a conjugation switch that regulates ATG12-ATG5-ATG16L1 complex assembly and autophagy. Cell Discovery. 2019;5:42.
- Ge J, Chen Z, Huang J, et al. Upregulation of autophagy-related gene-5 (ATG-5) is associated with chemoresistance in human gastric cancer. PLoS One. 2014;9:e110293.
- Zhang N, Li Z, Bai F, et al. PAX5-induced upregulation of IDH1-AS1 promotes tumor growth in prostate cancer by regulating ATG5-mediated autophagy. Cell Death Dis. 2019;10:734.
- Wang CZ, Yan GX, Dong DS, et al. LncRNA-ATB promotes autophagy by activating Yes-associated protein and inducing autophagy-related protein 5 expression in hepatocellular carcinoma. World J Gastroenterol. 2019;25:5310–5322.