
ABSTRACT
Gallbladder carcinoma (GBC) is one of the most common fatal biliary tract tumors in the world. Its 3-year survival rate is 30% and the recurrence rate remains very high. miR-365 was downregulated in numerous tumors and worked as tumor suppressor gene. However, the role of miR-365 in GBC was unclear. In this study, our results found that the expression of miR-365 in GBC tissues was reduced rather than that in non-cancerous tissues. miR-365 overexpression inhibited the proliferation, metastasis and expansion of GBC CSCs. Mechanically, bioinformatic and luciferase reporter analysis identified Ras-related C3 botulinum toxin substrate 1 (RAC1) as a direct target of miR-365. Overexpression of miR-365 in GBC cells reduced the RAC1 mRNA and protein expression. The special RAC1 inhibitor EHop-106 abolished the discrepancy of growth, metastasis and self-renewal ability between miR-365-overexpression GBC cells and their control cells, which further demonstrated that RAC1 was involved in miR-365-disrupted GBC cells growth, metastasis and self-renewal. More importantly, reduced expression of miR-365 was a predictor of poor prognosis of GBC patients. In conclusion, miR-365 inhibited GBC cell growth, metastasis and self-renewal capacity by directly targeting RAC1, and may therefore prove to be a novel prognosis biomarker for GBC patients.
Introduction
Gallbladder carcinoma (GBC) is one of the most common fetal malignancies in the world [Citation1]. It is the fifth most common gastrointestinal cancer [Citation2]. Most GBC patients are diagnosed at advanced stage and always transferred to regional lymph nodes at an early time [Citation3]. Its recurrence and chemo-resistance rates are very high [Citation4]. In the past decade, 5-year survival of GBC patients was as low as 5% and the mean survival ranges from 13.2 to 19 months [Citation5]. Recent molecular biology studies on the pathogenesis of GBC may shed a light on treatment strategies to prolong the survival time of GBC patients, though the underlying mechanisms and potential therapeutic targets need to be clarified [Citation6].
miRNAs were a small non-coding RNA molecule, which contain about 22 nucleotides [Citation7,Citation8]. They regulate RNA silencing and post-transcriptional gene expression in general by binding to the 3’UTR of target mRNAs [Citation9,Citation10]. miRNAs work as oncogenes or tumor suppressors in different tumors [Citation11,Citation12]. It was also reported that miRNAs have important roles in regulating the progression of cancers and cancer stem cells (CSCs) [Citation13,Citation14]. Recent studies have shown that miR-365 acted as a tumor suppressor and inhibited the proliferation and invasion of numerous tumors including liver cancer, gastric cancer and lung cancer [Citation15–17]. It was reported that miR-365 suppressed HCC cells progression through targeting ADAM10 [Citation18]. However, the regulatory role of miR-365 in GBC remains unknown.
Increasing appreciation of heterogeneity and hierarchical organization in tumors supported the theory of cancer stem cells (CSCs) [Citation19]. They possess the properties of self-renewal, differentiation potential, resistance to chemotherapy, and high tumorigenicity [Citation20]. It was reported that CD44, CD133, EpCAM were identified as GBC CSCs biomarkers [Citation21–23]. Accumulating evidences show that chemo-resistance and recurrence of GBC patients are closely associated with the existence of GBC CSCs [Citation24]. Tumors that harbor an abundant CSC population or have high expression of stemness-related genes may signal a poor clinical outcome in GBC patients [Citation25]. Therefore, a more effective therapeutic strategy could be developed if the molecular mechanism underlying CSCs regulation is explored. However, the detailed regulatory mechanism of GBC CSCs generation and expansion remains far from fully understood.
In the present study, we first found that miR-365 was downregulated in GBC tissues. Next, by using gain-of-function analysis in GBC cells, we demonstrated that miR-365 inhibited the progression of GBC cells. Further mechanism study revealed that miR-365 directly regulated RAC1 by binding with its mRNA 3ʹUTR. RAC1 special inhibitor EHop-106 could abolish the growth, metastasis and self-renewal discrepancy between miR-365 overexpression cells and control cells. We also found that miR-365 was correlated with the poor prognosis of GBC patients.
Materials and methods
Patients and samples
A total of 124 GBC patients’ tissue samples were collected from the Gansu provincial hospital (Gansu, China). Overall survival (OS) was defined as the time interval from the date of surgery to the date of death; disease-free survival (DFS) was defined as the time interval from the date of surgery to the evidence of recurrence; non-GBC-related death was scored as recurrence. Patient informed consent was also obtained and the procedure of human sample collection was approved by the Ethics Committee of Gansu provincial hospital.
Cell lines and cell culture
GBC cell lines SGC-996 and GBC-SD were purchased from Chinese Academy of Sciences, Shanghai, China. The GBC cells were cultured with Dulbecco’s modified Eagle’s medium (DMEM) supplemented with 10% fetal bovine serum (FBS) and 2 mM L-glutamine, and 25 µg/ml of gentamicin and maintained at 37°C in 5% CO2 incubator. The culture cells were digested with 0.5% trypsin and moved to a new 10 dish twice a week.
The lenti-vector expressing miR-365 and its control virus were produced as described previously [Citation26]. GBC-SD or SGC-996 cells were infected with miR-365 or its control virus and the stable infectants were screened by puromycin.
Cell proliferation assays
For cell proliferation analysis, GBC-SD miR-365 or SGC-996 miR-365 and their control cells were seeded in 96-well plates (3 × 10³ cells per well). ATP activity was measured using a Cell Counting Kit-8 at indicated time points.
For cell EdU immunofluorescence staining, GBC-SD miR-365 or SGC-996 miR-365 and their control cells were seeded into 96-well plates and performed using the EdU Kit (RiboBio). The results were quantified with a Zeiss axiophot photomicroscope (Carl Zeiss) and Image-Pro plus 6.0 software.
Cell migration assay
For cell migration experiments, 2 × 10⁵ GBC cells were seeded into the upper chamber of a polycarbonate transwell in serum-free DMEM. The lower chamber was adding with DMEM containing 20% FBS as chemoattractant. The cells were incubated for 18 hours and the chamber was fixed. Cell count is expressed as the average number of the cells in each field.
Cell invasion assay
For cell invasion experiments, 2 × 10⁵ GBC cells were seeded into the upper chamber of a polycarbonate transwell in serum-free DMEM. The lower chamber was adding with DMEM containing 20% FBS as chemoattractant. The cells were incubated for 48 hours and the chamber was fixed. Cell count is expressed as the average number of the cells in each field.
Spheroid formation assay
GBC-SD miR-365 or SGC-996 miR-365 and their control cells were cultured in a 6-well or 96-well ultra-low attachment culture plate for seven days, and the total number of spheres was counted under the microscope.
Flow-cytometric analysis
Hepatoma cells were incubated with the primary anti-CD44 or anti-CD133 for 30 min at room temperature. GBC-SD miR-365 or SGC-996 miR-365 and their control cells were incubated with the primary anti-CD44 or anti-CD133 for 30 min at room temperature. Flow-cytometric analysis was performed using a MoFlo XDP from Beckman Coulter according to the manufacturer’s instructions.
Limiting dilution assay
Various numbers of GBC-SD miR-365 or SGC-996 miR-365 and their control cells were seeded into 96-well ultra-low attachment culture plates for one week. CSC proportions were analyzed using Poisson distribution statistics and the L-Calc Version 1.1 software program (Stem Cell Technologies, Inc., Vancouver, Canada) as described [Citation27].
Real-time PCR
For the detection of mature miR-365, total RNA was subjected to reverse transcription using a TaqMan MicroRNA Reverse Transcription Kit (Applied Biosystems). qRT-PCR analysis of miR-365 expression was carried out using TaqMan MicroRNA assay kits (Applied Biosystems). Results were normalized to U6 snRNA using the comparative threshold cycle (Ct) method.
The total cells RNA were extracted by using Trizol reagent (Invitrogen, 15,596–018). Total cDNAs were synthesized by ThermoScript TM RT-PCR system (Invitrogen, 11,146–057). The total mRNA amount presented in the cells was measured by RT-PCR using the ABI PRISM 7300 sequence detector (Applied Biosystems). The RAC1 primer sequences were forward: 5’ GCAAACAGATGTGTTCTTAAT 3’, reverse: 5’ TCATCCCTAAGATCAAGTTT 3’.
Western blotting assay
Thirty micrograms of proteins were subjected to sodium dodecyl sulfate polyacrylamide gel electrophoresis and then transferred to nitrocellulose membrane. The membrane was blocked with 5% nonfat milk and incubated with the primary antibody overnight. The protein band, specifically bound to the primary antibody, was detected using an IRDye 800CW-conjugated secondary antibody and LI-COR imaging system (LI-COR Biosciences). The antibodies used for western blot are RAC1 and GAPDH (Cell signaling technology, USA)
Luciferase reporter assay
GBC cells were transfected with RAC1 WT or RAC1 mutant 3’UTR plasmids. Luciferase activity was measured using a Synergy 2 Multidetection Microplate Reader (BioTek Instruments, Inc.). Data were normalized for transfection efficiency by dividing firefly luciferase activity by Renillaluciferase activity.
Statistical analysis
GraphPad Prism (GraphPad Software, Inc. La Jolla, USA) was used for all statistical analyses. Statistical analysis was carried out using t test or Bonferroni Multiple Comparisons Test: *p < 0.05. A p value of less than 0.05 was considered significant.
Results
Overexpression of miR-365 suppressed GBC cells proliferation in vitro
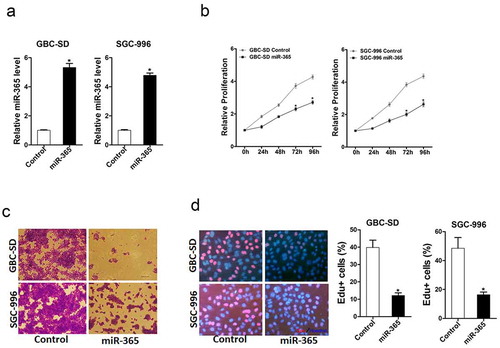
To explore the function of miR-365 in GBC cells, GBC-SD and SGC-996 cells were infected with miR-365 overexpression lentivirus. The stable infectants were checked by real-time PCR (). As expected, miR-365 overexpression suppressed the proliferation of GBC cells markedly (). Furthermore, GBC cells stably overexpressing miR-365 formed smaller and fewer colonies (). Consistently, 5-ethynyl-2ʹ-deoxyuridine (EdU) staining confirmed that ectopic expression of miR-365 suppressed cell proliferation (). Collectively, the above results demonstrated that miR-365 suppressed GBC cells growth.
Figure 1. miR-365 overexpression inhibited GBC cells proliferation. A. GBC-SD and SGC-996 cells infected with miR-365 overexpression virus show a significant increase in miR-365 levels compared to the control, as revealed by RT-PCR. (n = 3 independent experiments; P < 0.05). B. The proliferation in GBC-SD miR-365 or SGC-996 miR-365 and their control cells were performed by CCK8 assay. (n = 6 independent experiments). C. Both GBC-SD miR-365 and SGC-996 miR-365 cells formed fewer and smaller clones than their control cells. A colony formation assay was used for the analysis. (n = 3 independent experiments). D. The proliferation in GBC-SD miR-365 or SGC-996 miR-365 and their control cells were performed by EdU immunofluorescence staining assay (red). Nuclei were stained with Hoechst 33,342 (blue). (n = 3 independent experiments)
Overexpression of miR-365 inhibited GBC cells migration and invasion in vitro
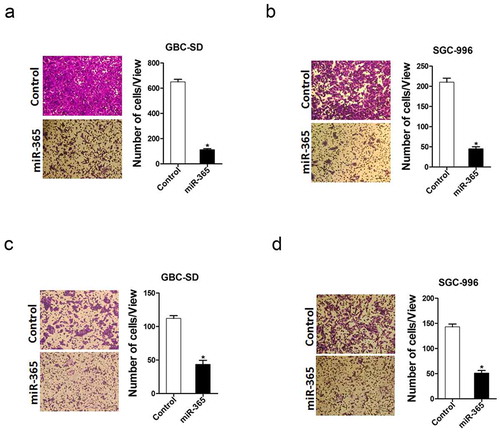
To further elucidate the effect of miR-365 in GBC cell metastasis, transwell assay was performed. As shown in ), the migration ability was attenuated in GBC cells overexpressing miR-365. In addition, the invasion ability was also impaired in miR-365 overexpressing GBC cells ). Taken together, our results showed that miR-365 disrupted the metastatic potential of GBC cells.
Figure 2. miR-365 overexpression suppressed GBC cells migration and invasion. A. The migration ability of GBC-SD miR-365 and its control cells were performed using transwell assay. The result showed that the migration ability was impaired in GBC-SD miR-365 cells. (n = 3 independent experiments). B. The migration ability of SGC-996 miR-365 and its control cells were performed using transwell assay. The result showed that the migration ability was impaired in SGC-996 miR-365 cells. (n = 3 independent experiments). C. The invasive properties of GBC-SD miR-365 and control cells were analyzed using Matrigel-coated Boyden chamber. The result showed that the invasion ability was impaired in GBC-SD miR-365 cells. (n = 3 independent experiments). D. The invasive ability of SGC-996 miR-365 and its control cells were performed using Invasion chamber. The result showed that the invasion ability was impaired in SGC-996 miR-365 cells. (n = 3 independent experiments)
miR-365 expression was downregulated in GBC CSCs
It was reported that miRNAs have important roles in cancer stem cells regulation [Citation28]. Whether miR-365 was involved in the maintenance of GBC CSCs remained unknown. To our surprise, miR-365 expression was significantly reduced in CSC-enriched GBC spheroids compared with monolayer-cultured cells (). Moreover, in serial passages of GBC-SD or SGC-996 spheroids, the expression of miR-365 was gradually decreased (). Intriguingly, miR-365 expression could be partially recovered when the spheroid cells reseeded in attached plates (). Cluster of differentiation 44–positive (CD44+) or Cluster of differentiation 133–positive (CD133+) GBC cells, which have been considered GBC CSCs, suppressed miR-365 expression compared with CD44 – or CD133 – cells ).
Figure 3. miR-365 expression was downregulated in GBC CSCs. A. GBC cells were cultured in monolayer or ultra-low attachment conditions. miR-365 expression in spheroids and attached cells was compared by real-time PCR. miR-365 expression was downregulated in GBC spheres. (n = 3 independent experiments). B. The expression of miR-365 in serial passages of GBC-SD or SGC-996 spheroids was checked by real-time PCR. miR-365 expression was gradually decreased. (n = 3 independent experiments). C. GBC cell–derived spheroids were trypsinized and cultured in attachment conditions. miR-365 expression in spheroids versus reattached cells was compared by RT- PCR. miR-365 expression was downregulated in GBC spheres and recovered to normal level in reattached condition. (n = 3 independent experiments). D. CD44+ GBC cells were sorted by flow cytometry and the expression of miR-365 was determined by real-time PCR assay. miR-365 expression was downregulated in CD44+ GBC cells compared with CD44- cells. (n = 3 independent experiments). E. CD133+ GBC cells were sorted by flow cytometry and the expression of miR-365 was determined by real-time PCR assay. miR-365 expression was downregulated in CD133+ GBC cells compared with CD133- cells. (n = 3 independent experiments)
miR-365 repressed GBC CSCs expansion
To explore the function of miR-365 in GBC CSCs, miR-365 stable overexpressing transfectants of GBC cells were used. As expected, fewer spheroids were formed in GBC cells overexpressing miR-365 as compared with control cells (). Consistently, flow-cytometric analysis revealed a diminished proportion of GBC CSCs in miR-365 stably transfected GBC cells (). An in vitro limiting dilution assay illustrated that miR-365 overexpression dramatically decreased the CSC population in GBC cells (). Moreover, the expression of GBC stemness-associated transcription factors and CSC markers was also suppressed in miR-365 overexpression spheroids (), which further supported that miR-365 could suppress GBC CSCs expansion.
Figure 4. Overexpressing miR-365 suppressed GBC CSCs propagation. A. Both GBC-SD miR-365 and SGC-996 miR-365 cells formed fewer spheres than their control cells. A spheroids formation assay was used for the analysis. (n = 3 independent experiments; P < 0.05). B. Both GBC-SD miR-365 and SGC-996 miR-365 cells show a significant decrease in proportion of CD44+ or CD133+ compared to the control, as revealed by flow cytometry. (n = 3 independent experiments; P < 0.05). C. The frequency of gallbladder CSCs in SGC-996 miR-365 or GBC-SD miR-365 and their control cells was determined by in vitro limiting dilution assay. The frequency of gallbladder CSCs in SGC-996 miR-365 or GBC-SD miR-365 was downregulated. (n = 8 independent experiments). D. Both GBC-SD miR-365 and SGC-996 miR-365 cells show a significant decrease in stemness-associated transcription factors and CSCs markers compared to the control, as revealed by RT-PCR. (n = 3 independent experiments; P < 0.05)

RAC1 was a direct target of miR-365 in GBC cells
Next, we attempted to identify the target genes of miR-365 that may be involved in GBC cells regulation. Bioinformatics analysis suggested that RAC1 mRNA harbored a putative miR-365 binding site in its 3ʹ-UTR (). To further explore whether miR-365 directly regulates RAC1 expression via interaction with its 3’-UTR, the wild-type or mutant RAC1 3’-UTR reporter plasmids were transfected into miR-365 overexpression GBC cells and their control cells. The luciferase activity of wild-type reporter was significantly inhibited in the presence of miR-365 (). However, miR-365-mediated repression of the reporter expression was abolished by mutation of the miR-365 binding site in the RAC1 3ʹ-UTR. Consistently, RAC1 mRNA and protein levels were also downregulated in miR-365 overexpression GBC cells ), which further suggesting RAC1 was a direct target of miR-365.
Figure 5. RAC1 was a direct target of miR-365 in GBC cells. A. A potential target site for miR-365 in the 3ʹ-UTR of human RAC1 mRNA, as predicted by the program Targetscan. To disrupt the interaction between miR-365 and RAC1 mRNA, the target site was mutated. B. Luciferase reporter assays performed in SGC-996 miR-365 or GBC-SD miR-365 and their control cells transfected with wild-type or mutant RAC1 3’ -UTR constructs. (n = 3 independent experiments). C. Both GBC-SD miR-365 and SGC-996 miR-365 cells show a significant decrease in RAC1 mRNA levels compared to the control, as revealed by RT-PCR. (n = 3 independent experiments; P < 0.05). D. Both GBC-SD miR-365 and SGC-996 miR-365 cells show a significant decrease in RAC1 protein levels compared to the control, as revealed by western blot. (n = 3 independent experiments; P < 0.05). E. SGC-996 miR-365 or GBC-SD miR-365 and their control cells were treated with EHop-016 (10 μM) or not and subjected to CCK8 assay. (n = 6 independent experiments). F. SGC-996 miR-365 or GBC-SD miR-365 and their control cells were treated with EHop-016 (10 μM) or not and subjected to invasion chamber. (n = 3 independent experiments). G. SGC-996 miR-365 or GBC-SD miR-365 and their control cells were treated with EHop-016 (10 μM) or not and subjected to spheroid formation. (n = 3 independent experiments)
To further confirm the role of RAC1 in miR-365-mediated regulation of GBC cells, the special RAC1 inhibitor FHop-106 was used [Citation29]. As expected, FHop-106 diminished the distinct growth capacity between miR-365 overexpression GBC cells and control cells (), and eliminated the discrepancy of metastasis between miR-365 overexpression GBC cells and control cells (), and abolished the distinct self-renewal ability between miR-365 overexpression GBC cells and their control cells (), suggesting that miR-365 suppressed GBC cell progression by directly regulating RAC1.
miR-365 expression was downregulated in human GBC tissues and predicted poor prognosis of Gallbladder carcinoma patients
We checked miR-365 expression by using a great amount of human GBC tissues. As shown in , miR-365 expression was dramatically reduced in 77.3% GBC cases (34/44) compared with the paired non-tumorous tissues, with a higher miR-365 transcripts observed in 22.7% of patients. Moreover, there was a significant negative correlation between miR-365 and RAC1 protein expression in GBC samples (r = 0.639, P < 0.001; ).
Figure 6. Expression of miR-365 was reduced in human GBC tissues. A. The mRNA expression of miR-365 in 44 pairs of GBC tissues (t) and their neighboring noncancerous tissues (n) was checked by real-time PCR analysis. miR-365 expression was reduced in GBC tissues (T) than their neighboring noncancerous tissues (N). B. Spearman correlation analysis of the relationship between RAC1 protein and miR-365 expression in 44 GBC specimens. C&D. RT-PCR and the expression of miR-365 were scoring in 80 human GBC samples. OS (p = 0.001) and DFS (p = 0.035) after surgery were compared between “low- miR-365 “ group (n = 40) and “high- miR-365” group (n = 40)
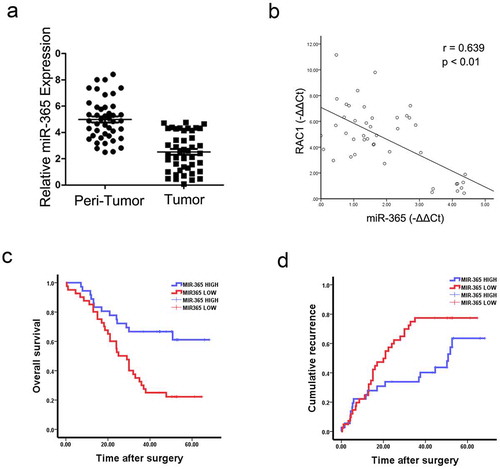
According to the miR-365 levels above or below the median score, 80 GBC patients were classified into “high- miR-365” group (n = 40) and “low- miR-365” group (n = 40). The survival time in “high-miR-365” group was longer than that in “low-miR-365” group ). Taken together, miR-365 could be a valuable prognostic factor for GBC patients.
Discussion
Gallbladder carcinoma is the most common biliary system malignant tumors [Citation30]. Most GBC patients diagnosis at advanced stage or had distant metastasis, its prognosis was poor [Citation31]. The recurrence rate after operative remains very high and only few patients were benefited from the treatment of radiotherapy or chemotherapy [Citation32]. However, the underlying molecular mechanisms of GBC initiation and progression remained to be explored. It is urgent to have a better understanding about the molecular pathogenesis of GBC for the sake of identifying GBC-specific targets for therapeutic intervention. In our present study, it was the first time to clarify that reduced expression of miR-365 was well associated with the prognosis of GBC patients, suggesting that miR-365 may prove to be a valuable prognostic marker for GBC patients.
It was reported that miRNAs are involved in the initiation and progression of human cancers, and may prove to be a novel marker for the diagnosis and treatment of cancers [Citation33]. Numerous studies showed that miR-365 works as a tumor suppressor gene in the initiation and progression of human cancers [Citation34]. miR-365 was also played an important role in liver cancer proliferation, metastasis and apoptosis. However, the potential role of miR-365 in GBC has not been reported. In our above work, miR-365 was downregulated in GBC tissues and associated with the prognosis of GBC patients. We also found that miR-365 gene overexpression by lenti-virus inhibited GBC cells proliferation and metastasis in vitro.
The existence of CSCs in solid tumors has been confirmed by numerous studies, and these cells have the abilities of self-renewal and differentiation, high tumorigenicity, and resistance to chemo treatments [Citation35–39]. The GBC CSCs were also considered to be the origin of chemoresistance and postoperative recurrence of GBC patients [Citation40]. It was urgent to explore the molecular mechanism underlying GBC CSC regulation so as to develop novel therapeutic strategies targeting CSCs. Whether miR-365 is involved or not in GBC CSCs expansion was ill-defined. Spheroid culture of cancer cells is a routine approach to enrich CSCs. We found that miR-365 expression was downregulated in GBC spheroids. Our data showed that miR-365 levels decreased in CD44+ or CD133+ GBC CSCs. CD44 and CD133 were remained as GBC CSC markers. Moreover, miR-365 overexpression in GBC cells inhibited the self-renewal capacity of GBC CSCs, and downregulated stemness-associated genes and GBC CSC markers.
Ras-related C3 botulinum toxin substrate 1 (RAC1) is a pleiotropic regulator of many cellular processes, including the cell cycle, cell-cell adhesion, motility, and of epithelial differentiation [Citation41]. Recent studies reported that RAC1 acts as an oncogene in many human tumors, including Gallbladder carcinoma, breast cancer, melanoma and liver cancer [Citation42]. In the present study, we for the first time found that RAC1 was a direct target of miR-365 in GBC cells. Overexpressing miR-365 in GBC cells downregulated RAC1 expression through directly binding to its 3’ UTR. EHop-016, a novel Rac inhibitor, was derived on the basis of the structure of NSC23766 and inhibits the activation of Rac with a substantially lower IC50 compared with NSC23766 [Citation43]. In addition, EHop-016 could abolish the discrepancy of the growth, metastasis and self-renewal ability between miR-365 overexpression GBC cells and their control cells, which further confirm RAC1 was the downstream of miR-365 in regulating GBC cells progression.
Here, we first showed that miR-365 was downregulated in GBC tissues, which in turn suppressed the growth, metastasis and self-renewal of GBC cells. Moreover, miR-365 suppressed GBC cells progression via directly regulating RAC1 in vitro. The findings of present study not only shed a new light on the mechanism of GBC progression but suggest a novel prognostic marker and a potential therapeutic target against GBC CSCs.
Disclosure statement
All authors declare no competing interests.
Additional information
Funding
References
- Zhu AX, Hong TS, Hezel AF, et al. Current management of gallbladder carcinoma. Oncologist. 2010;15(2):168–181.
- Jemal A, Bray F, Center MM, et al. Global cancer statistics. CA Cancer J Clin. 2011;61(2):69–90.
- Lazcano-Ponce EC, Miquel JF, Munoz N, et al. Epidemiology and molecular pathology of gallbladder cancer. CA Cancer J Clin. 2001;51(6):349–364.
- Wistuba II, Gazdar AF. Gallbladder cancer: lessons from a rare tumour. Nat Rev Cancer. 2004;4(9):695–706.
- Butte JM, Matsuo K, Gönen M, et al. Gallbladder cancer: differences in presentation, surgical treatment, and survival in patients treated at centers in three countries. J Am Coll Surg. 2011;212(1):50–61.
- Li M, Zhang Z, Li X, et al. Whole-exome and targeted gene sequencing of gallbladder carcinoma identifies recurrent mutations in the ErbB pathway. Nat Genet. 2014;46(8):872–876.
- Bayoumi AS, Sayed A, Broskova Z, et al. Crosstalk between long noncoding RNAs and MicroRNAs in health and disease. Int J Mol Sci. 2016;17(3):356.
- Parimon T, Brauer R, Schlesinger SY, et al. Syndecan-1 controls lung tumorigenesis by regulating microRNAs packaged in exosomes. Am J Pathol. 2018;188:1094–1103.
- Li L, Tang J, Zhang B, et al. Epigenetic modification of MiR-429 promotes liver tumour-initiating cell properties by targeting Rb binding protein 4. Gut. 2015;64(1):156–167.
- Cha SY, Choi YH, Hwang S, et al. Clinical impact of microRNAs associated with cancer stem cells as a prognostic factor in ovarian carcinoma. J Cancer. 2017;8(17):3538–3547.
- Chen PS, Su JL, Hung MC. Dysregulation of microRNAs in cancer. J Biomed Sci. 2012;19:90.
- Long M, Zhan M, Xu S, et al. miR-92b-3p acts as a tumor suppressor by targeting Gabra3 in pancreatic cancer. Mol Cancer. 2017;16(1):167.
- DeSano JT, Xu L. MicroRNA regulation of cancer stem cells and therapeutic implications. Aaps J. 2009;11(4):682–692.
- Bao B, Azmi A, Li Y, et al. Targeting CSCs in tumor microenvironment: the potential role of ROS-associated miRNAs in tumor aggressiveness. Curr Stem Cell Res Ther. 2014;9(1):22–35.
- Chen Z, Huang Z, Ye Q, et al. Prognostic significance and anti-proliferation effect of microRNA-365 in hepatocellular carcinoma. Int J Clin Exp Pathol. 2015;8(2):1705–1711.
- Guo SL, Ye H, Teng Y, et al. Akt-p53-miR-365-cyclin D1/cdc25A axis contributes to gastric tumorigenesis induced by PTEN deficiency. Nat Commun. 2013;4:2544.
- Liu Y, Zhang G, Li H, et al. Serum microRNA-365 in combination with its target gene TTF-1 as a non-invasive prognostic marker for non-small cell lung cancer. Biomed Pharmacother. 2015;75:185–190.
- Liu Y, Zhang W, Liu S, et al. miR-365 targets ADAM10 and suppresses the cell growth and metastasis of hepatocellular carcinoma. Oncol Rep. 2017;37(3):1857–1864.
- Li XF, Chen C, Xiang D-M, et al. Chronic inflammation-elicited liver progenitor cell conversion to liver cancer stem cell with clinical significance. Hepatology. 2017;66:1934–1951.
- Xiang D, Cheng Z, Liu H, et al. Shp2 promotes liver cancer stem cell expansion by augmenting beta-catenin signaling and predicts chemotherapeutic response of patients. Hepatology. 2017;65(5):1566–1580.
- Sharma KL, Yadav A, Gupta A, et al. Association of genetic variants of cancer stem cell gene CD44 haplotypes with gallbladder cancer susceptibility in North Indian population. Tumour Biol. 2014;35(3):2583–2589.
- Ma S, Lee TK, Zheng B-J, et al. CD133+ HCC cancer stem cells confer chemoresistance by preferential expression of the Akt/PKB survival pathway. Oncogene. 2008;27(12):1749–1758.
- Yamashita T, Ji J, Budhu A, et al. EpCAM-positive hepatocellular carcinoma cells are tumor-initiating cells with stem/progenitor cell features. Gastroenterology. 2009;136(3):1012–1024.
- Shi CJ, Gao J, Wang M, et al. CD133(+) gallbladder carcinoma cells exhibit self-renewal ability and tumorigenicity. World J Gastroenterol. 2011;17(24):2965–2971.
- Jin K, Xiang Y, Tang J, et al. miR-34 is associated with poor prognosis of patients with gallbladder cancer through regulating telomere length in tumor stem cells. Tumour Biol. 2014;35(2):1503–1510.
- Xiang DM, Sun W, Ning BF, et al. The HLF/IL-6/STAT3 feedforward circuit drives hepatic stellate cell activation to promote liver fibrosis. Gut. 2018 Sep;67(9):1704–1715
- Wu K, Ding J, Chen C, et al. Hepatic transforming growth factor beta gives rise to tumor-initiating cells and promotes liver cancer development. Hepatology. 2012;56(6):2255–2267.
- Sun X, Xu C, Xiao G, et al. Breast cancer stem-like cells are sensitized to tamoxifen induction of self-renewal inhibition with enforced Let-7c dependent on Wnt blocking. Int J Mol Med. 2018. DOI:10.3892/ijmm.2018.3388.
- Montalvo-Ortiz BL, Castillo-Pichardo L, Hernández E, et al. Characterization of EHop-016, novel small molecule inhibitor of Rac GTPase. J Biol Chem. 2012;287(16):13228–13238.
- Zhao S, Cao Y, Liu S-B, et al. The E545K mutation of PIK3CA promotes gallbladder carcinoma progression through enhanced binding to EGFR. J Exp Clin Cancer Res. 2016;35(1):97.
- Caldow Pilgrim CH, Groeschl RT, Quebbeman EJ, et al. Recent advances in systemic therapies and radiotherapy for gallbladder cancer. Surg Oncol. 2013;22(1):61–67.
- Xie F, Xu X, Xu A, et al. Aberrant activation of Sonic hedgehog signaling in chronic cholecystitis and gallbladder carcinoma. Hum Pathol. 2014;45(3):513–521.
- Lim LP, Lau NC, Garrett-Engele P, et al. Microarray analysis shows that some microRNAs downregulate large numbers of target mRNAs. Nature. 2005;433(7027):769–773.
- Xu Y, Chu H, Zhou Y, et al. miR-365 functions as a tumor suppressor by directly targeting CYR61 in osteosarcoma. Biomed Pharmacother. 2017;98:531–537.
- Xiao Y, Lin M, Jiang X, et al. The recent advances on liver cancer stem cells: biomarkers, separation, and therapy. Anal Cell Pathol (Amst). 2017;2017:5108653.
- Wang X, Sun W, Shen W, et al. Long non-coding RNA DILC regulates liver cancer stem cells via IL-6/STAT3 axis. J Hepatol. 2016;64(6):1283–1294.
- Tharmapalan P, Mahendralingam M, Berman HK, et al. Mammary stem cells and progenitors: targeting the roots of breast cancer for prevention. Embo J. 2019;38(14):e100852.
- Su R, Dong L, Li Y, et al. Targeting FTO suppresses cancer stem cell maintenance and immune evasion. Cancer Cell. 2020;38(1):79–96 e11.
- Bekaii-Saab T, El-Rayes B. Identifying and targeting cancer stem cells in the treatment of gastric cancer. Cancer. 2017;123(8):1303–1312.
- Li XX, Wang J, Wang H-L, et al. Characterization of cancer stem-like cells derived from a side population of a human gallbladder carcinoma cell line, SGC-996. Biochem Biophys Res Commun. 2012;419(4):728–734.
- Li S, Yan T, Deng R, et al. Low dose of kaempferol suppresses the migration and invasion of triple-negative breast cancer cells by downregulating the activities of RhoA and Rac1. Onco Targets Ther. 2017;10:4809–4819.
- Araiza-Olivera D, Feng Y, Semenova G, et al. Suppression of RAC1-driven malignant melanoma by group A PAK inhibitors. Oncogene. 2017;37:944–952.
- Humphries-Bickley T, Castillo-Pichardo L, Corujo-Carro F, et al. Pharmacokinetics of Rac inhibitor EHop-016 in mice by ultra-performance liquid chromatography tandem mass spectrometry. J Chromatogr B Analyt Technol Biomed Life Sci. 2015;981–982:19–26.